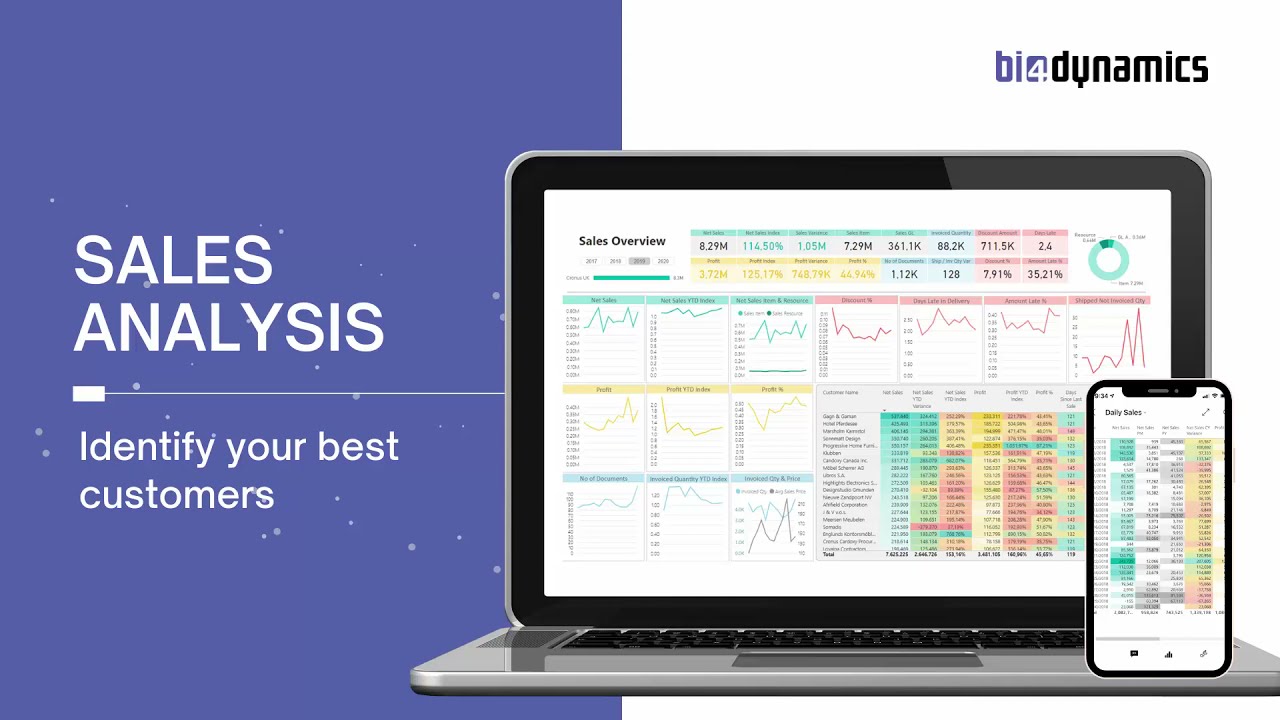
Sales
Sales cube comes with 495 measures organized in nine measure groups:
- Sales Orders: monitor sales operational performance (Ordered / Reserved / Picked / Delivered / Open Amount & Quantity physically & financially, blocked, completed, Backlog Amount & Qty by PDD and RDD, some measures in Unit of Measure).
- Sales Invoice: analyze where sales and profit are generated (Gross/Net Sales, Costs, Discounts, Profits, Commissions, Charges, Benefits, Averages, date comparisons, Last transactions) from standard document header and lines or free-text documents.
- Sales Forecasts: compare sales forecasts and actuals (Forecast Amounts, Qty, Discounts, Sales and Cost Price, with variances and date comparisons.
- Sales Delivery: track delivery performance (Days / Amount / Qty / Lines late by five different dates, Availability Rate Delivered / Invoiced, Packing slip information, OTIF%),
- Sales Opportunities: Analyze Opportunities.
- Sales Quotes: Analyze Quotes.
Measure groups are sharing 66 dimensions with 642 attributes in 128 hierarchies.

The lowest data granularity in every module is a document, sometimes also a line.
Watch the video to see Sales Area in action
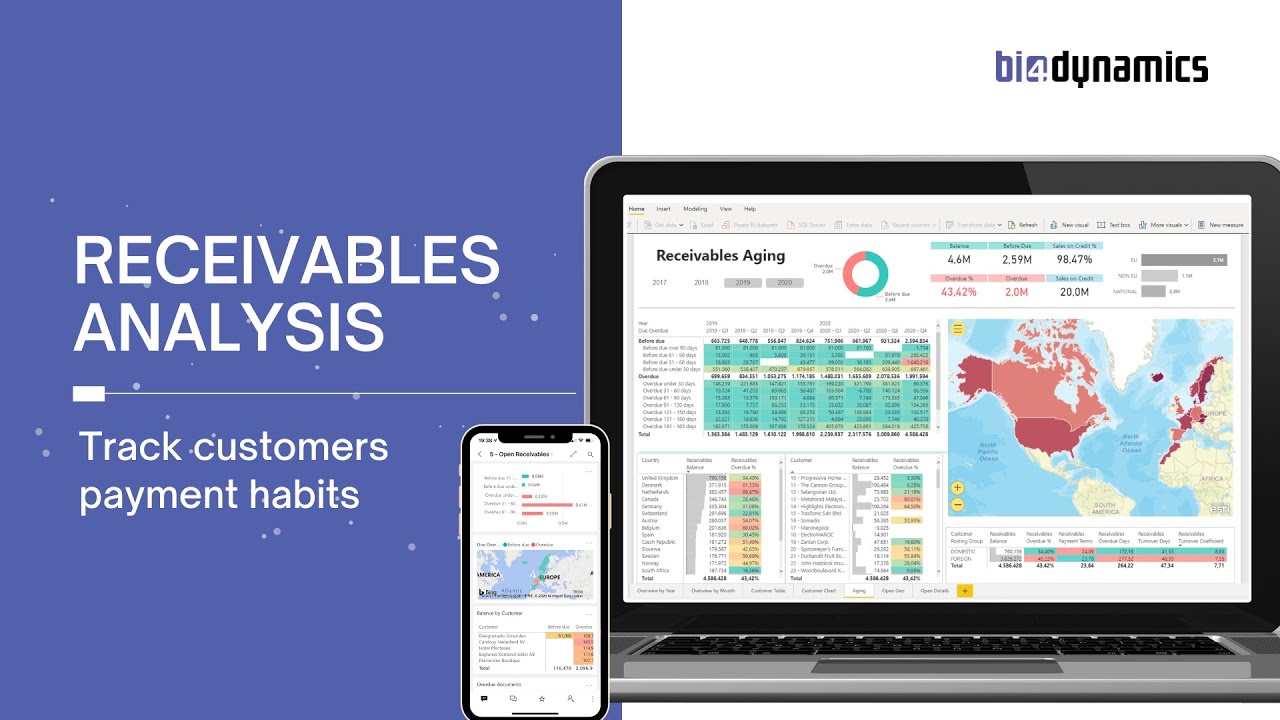
Receivables
Receivables are the most standardized business area, and the cube comes with 72 measures organized in two measure groups:
- Receivable Analysis: analyze balances (Average Due / Open / Overdue day – these measures calculated as weighted averages).
- Customer Analysis: get insight into customer transactions (with standard Debit, Credit, Net change and Payment terms also as weighted average, as well as some specific measures Sales on Credit as amount and percentage).
Averages are calculated as weighted averages giving the most accurate information.
Measure groups are sharing 26 dimensions with 227 attributes in 50 hierarchies.
Finance
Finance cube comes with 203 measures organized in three measure groups:
- General Ledger: analyze transactions and balances.
- General Ledger Budget: analyze budget and budget variances.
- Financial Statements: use AX reports from Traditional Financial Statements.
By combining financial dimensions, a user gets unimaginative flexibility for financial reporting in Excel or Power BI.
Measure groups are sharing 29 dimensions with 92 attributes in 11 hierarchies.
Account Schedules flexibility, 15 global dimensions, and additional currency. This is all you need for any business or accounting top-bottom analysis

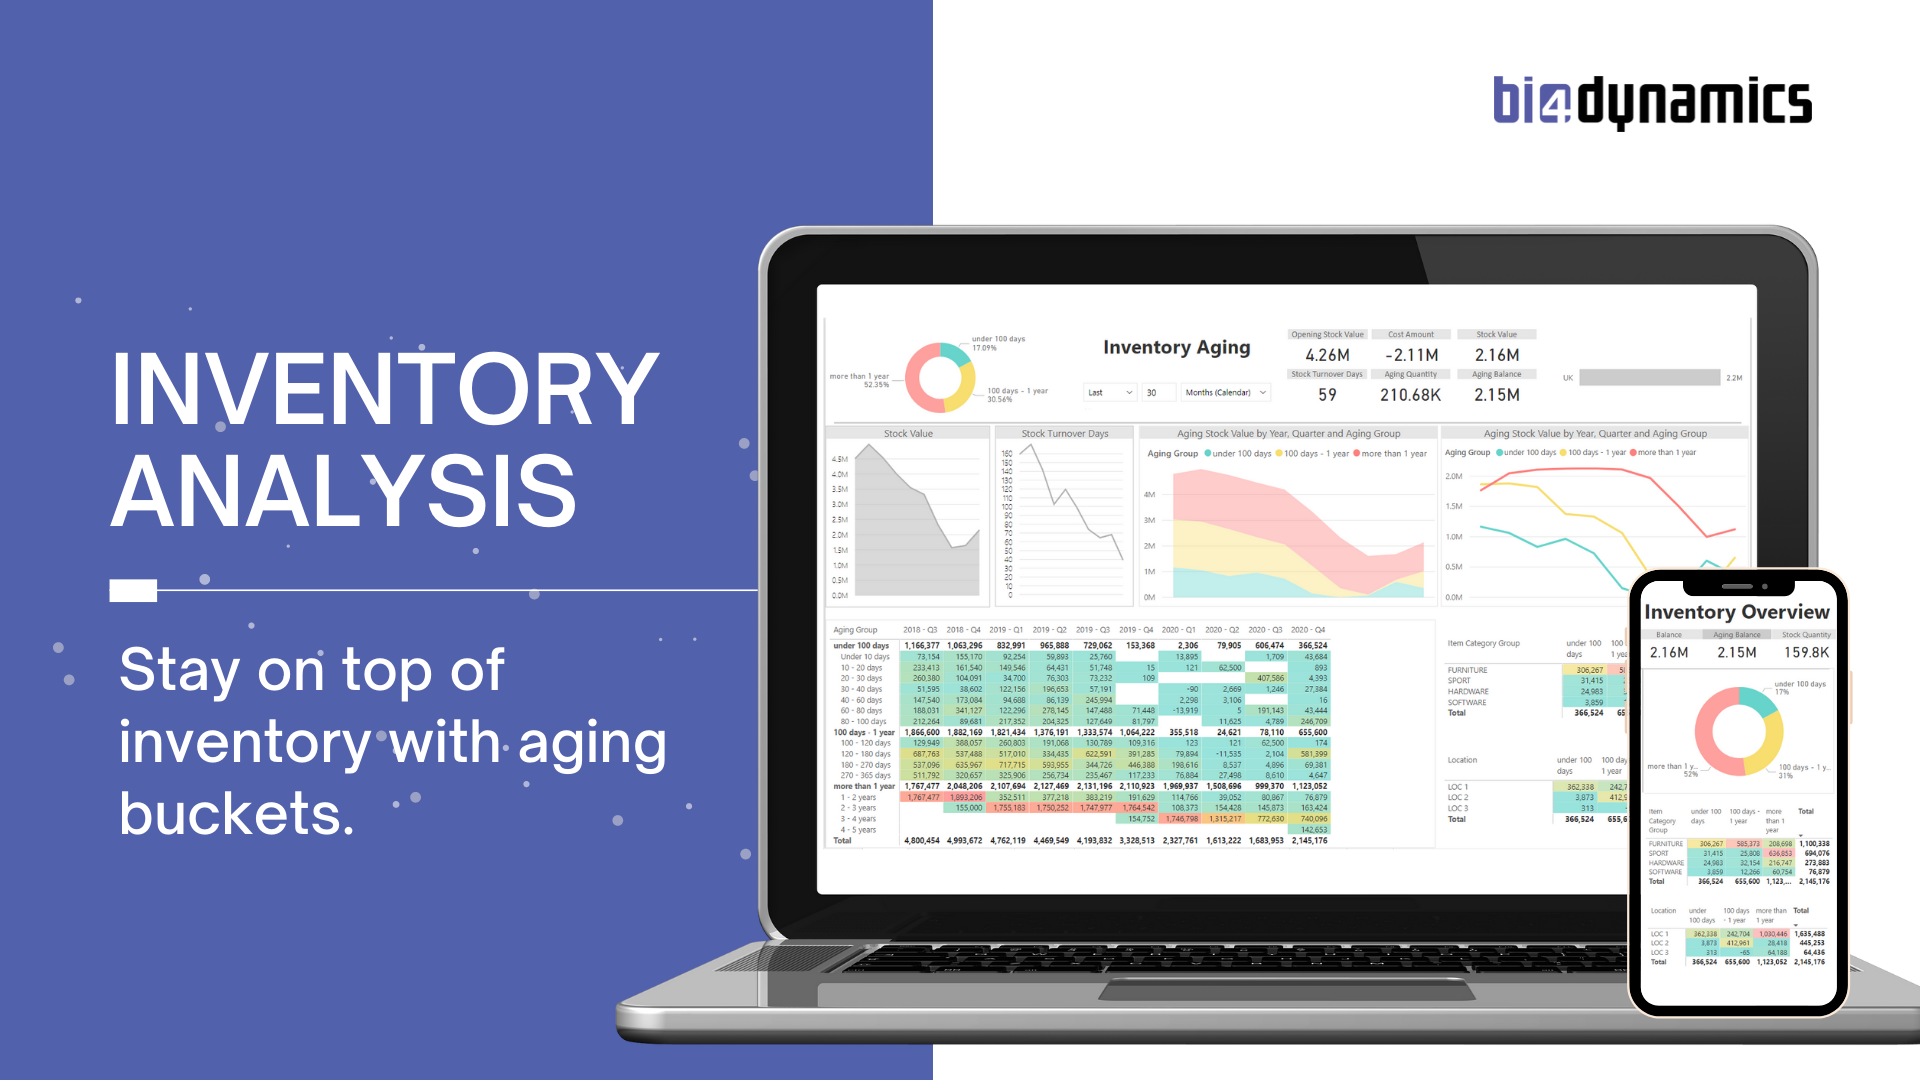
Inventory
Inventory cube comes with 104 measures organized in five measure groups:
- Inventory Transactions: analyze Cost and Quantity (Issued / Received by Date Physical / Date Financial), adjustments, and average costs.
- Inventory State: track the dynamics of your Inventory (Opening / Closing Qty and Value Balances, Stock Rotation in days, Min / Max Values, Average Qty, and Value over time).
- Inventory Aging: track aging value and quantity by setting periodical snapshot, save to historical data and analyze changes over time by detailed aging buckets.
- Inventory Journal: analyze Cost, Qty, and Price of journal transactions(increase, decrease, net change) commonly used for tracking wastage, shrinkage, and similar transactions.
- Inventory Transfers: analyze transfers between locations.
Measure groups are sharing 28 dimensions with 338 attributes in 54 hierarchies.

Purchase
Purchase cube comes with 330 measures organized in six measure groups:
- Purchase Orders: monitor purchase operational performance (Qty Ordered / Arrived / Pending / Received / Remain / Registered, Lines Early / Late / On-Time as value and %, Lines fulfilled / Partially fulfilled / Not fulfilled as value and %, Amount Ordered with date comparison, some measures in Unit of Measure).
- Purchase Invoice: analyze the cost of items and services (Cost amount, Discount, Charges, Quantity, Price, Last purchase transactions) from standard document header and lines or free-text documents.
- Purchase Delivery: score vendor performance as the difference in planned date (Confirmed Delivery Date or Confirmed Shipping Date or Requested Shipping Date) and actual Receipt date and calculate Days, Lines, Amount and Qty Late and On-time as value and %.
- Purchase Forecast: compare purchase forecasts and actuals(Forecast Amounts, Qty, Discounts, Price) with variances and date comparisons.
- Purchase Invoice Misc Charges and Purchase Invoice Charges.
Measure groups are sharing 48 dimensions with 467 attributes in 75 hierarchies.


Payables
Payables cube comes with 64 measures organized in two measure groups:
- Payables State to analyze vendor payment habits (Payment Term / Open / Overdue Days – all measures calculated as weighted averages), Days Payables Outstanding, and Payable Coefficient. Balances are calculated daily for every open document, with the option to compress on a weekly or monthly level for prior periods (to gain performance and save disk space).
- Vendor Analysis” to get insight into vendor transactions with specific measures Purchase on Credit as amount and percentage).
Measure groups are sharing 26 dimensions with 120 attributes in 16 hierarchies.
Retail
Retail cube comes with 766 measures organized in ten measure groups:
- Retail Payments: analyze payment trends (types, averages)
- Retail POS Batch: analyze POS events (durations, logons, returns, voids, transactions, returns)
- Retail Sales Transactions: analyze Gross / Net Sales (per Line, M2, Staff, Store, Terminal, Assortment), Profit and Qty, Basket Value, Store Size, Returns, Tax, and Discounts.
- Retail Stock Information: snapshot information about Stock Qty (Arrived, Available, Ordered, Picked, Registered, Reserved) and Stock Value (Physical, Posted) inside of the Retail cube.
- Retail Store Information: track Store Area M2 that is used for calculation of averages in other measure groups.
- Retail Transaction Table: have a more condensed view over retail sales and payments.
- Retail Voided Payments: analyze voided payments
- Retail Voided Sales Transactions: analyze voided sales transactions
- Retail Assortment and Retail Transaction Statistics.
Measure groups are sharing 38 dimensions with 255 attributes in 44 hierarchies.


Production
Production cube comes with 103 measures organized in 4 measure groups:
- Production Transactions: analyze Input, Output, and WIP estimates and actuals with details “from which input products have been produced” or “where (for which Item) a consumed material has been used”.
- Production Shop Floor Control: Availability, Efficiency, Performance, and OEE.
- Production Route Transactions: Analysis of Route Cost and Hours.
Measure groups are sharing 34 dimensions with 208 attributes in 37 hierarchies.
Projects
No usage of project module in AX is the same, flexibility on details is the key. Project cube comes with 723 measures organized in two measure groups:
- Project Actual: track Actual Revenue (Invoiced / Accrued / WIP), Consumption and Cost (by Items / Hours / Expenses) to get Actual Cash (Inflow / Outflow) with Profit and Loss.
- Project Budgets: compare budgets and actuals.
Measure groups are sharing 33 dimensions with 271 attributes in 61 hierarchies.

Fixed Assets
Fixed Asset cube comes with 10 measures organized in one measure group:
- Fixed Assets: analyze transactions and balances of Fixed Assets.
Measure groups are sharing 22 dimensions with 96 attributes in 7 hierarchies.
Product information
Product Information cube comes with 6 measures organized in two measure group:
- Item Information: count items across various item attributes and hierarchies.
- Trade Agreement: analyze dynamics in Customer and Vendor trade agreements.
Measure groups are sharing 9 dimensions with 231 attributes in 69 hierarchies.
Framework
Framework module measures BI4Dynamics daily processing execution time of Stage, Data Warehouse, or Modules. It offers a report of the top 30 stored procedures with details such as:
- Count of added records,
- Processing time in milliseconds and minutes, etc.
