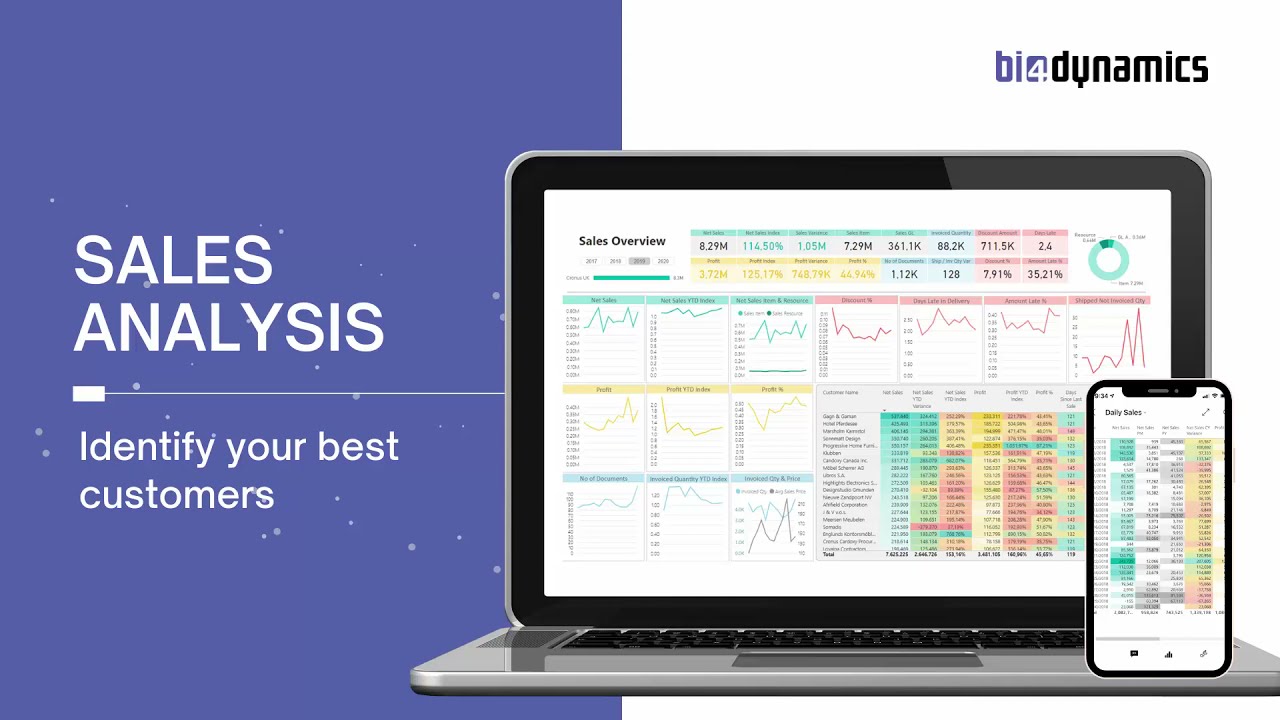
Sales
Sales cube comes with 322 measures organized in six measure groups:
- Sales Values: We have it all. Analyze sales and profit (Gross / Net Sales, Costs, Discounts, Profits, Invoiced Quantities, Charges, Average Sales/Cost/Profit) from posted sales and service transactions with strongly supported time intelligence (YTD, YoY, PoP, 12 Last months, Rolling 3/6/12) and Expected values (Net Sales, Profit, Cost) coming from Value Entry. There are 81 measures in ACY (additional currency for reporting is selected from the Currency table) for consolidation and 8 measures in Posted currency. Follow Last Sales Transactions by any dimension or hierarchy if customers are changing buying habits.
- Sales Orders. Analyze sales documents (Quotes, Orders, Return orders, Open invoices, and Credit memos) by any measure or dimension available in Sales Header or Sales Line.
- Sales Orders Archive: Analyze archive of sales documents long after these have been changed, posted or deleted (standard BC functionality to track all changes) by any measure or dimension available in Sales Order Archive or Sales Line Archive, additionally to the Last archive in a day and Last archive in a month. With a simple change in BC, you can analyze also orders which are posted immediately after creation.
- Sales Delivery: Calculate the day difference between sales line Delivery date and sales shipment Posting date and track your companies delivery performance to your customers by Days Late, Amount Late, Qty Late, Lines Late, Amount On-Time, Qty On-Time, Lines On-Time as well as percentages. As a Delivery date, you can choose one from four dates (Planned Delivery, Planned Shipment, Promised Delivery, and Requested Delivery) available in Sales Line.
- Sales Budgets: Compare sales budgets, actuals, and variances (Net Sales, Qty, and Cost) with well-supported time intelligence and comparisons. There are 8 measures in ACY (additional currency for reporting) for consolidation.
- Sales Quantities: Analyze Shipped Quantities and verify that all that has been shipped is also invoiced in a straightforward measure Shipped/Invoiced Variance that should be equal to zero).
Measure groups are sharing 42 dimensions with 476 attributes in 71 hierarchies.

The lowest data granularity in every module is a document, sometimes also a line.
Watch the video to see Sales Area in action
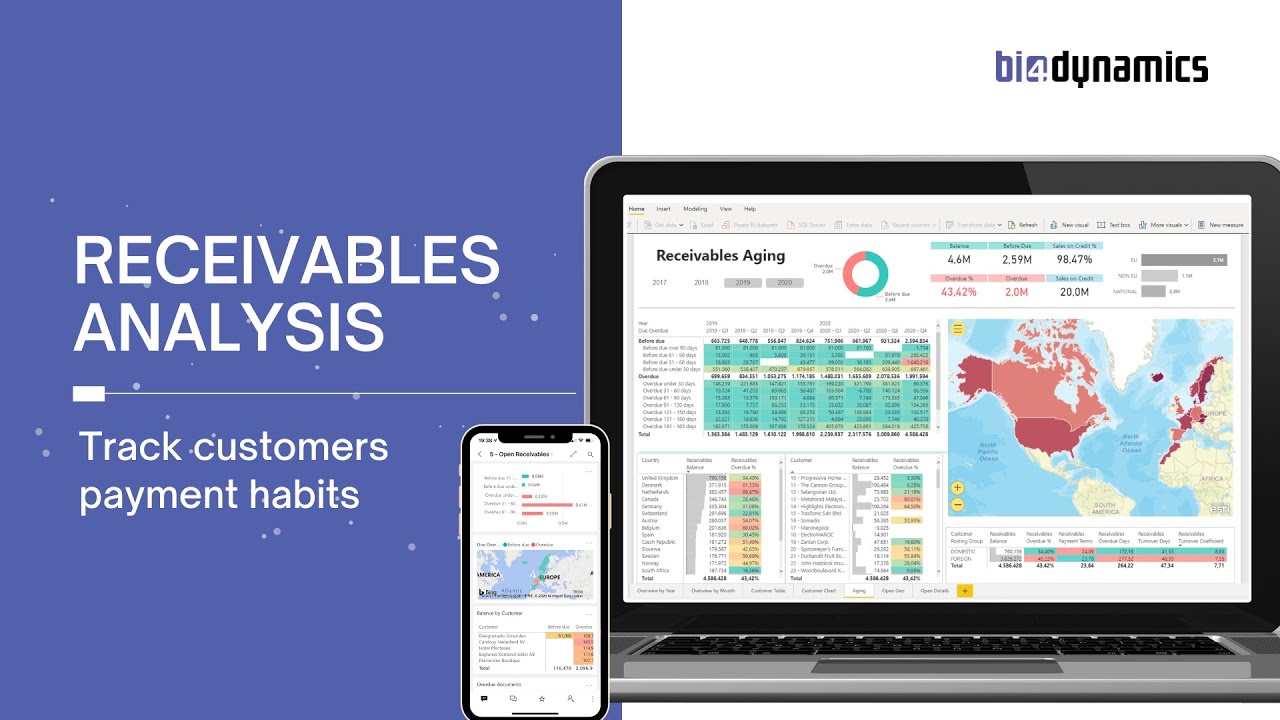
Receivables
Receivables are the most standardized business area, and the cube comes with 50 measures organized in two measure groups:
- Receivables Transactions: get insight into customer transactions (with standard Debit, Credit, Net change and Payment terms also as weighted average, as well as some specific measures Sales on Credit as amount and percentage).
- Receivables State: Analyze balances that are calculated daily for every open document (Opening, Closing, Average, Due and Overdue, Overdue %). Track customer payment habits starting from Payment Terms to Average Open Days and Average Overdue Days – all 3 measures are calculated as weighted averages. Setup and compress data on a weekly or monthly level to gain loading time and save disk space.
Averages are calculated as weighted averages giving the most accurate information.
Measure groups are sharing 9 dimensions with 227 attributes in 34 hierarchies.

Finance
Finance cube comes with 179 measures organized in six measure groups:
- Account Schedules: Transform your static Account Schedules from BC to BI, combine it with any standard BI dimension or any 20 global BC dimension and get unimaginative flexibility for financial reporting in Excel or Power BI.
- GL Analysis: Analyze GL transactions and balances in local currency as well as addition currency for reporting (ACY) for consolidation.
- GL Budget: Analyze GL budget and budget variances with well supported time intelligence and comparisons.
- Cost Accounting: Analyze Cost Entries as allocated GL transactions by Account Schedules or Cost Center hierarchy, this module is ideal for top-bottom analysis. All details exposed.
- Cash Flow: analyze Cash flow (standard BC module) by Source Type, Account and track it down to Forecast document level.
Measure groups are sharing 22 dimensions with 215 attributes in 33 hierarchies.

Account Schedules flexibility, 20 global dimensions, and additional currency. This is all you need for any business or accounting top-bottom analysis
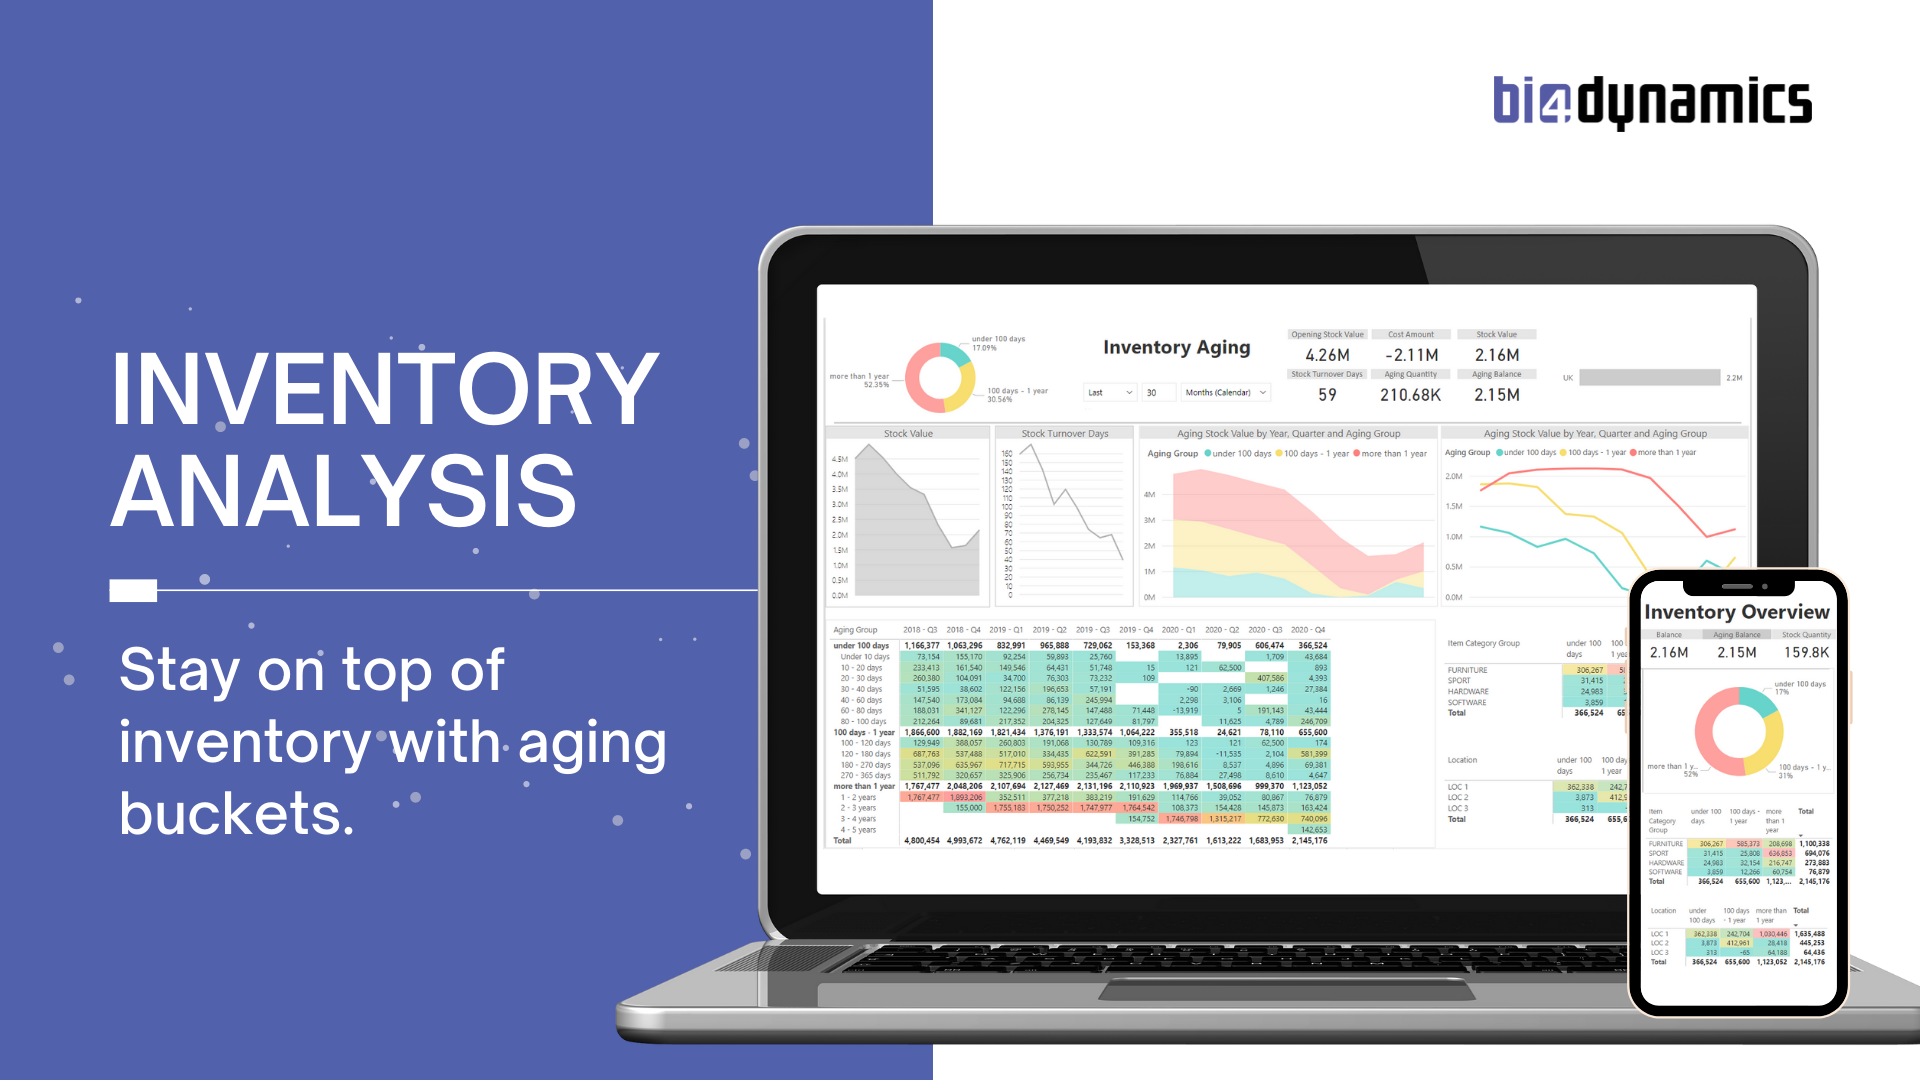
Inventory
Inventory cube comes with 152 measures organized in four measure groups:
- Inventory Invoiced Transactions: analyze Cost and Quantity (Amount, Increase, Decrease) by Entry type (in multiple variants of measure), Average costs and Expected values (Posted to GL or Inventory Cost).
- Inventory Shipped Transactions: analyze Cost and Quantity (Amount, Increase,
- Inventory State: track dynamics of your Inventory (Opening / Closing Qty and Balance, Stock Rotation in days, Min / Max Values, Average Qty and Value over time).
- Inventory Aging: track Aging value and quantity from first BC transactions with all changes over time by detailed aging buckets.
Measure groups are sharing 18 dimensions with 174 attributes in 16 hierarchies.

Purchase
Purchase cube comes with 131 measures organized in seven measure groups:
- Purchase Values: Analyze the cost of Items, GL postings (services), Charges and Fixed Assets (Cost amount, Discount, Quantity, Price, Last purchase transactions) from standard invoiced transactions as well as from specific NAV information like Cost Amount Expected.
- Purchase Orders. Analyze purchase documents (Quote, Order, Blanket Order, Return order, Invoice, and Credit memo) by any measure or dimension available in Purchase Header or Purchase Line.
- Purchase Order Archive: Analyze archive of purchase documents long after these have been changed, posted or deleted (standard BC functionality to track all changes) by any measure or dimension available in Purchase Order Archive or Purchase Line Archive, additionally to Last archive in a day and Last archive in a month. With simple change in BC you can analyze also orders which are posted immediately after creation. Very useful for companies with long delivery cycles.
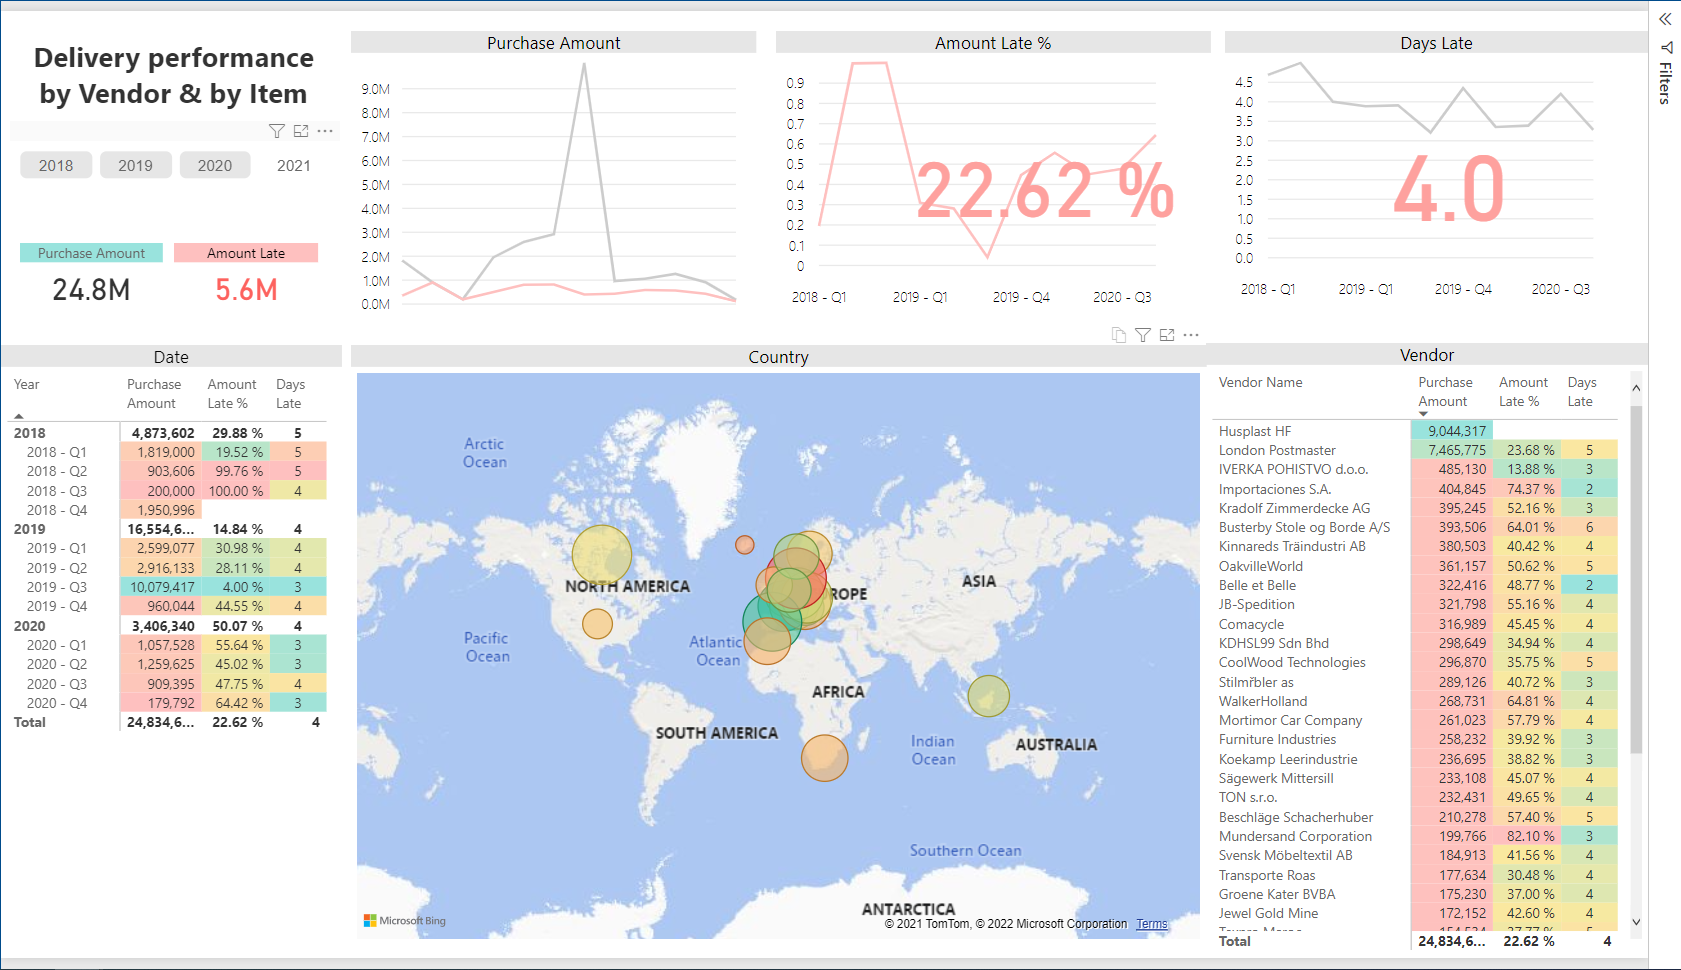
- Purchase Delivery: Calculate the difference between Delivery Date (select one from Exp. Delivery Date, Planned Received Date, Promised Receipt Date, Requested Receipt Date) from Purchase order line and actual Posting date of Receipt to calculate Days Late. Extend this information to Lines Late, Lines Late %, Qty Late, Qty Late & and Amount Late, Amount Late % for everything that you purchase (Item, GL services, Fixed Assets) Score vendor performance and use the benefit of information that your vendor doesn’t have.
- Purchase Budgets: compare purchase budgets and actuals (Budget Cost and Qty) with variances and date comparisons.
Measure groups are sharing 35 dimensions with 429 attributes in 65 hierarchies.


Payables
Payables cube comes with 49 measures organized in two measure groups:
- Payables State to analyze vendor payment habits (Payment Term / Open / Overdue Days – all measures calculated as weighted averages), Days Payables Outstanding and Payable Coefficient. Balances are calculated daily for every open document, with the option to compress on a weekly or monthly level for prior periods (to gain performance and save disk space).
- Vendor Analysis” to get insight into vendor transactions with specific measures Purchase on Credit as amount and percentage).
Measure groups are sharing 9 dimensions with 125 attributes in 20 hierarchies.
Manufacturing
Manufacturing cube comes with 107 measures organized in four measure groups:
- Manufacturing: Analyze Input, Output and Work-in-progress of quantities and values across items and capacities. Get answer to questions from output perspective “how have been produced products over time” or from input perspective “where – in which items – has been consumed a material or capacity” for possible cost control or product recall.
- Manufacturing Expected: Compare expected values (before starting Production Order) with actuals and for costs and quantities at any level of production process and improve production BOM.
- Capacity Calendar: Analyze capacity, actuals and variance of Work Centers (people, machines) group by any BC attribute.
- Capacity Times: Run, Setup and Stop Time, also available as percentage.
Measure groups are sharing 25 dimensions with 166 attributes in 21 hierarchies.


Projects (Jobs & Resources)
Analyzing Jobs requires flexibility on details. Job cube comes with 249 measures organized in three measure groups:
- Job Actual: track Sales (Net, Gross, Discounts, Profits) and Hours with Actual and Expected values with details related to Item, GL, and Resource.
- Job Planning: compare Scheduled and Contracted measures and compare it with Actuals as absolute or relative numbers (% Complete and % Contracted).
- Resource Capacity: analyze capacity and utilization of Resource.
Measure groups are sharing 10 dimensions with 99 attributes in 17 hierarchies.
Retail
Retail cube comes with 330 measures organized in seven measure groups:
- POS Sales: Analyze Gross / Net Sales (per Line, M2, Item, Staff, Store, and Terminal), Profit and Qty, Basket Value, Store Size, Returns, Tax, and Discounts. Well supported time intelligence with Daily / Weekly / Monthly Sales and many variances (YTD, MTD, WTD, YoY and PoP) of base measures. 89 measures are available in ACY (additional currency)
- POS Payments: Analyze payment habits (Net Amount, Average Payment) by Tender Type, Card down to payment line.
- POS Batch: Analyze POS events (durations, logons, returns, voids, transactions, returns)
- POS Vouchers: Analyze Open amount, Net amount, and Applied amount by Created, Applied, and Expired Date of Vouchers.
- Retail Store Information: Track Store Area M2 (from store information or from store sections) that is used for calculation of averages in other measure groups
- Voided POS Payments: Analyze voided payments
- Voided POS Sales: Analyze voided sales transactions
Measure groups are sharing 41 dimensions with 212 attributes in 38 hierarchies.

Fixed Assets Analysis
Fixed Assets Analysis cube comes with 64 measures organized in 3 measure groups and 32 dimensions.
- FA Entry: analyze Fixed Assets amounts by Depreciation Book, FA Posting Category, FA Posting date, Group and Type, and various Codes.
- Maintenance Entry: Analyze Maintainance Amount and Quantity by Location, Maintenance, Fixed Asset, Depreciation Book.
- Maintenance Registration: Analyze the Number of Maintenance Registrations by various dimensions.
Employee Analysis
Employee Analysis cube comes with 14 measures and 5 dimensions.
- Employee Absence: analyze employee absence (Cause of Absence, Date, Employee Absence Description and Human Resource Unit of Measure) and compare it to previus years.
Warehouse Analysis
Warehouse Analysis cube comes with 47 measures organized in 8 measure groups and 22 dimensions.
- Transfer Orders: Analyze Transfer Orders by Document Transfer Order, Item, Item Category, Item Variant, Location In-Transit, Location Transfer From, Location Transfer To, Shipment Method, Shipping Agent, Shipping Agent Services, Source Code, Store, Transport Method.
- Posted Transfer Receipts / Shipments: Analyze Transfer Receipts / Shipments by Date, Item, Item Category, Item Variant, Location Transfer From, Location Transfer To, Receipt Date, Shipment Date, Shipment Method, Shipping Agent, Shipping Agent Services and Transport Method.
- Posted Inventory Put-Away: Analyze Transfer Shipments by Date, Document Posted Inv Put-away No, Item, Item Variant, Location, Posted Inv Put-away Source Document/Type/No, Shipment Method, Shipping Agent, Shipping Agent Services and Zone.
- Posted Inventory Pick: Analyze Transfer Shipments by Date, Item, Item Variant, Location, Shipment Method, Shipping Agent, Shipping Agent Services and Zone.
- Warehouse: Analyze Warehouse by Date, Item and Location.
- Warehouse Shipment: Analyze Warehouse Shipment by Date.
- Warehouse registered Activity Document: Analyze registered Activity Document by Date.
Item Information Analysis
Item Information Analysis cube comes with 29 measures organized in 3 measure groups.
- Item Information: Count Items by any of many Item attributes or hierarchies.
- Purchase Price Information: Analyze Purchase Price and Discount change by Buy from Vendor, Currency, Date, Ending Date, Item, Item Unit of Measure and Item Variant.
- Sales Price Information: Analyze Sales Price and Discount change by Currency, Date, Ending Date, Item, Item Unit of Measure, Item Variant, Sales Price Code & Type, Sell-to Customer, VAT Business Posting Group and Item Vendor.
Measure groups are sharing 13 dimensions with 99 attributes in 28 hierarchies.
Service Analysis
Service Analysis cube comes with 18 measures organized in 2 measure groups and 10 dimensions.
- Service: Analyze Service by Bill To Customer, Date, Document Service, Item, Item Category, Item Variant, Location, Sell To Customer and Unit of Measure.
- Service Contract Line: Analyze Service Contract line by Bill To Customer, Item, Last Service Date and Unit of Measure.
Framework
Framework module measures BI4Dynamics daily processing execution time of Stage, Data Warehouse, or Modules. It offers a report of the top 30 stored procedures with details such as:
- Count of added records,
- Processing time in milliseconds and minutes, etc.
