Turnkey Analytics Solution for Microsoft Dynamics 365 Finance and Operations
Powerful Analytics for Microsoft D365 Finance and Operations
BI4Dynamics delivers analytics for Microsoft Dynamics 365 Finance and Operations by automatically copying ~200 tables suitable for analytics from Microsoft Finance and Operations into a Data Warehouse. Through this automated process, BI4Dynamics generates over 1 million lines of code, resulting in an analytical model with more than 3,000 BI fields (KPIs) that can be accessed through predefined Power BI or Excel dashboards.
Unlock over 150+ ready-to-use Power BI dashboards and turn your D365 Finance and Operations data into actionable insights, allowing for data-driven decisions from day one.
Ready-to-use Power BI and Excel Reports
Drag and Drop
Pre-made Reports
Fully customizable 150+ Ready-to-use Power BI reports with 3000+ KPIs
Easy & Fast
Setup
Proven out-of-the-box insights
covering all Dynamics areas
Self-Service
Customizations
Add any field from Dynamics
with a click of a mouse
Made for Dynamics 365 Finance. BI4Dynamics uses Microsoft Fabric in it’s newest version.
Visualisations are out-of-the-box, done in Power BI or Excel. Analysis are done in Azure.
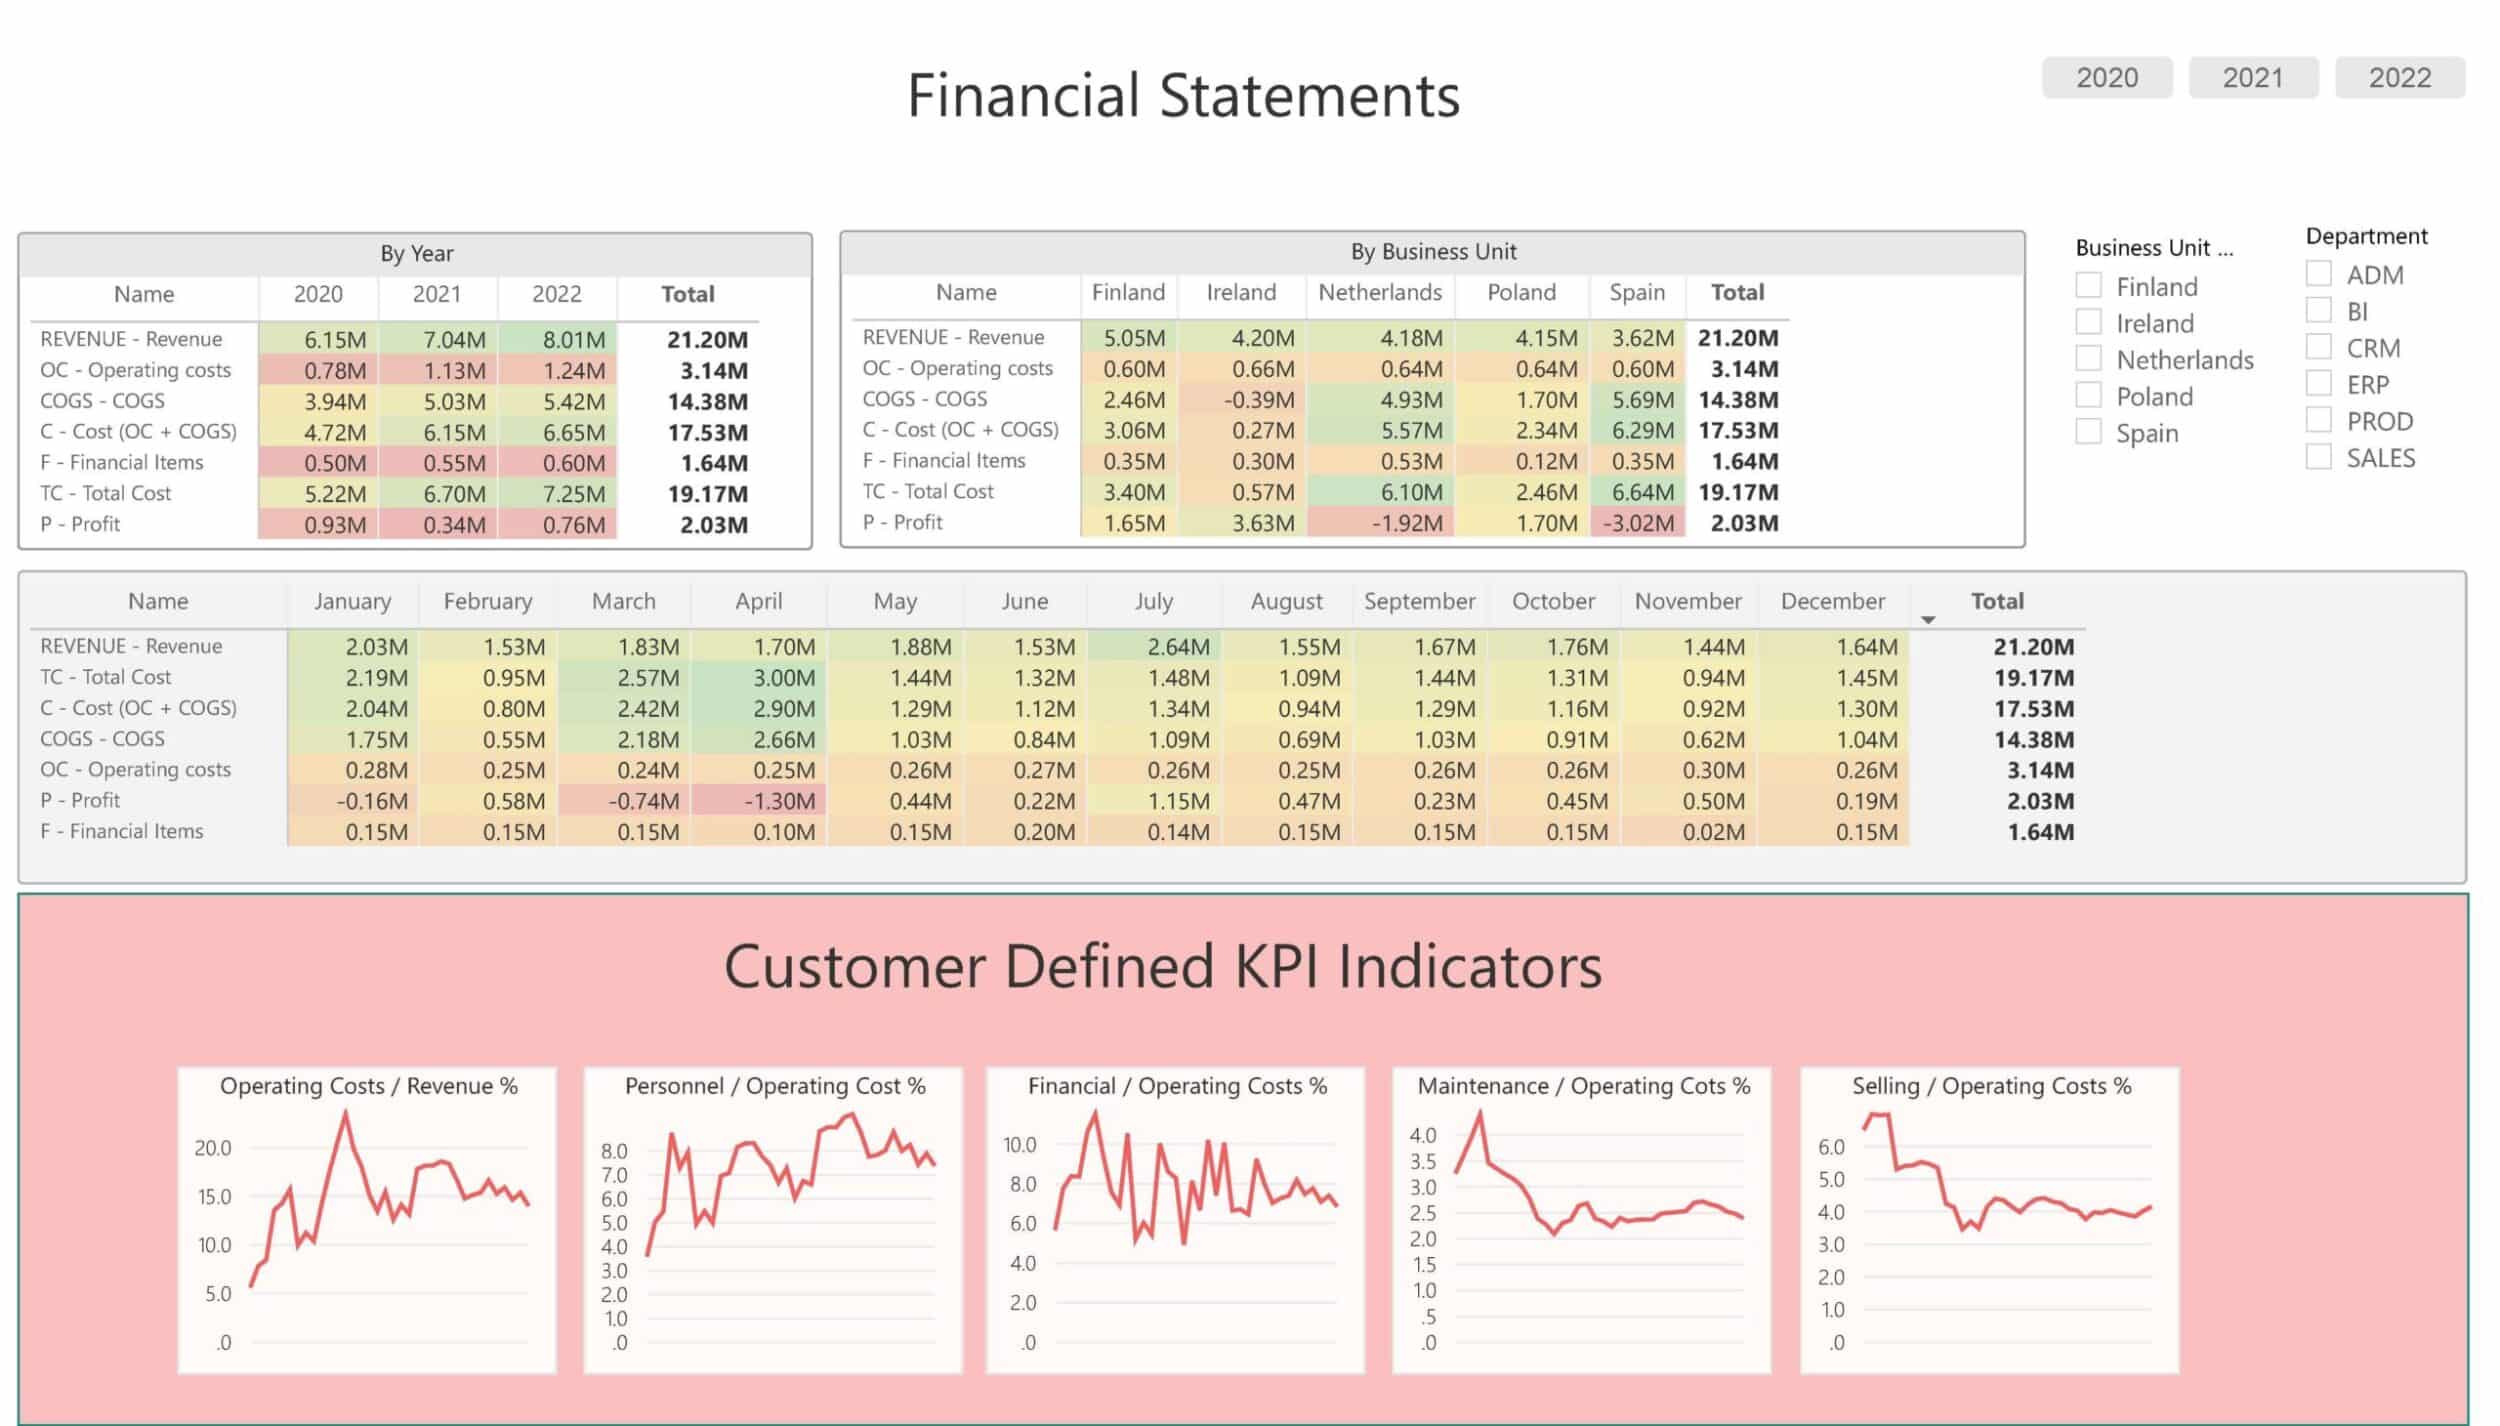
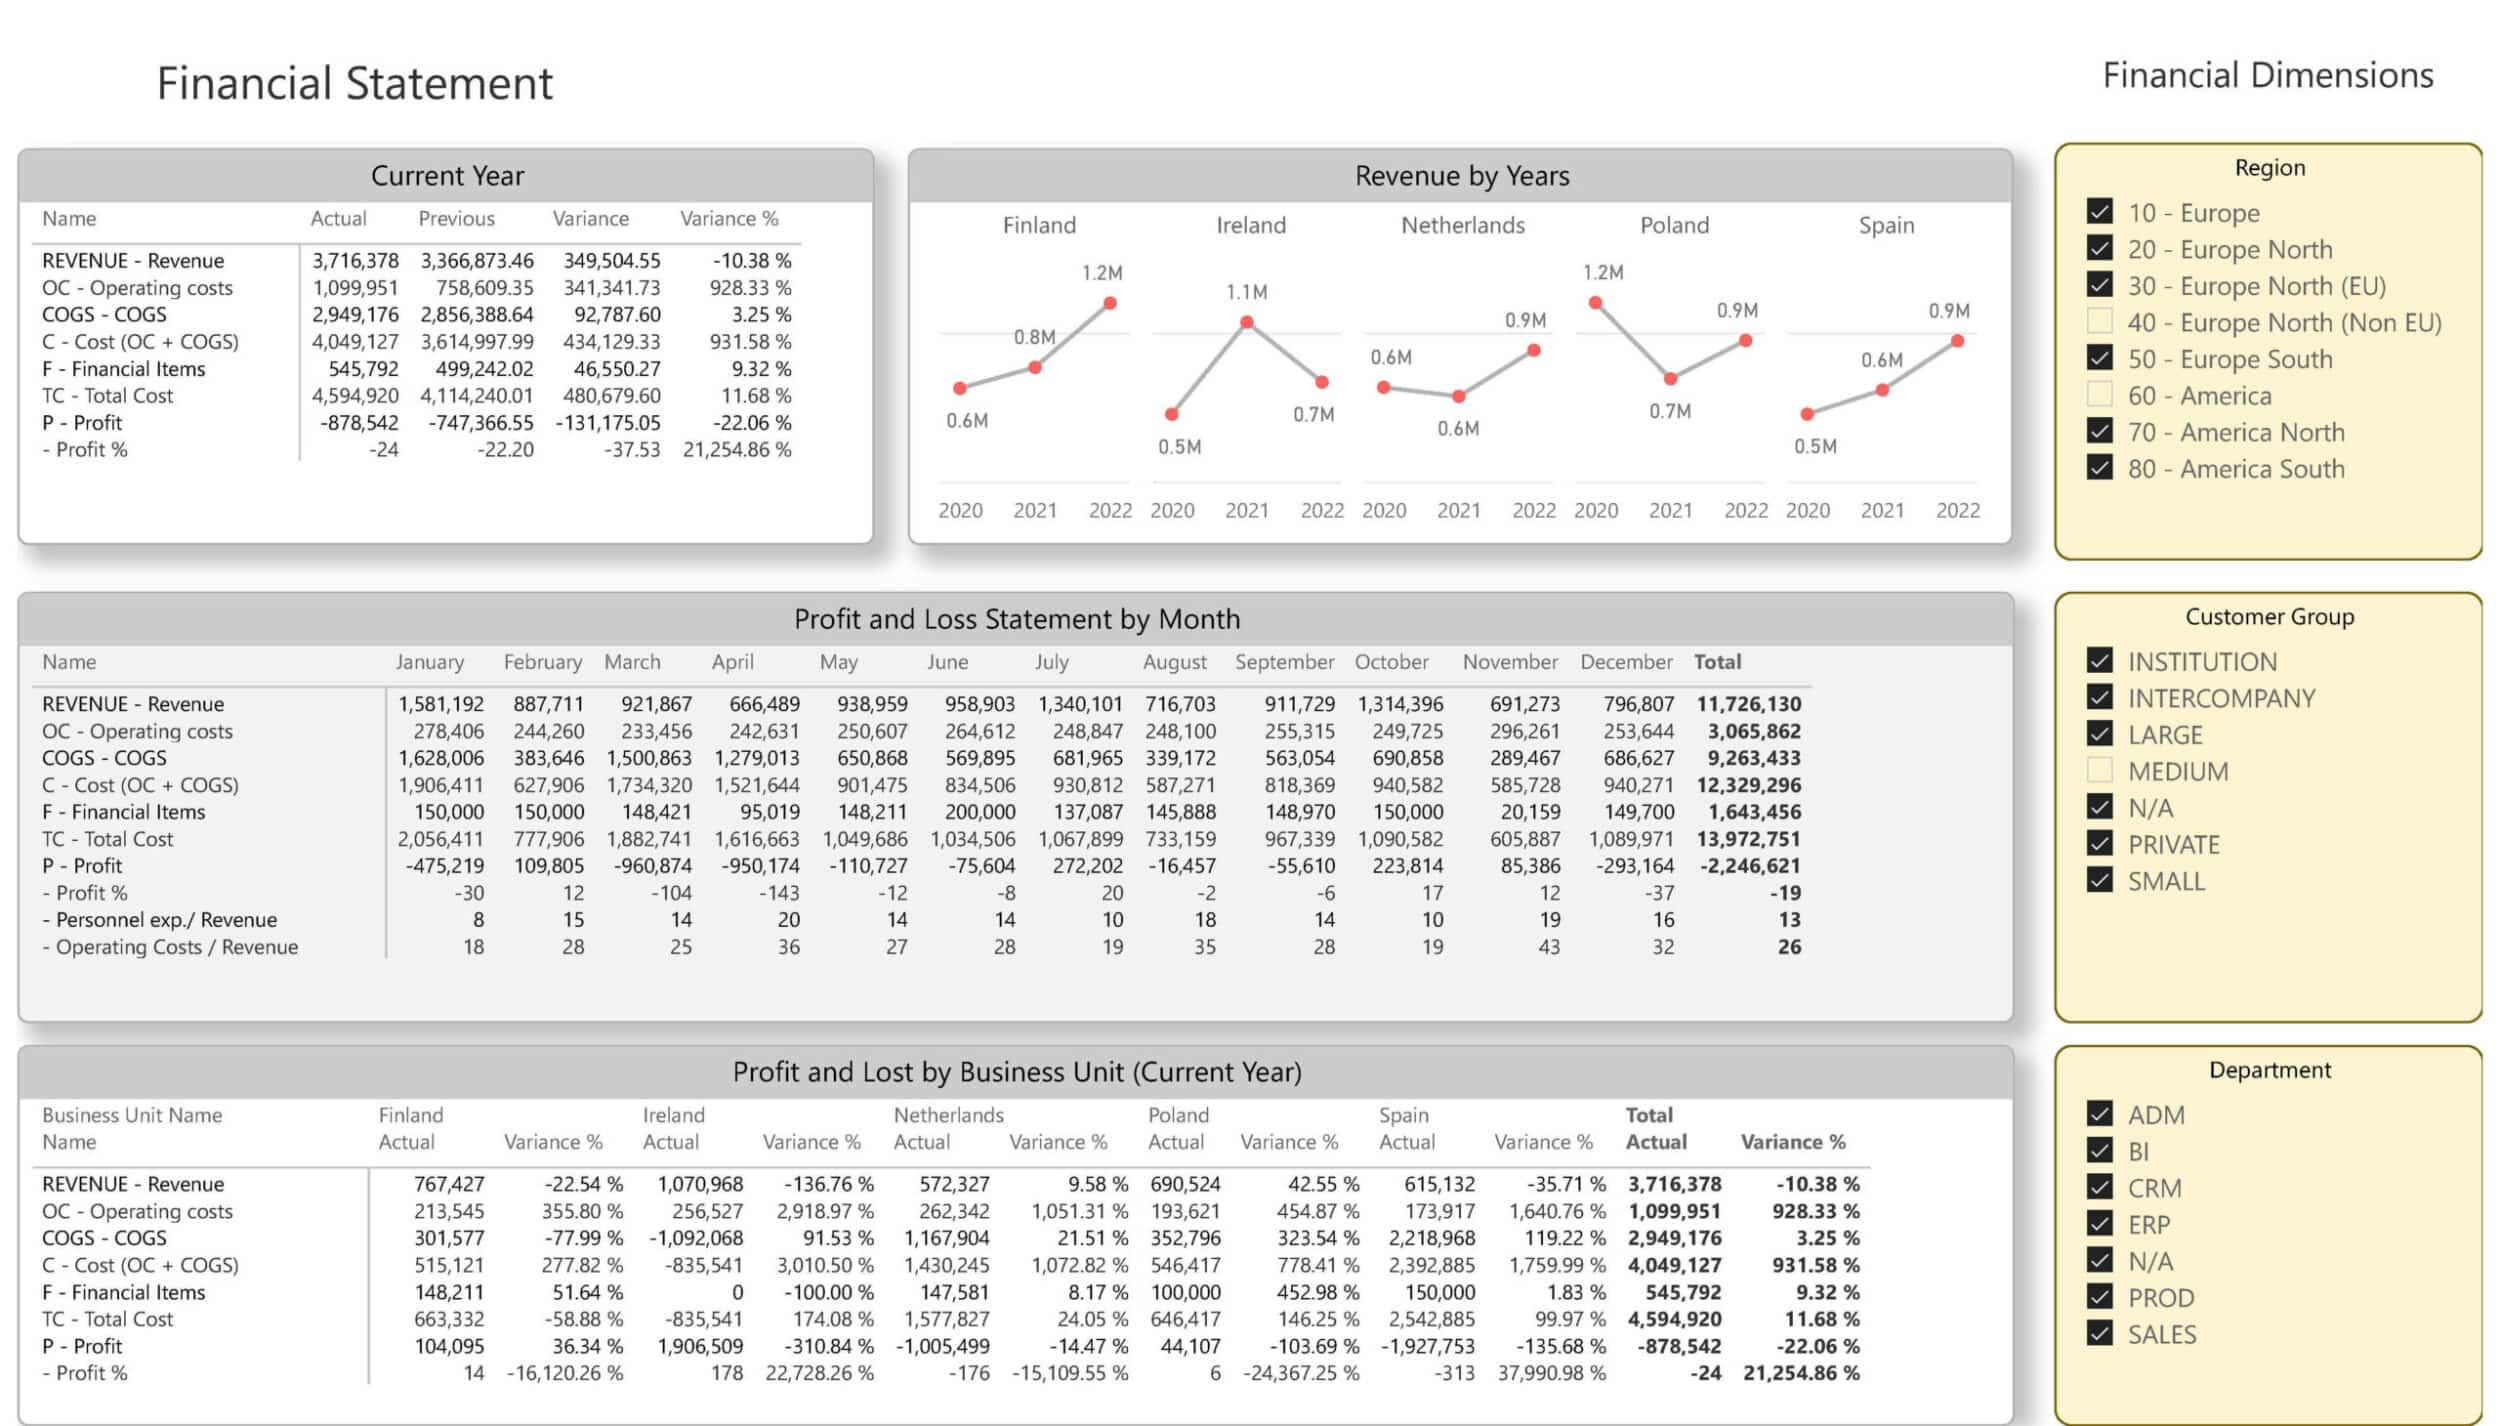
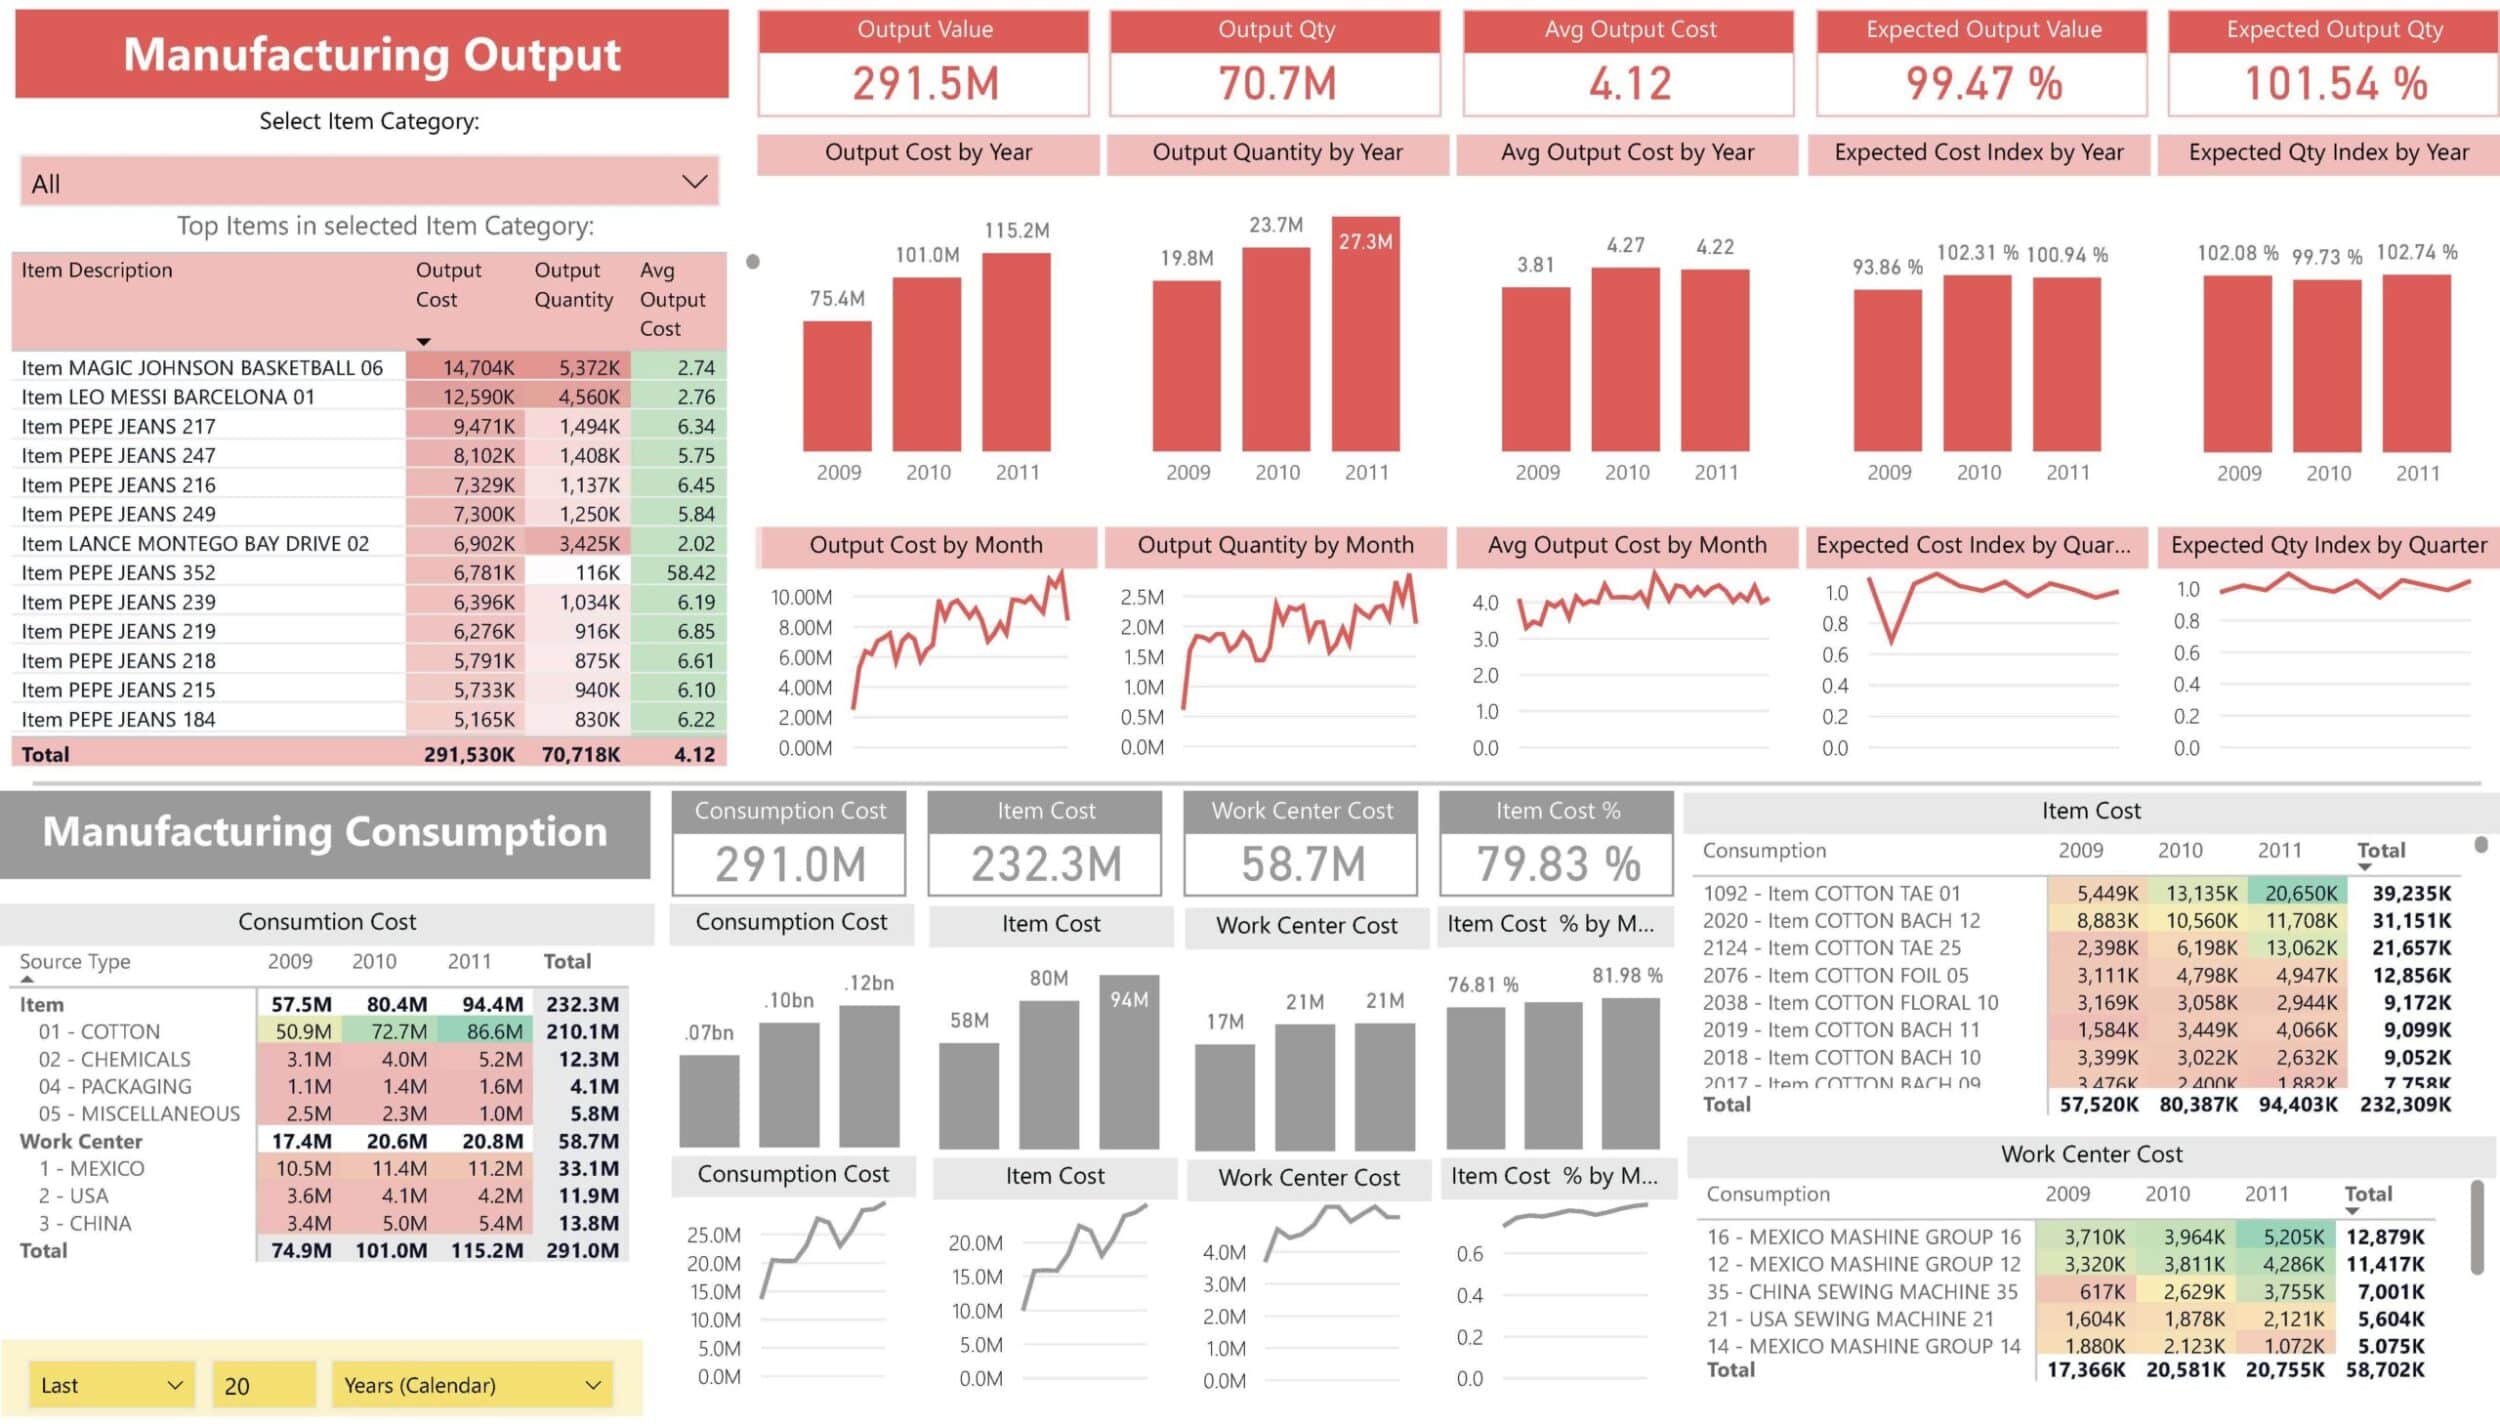
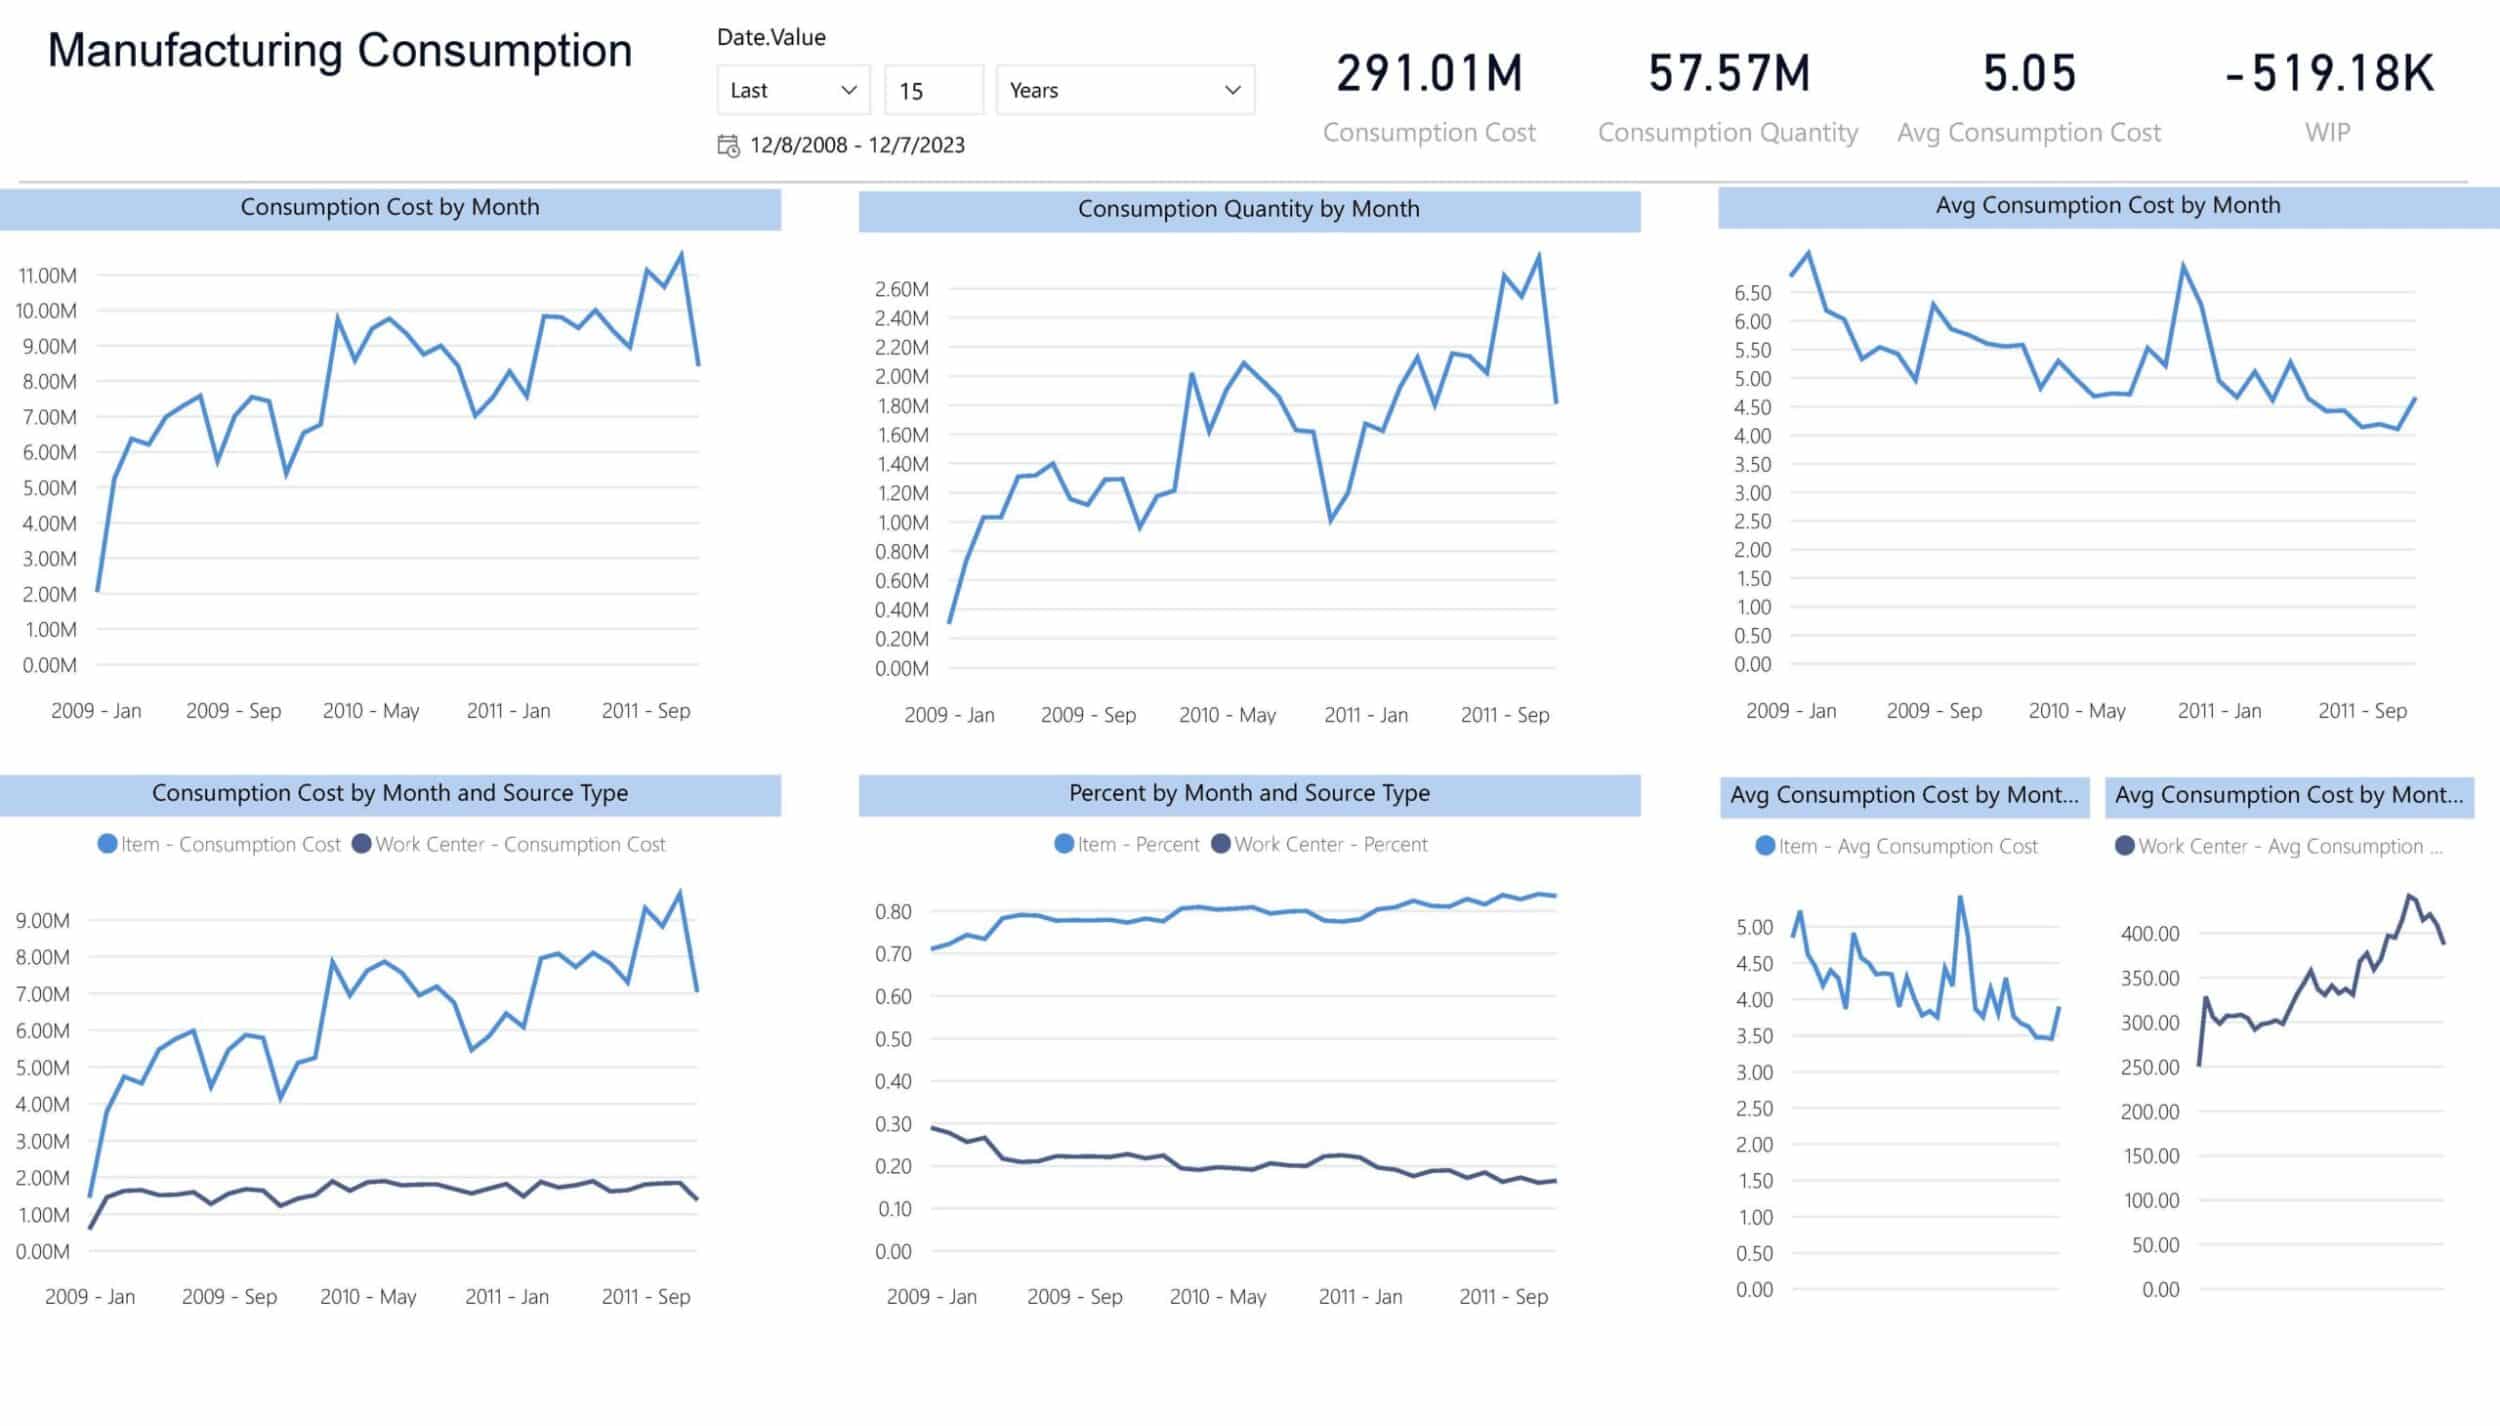
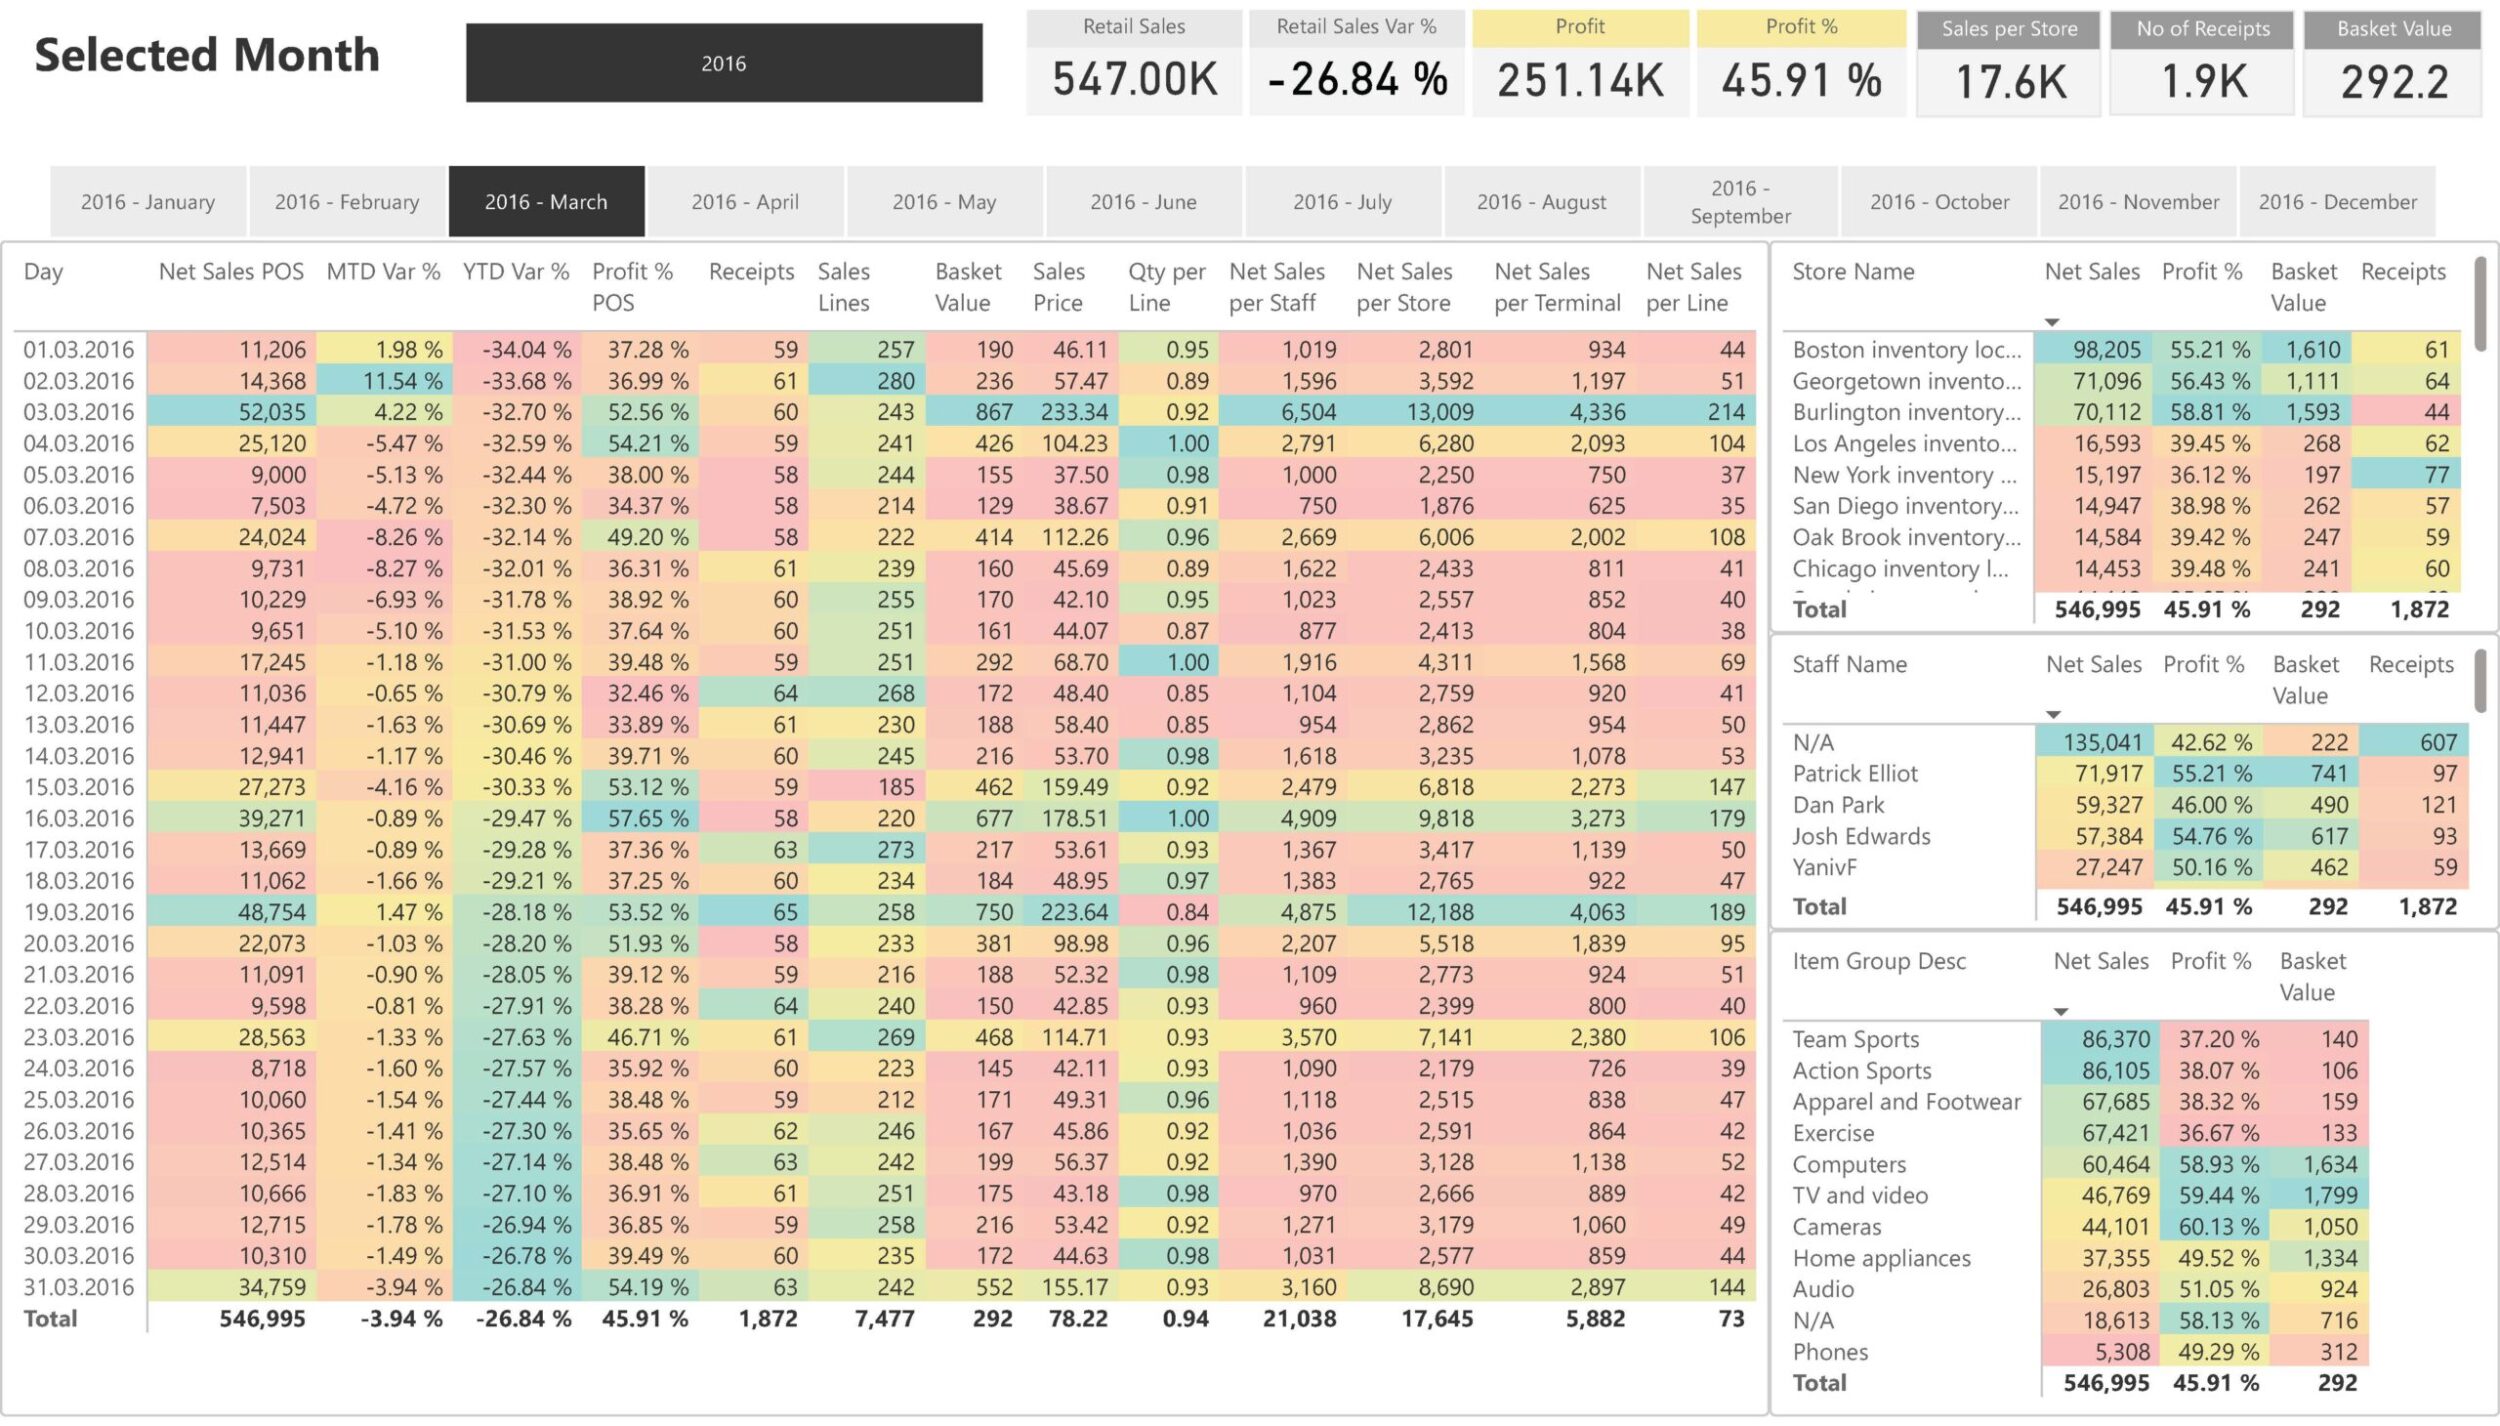
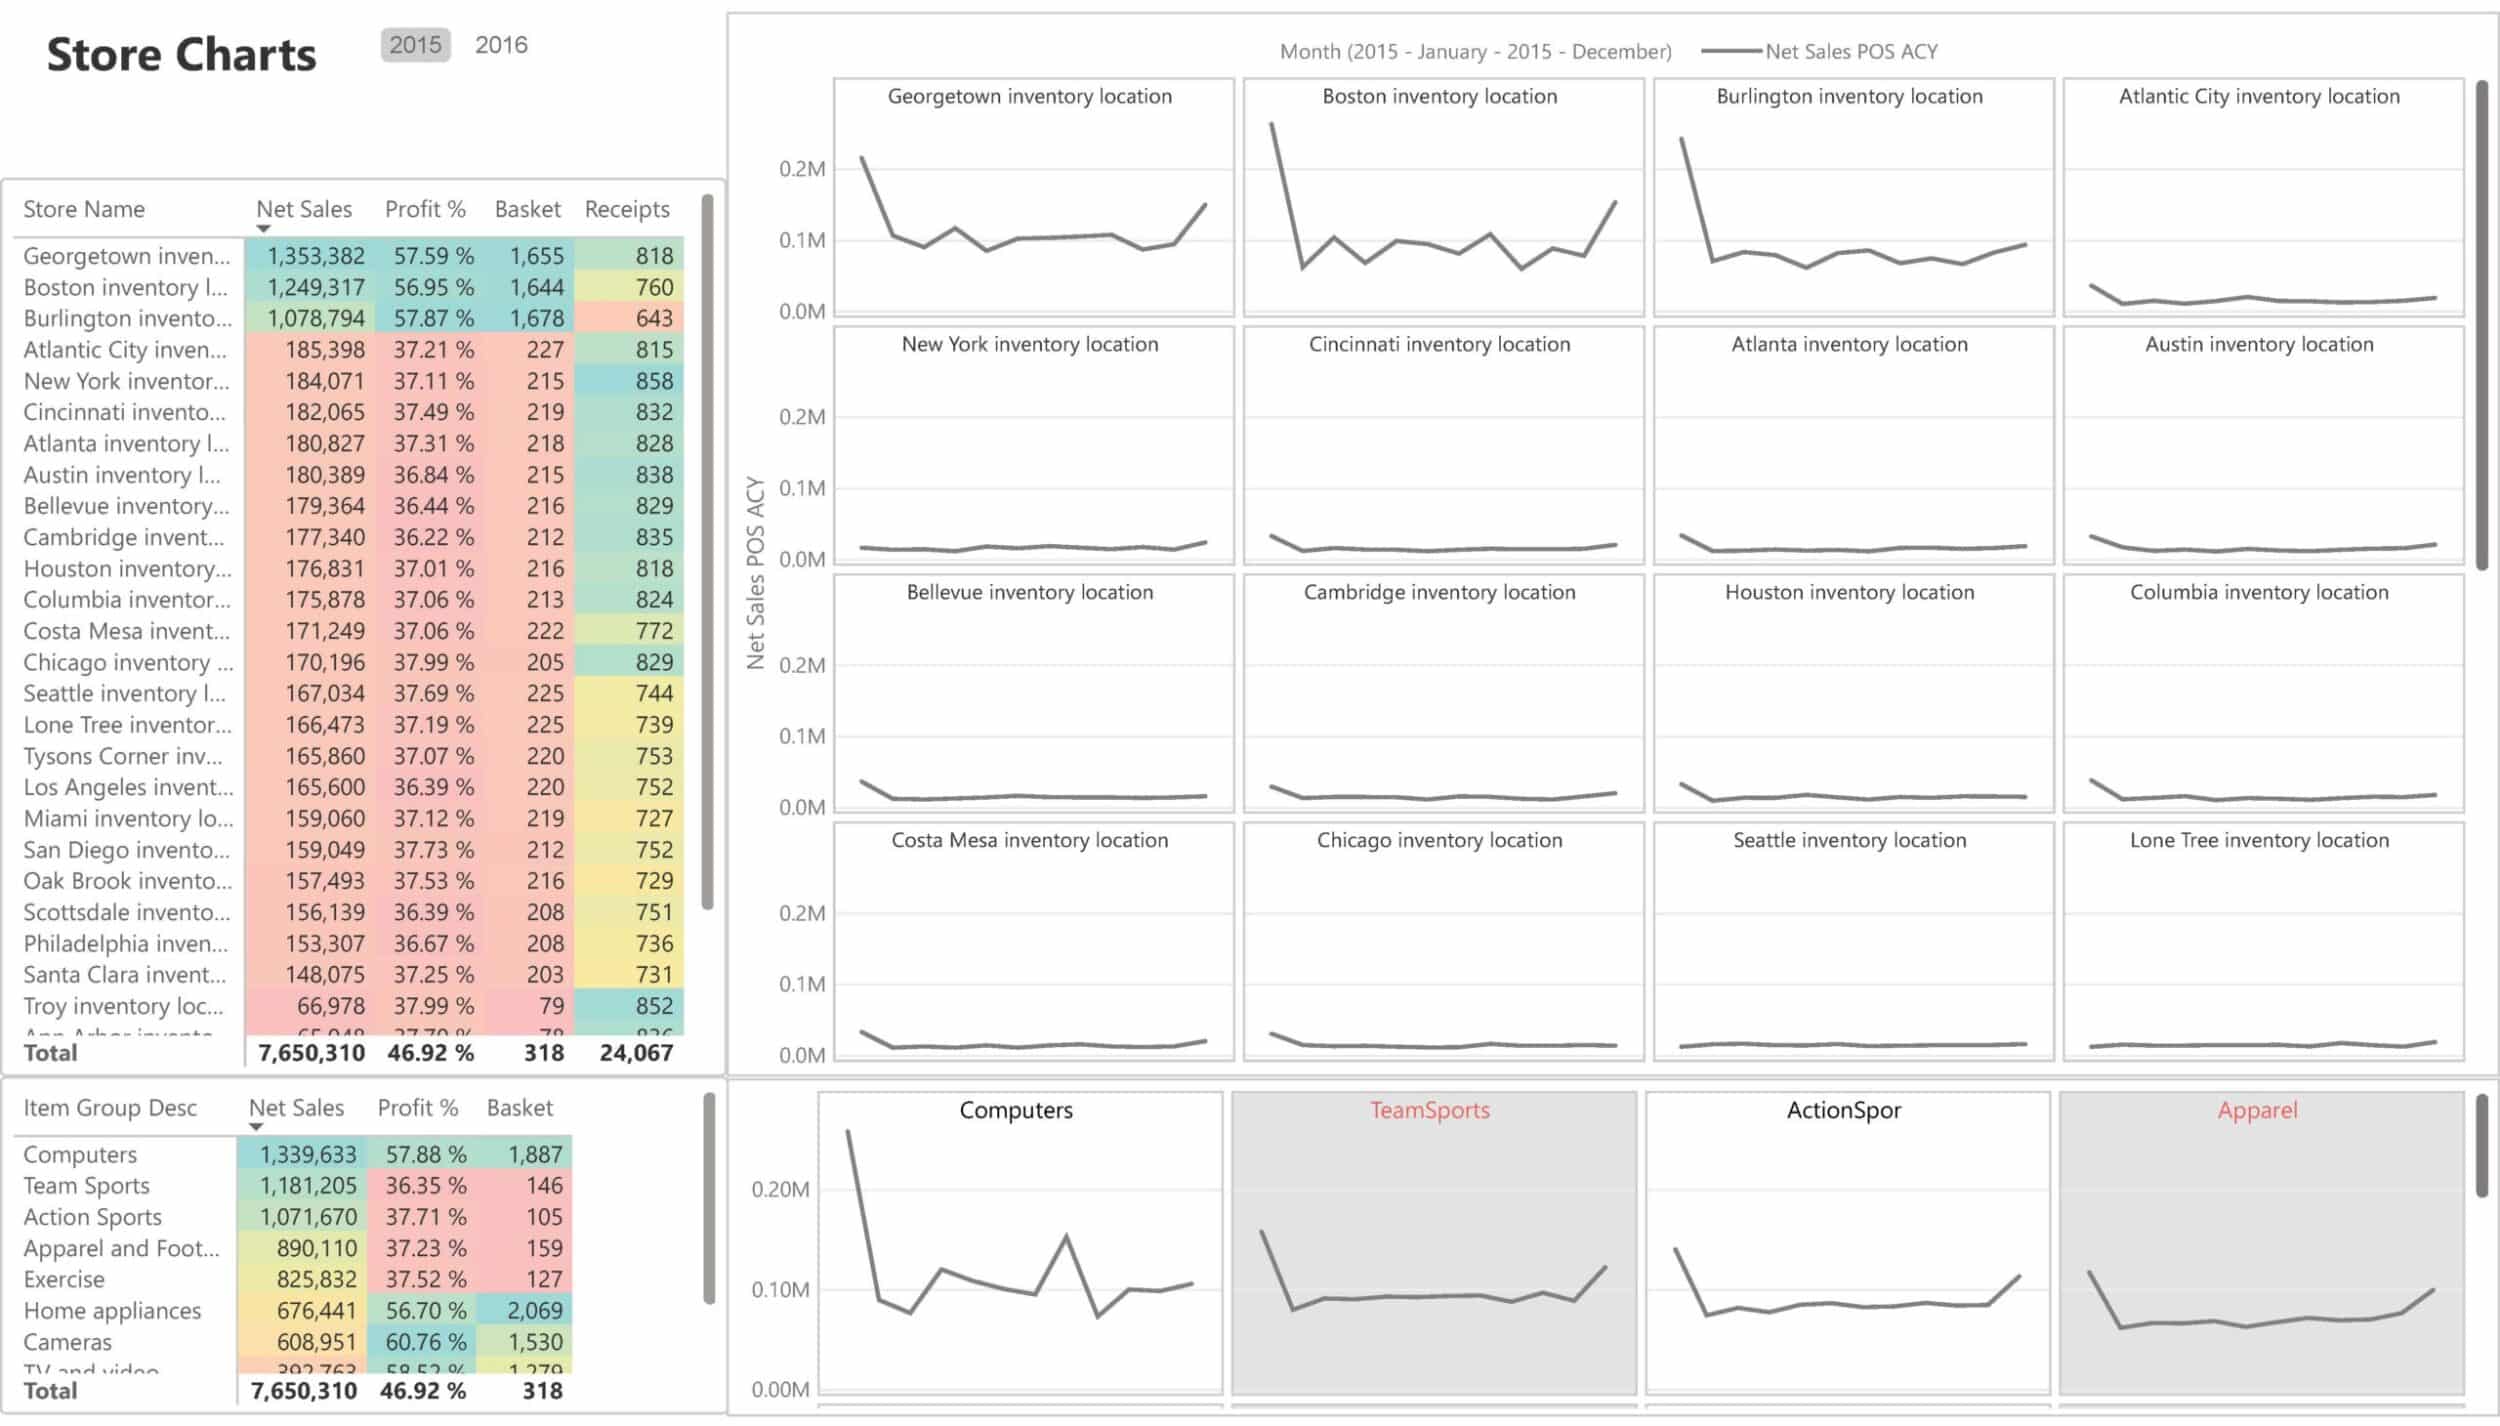
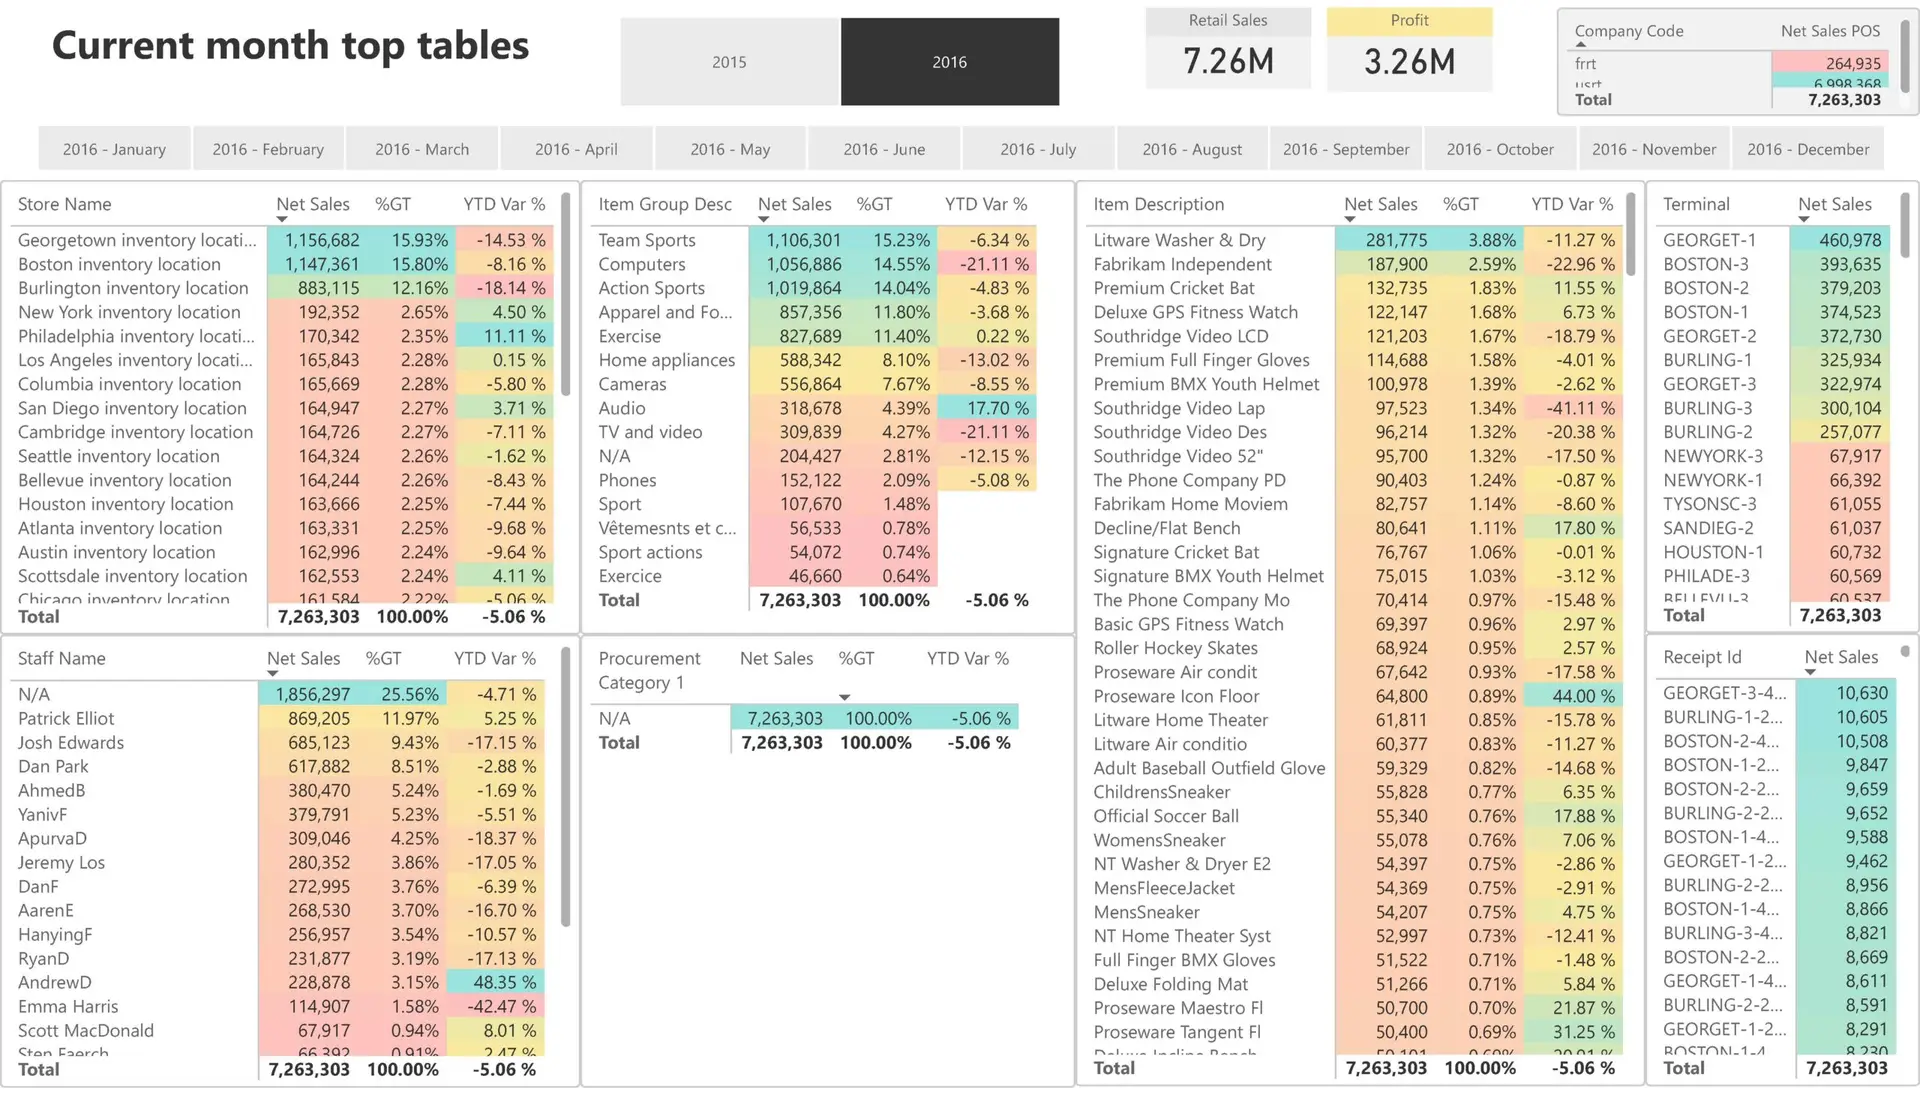
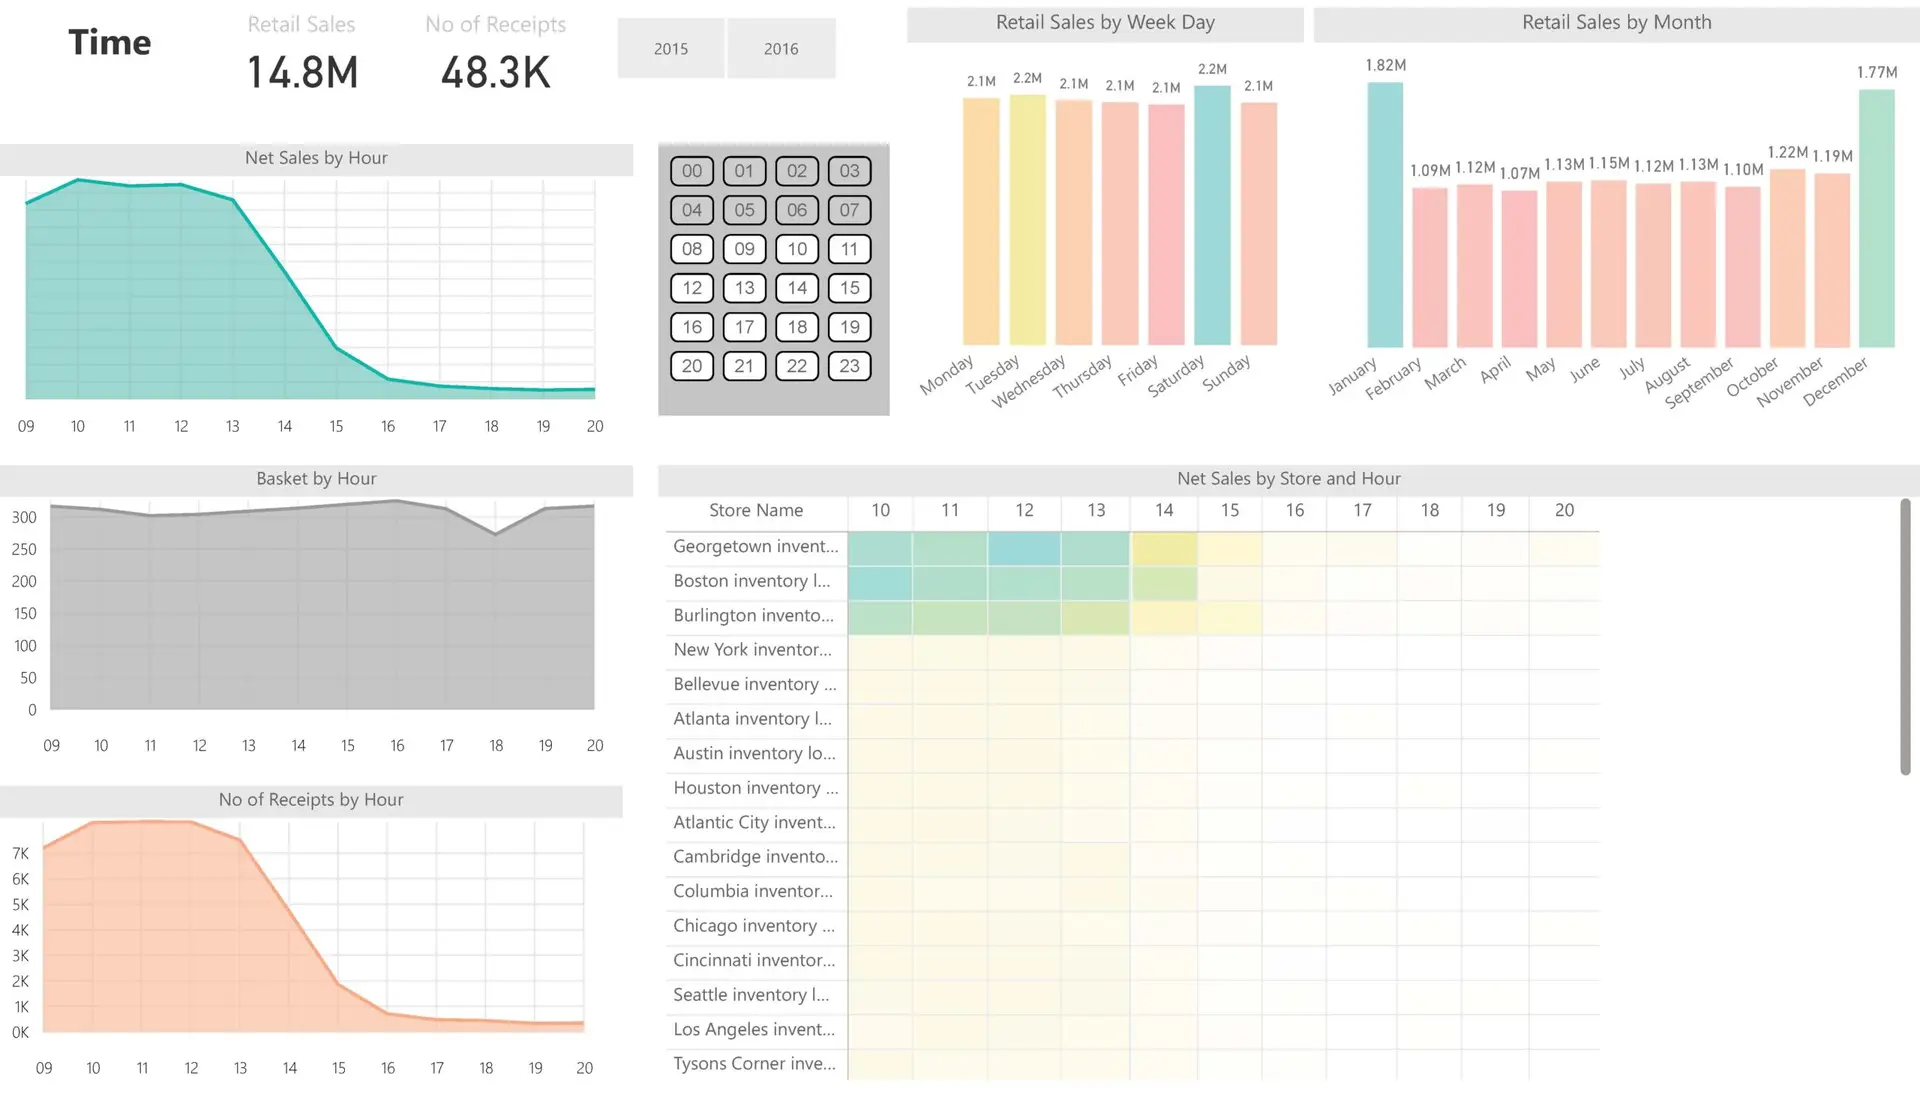
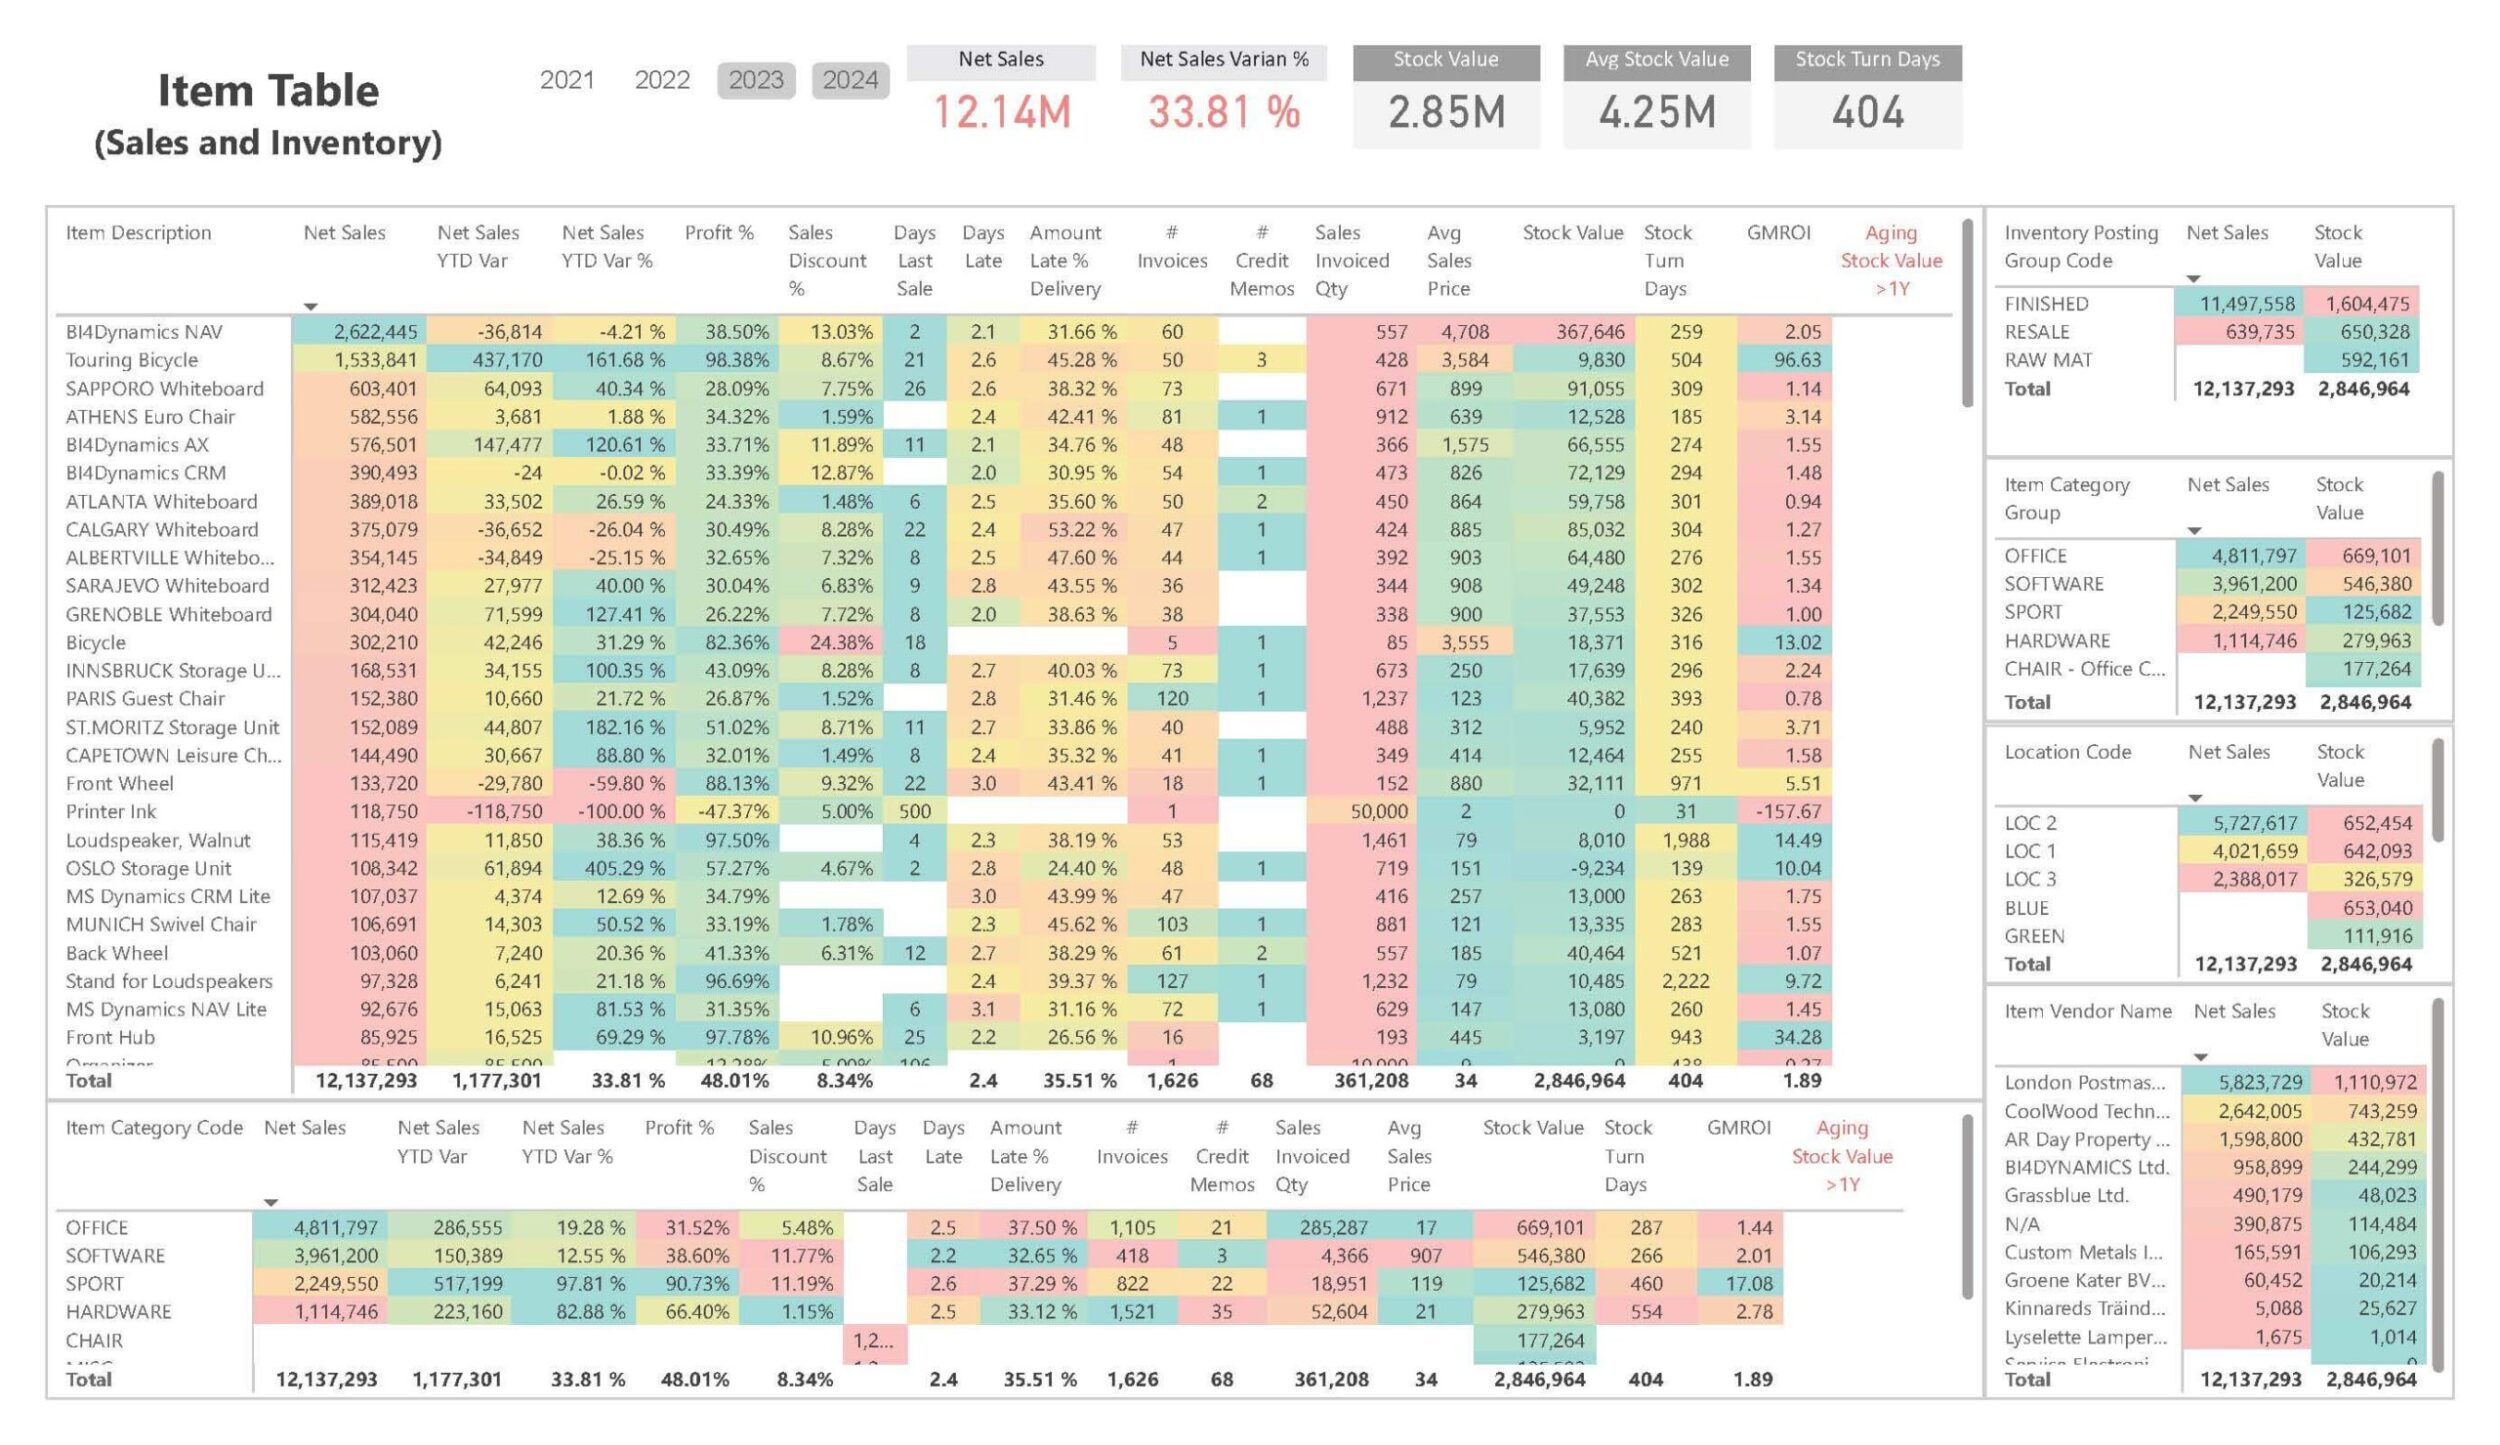
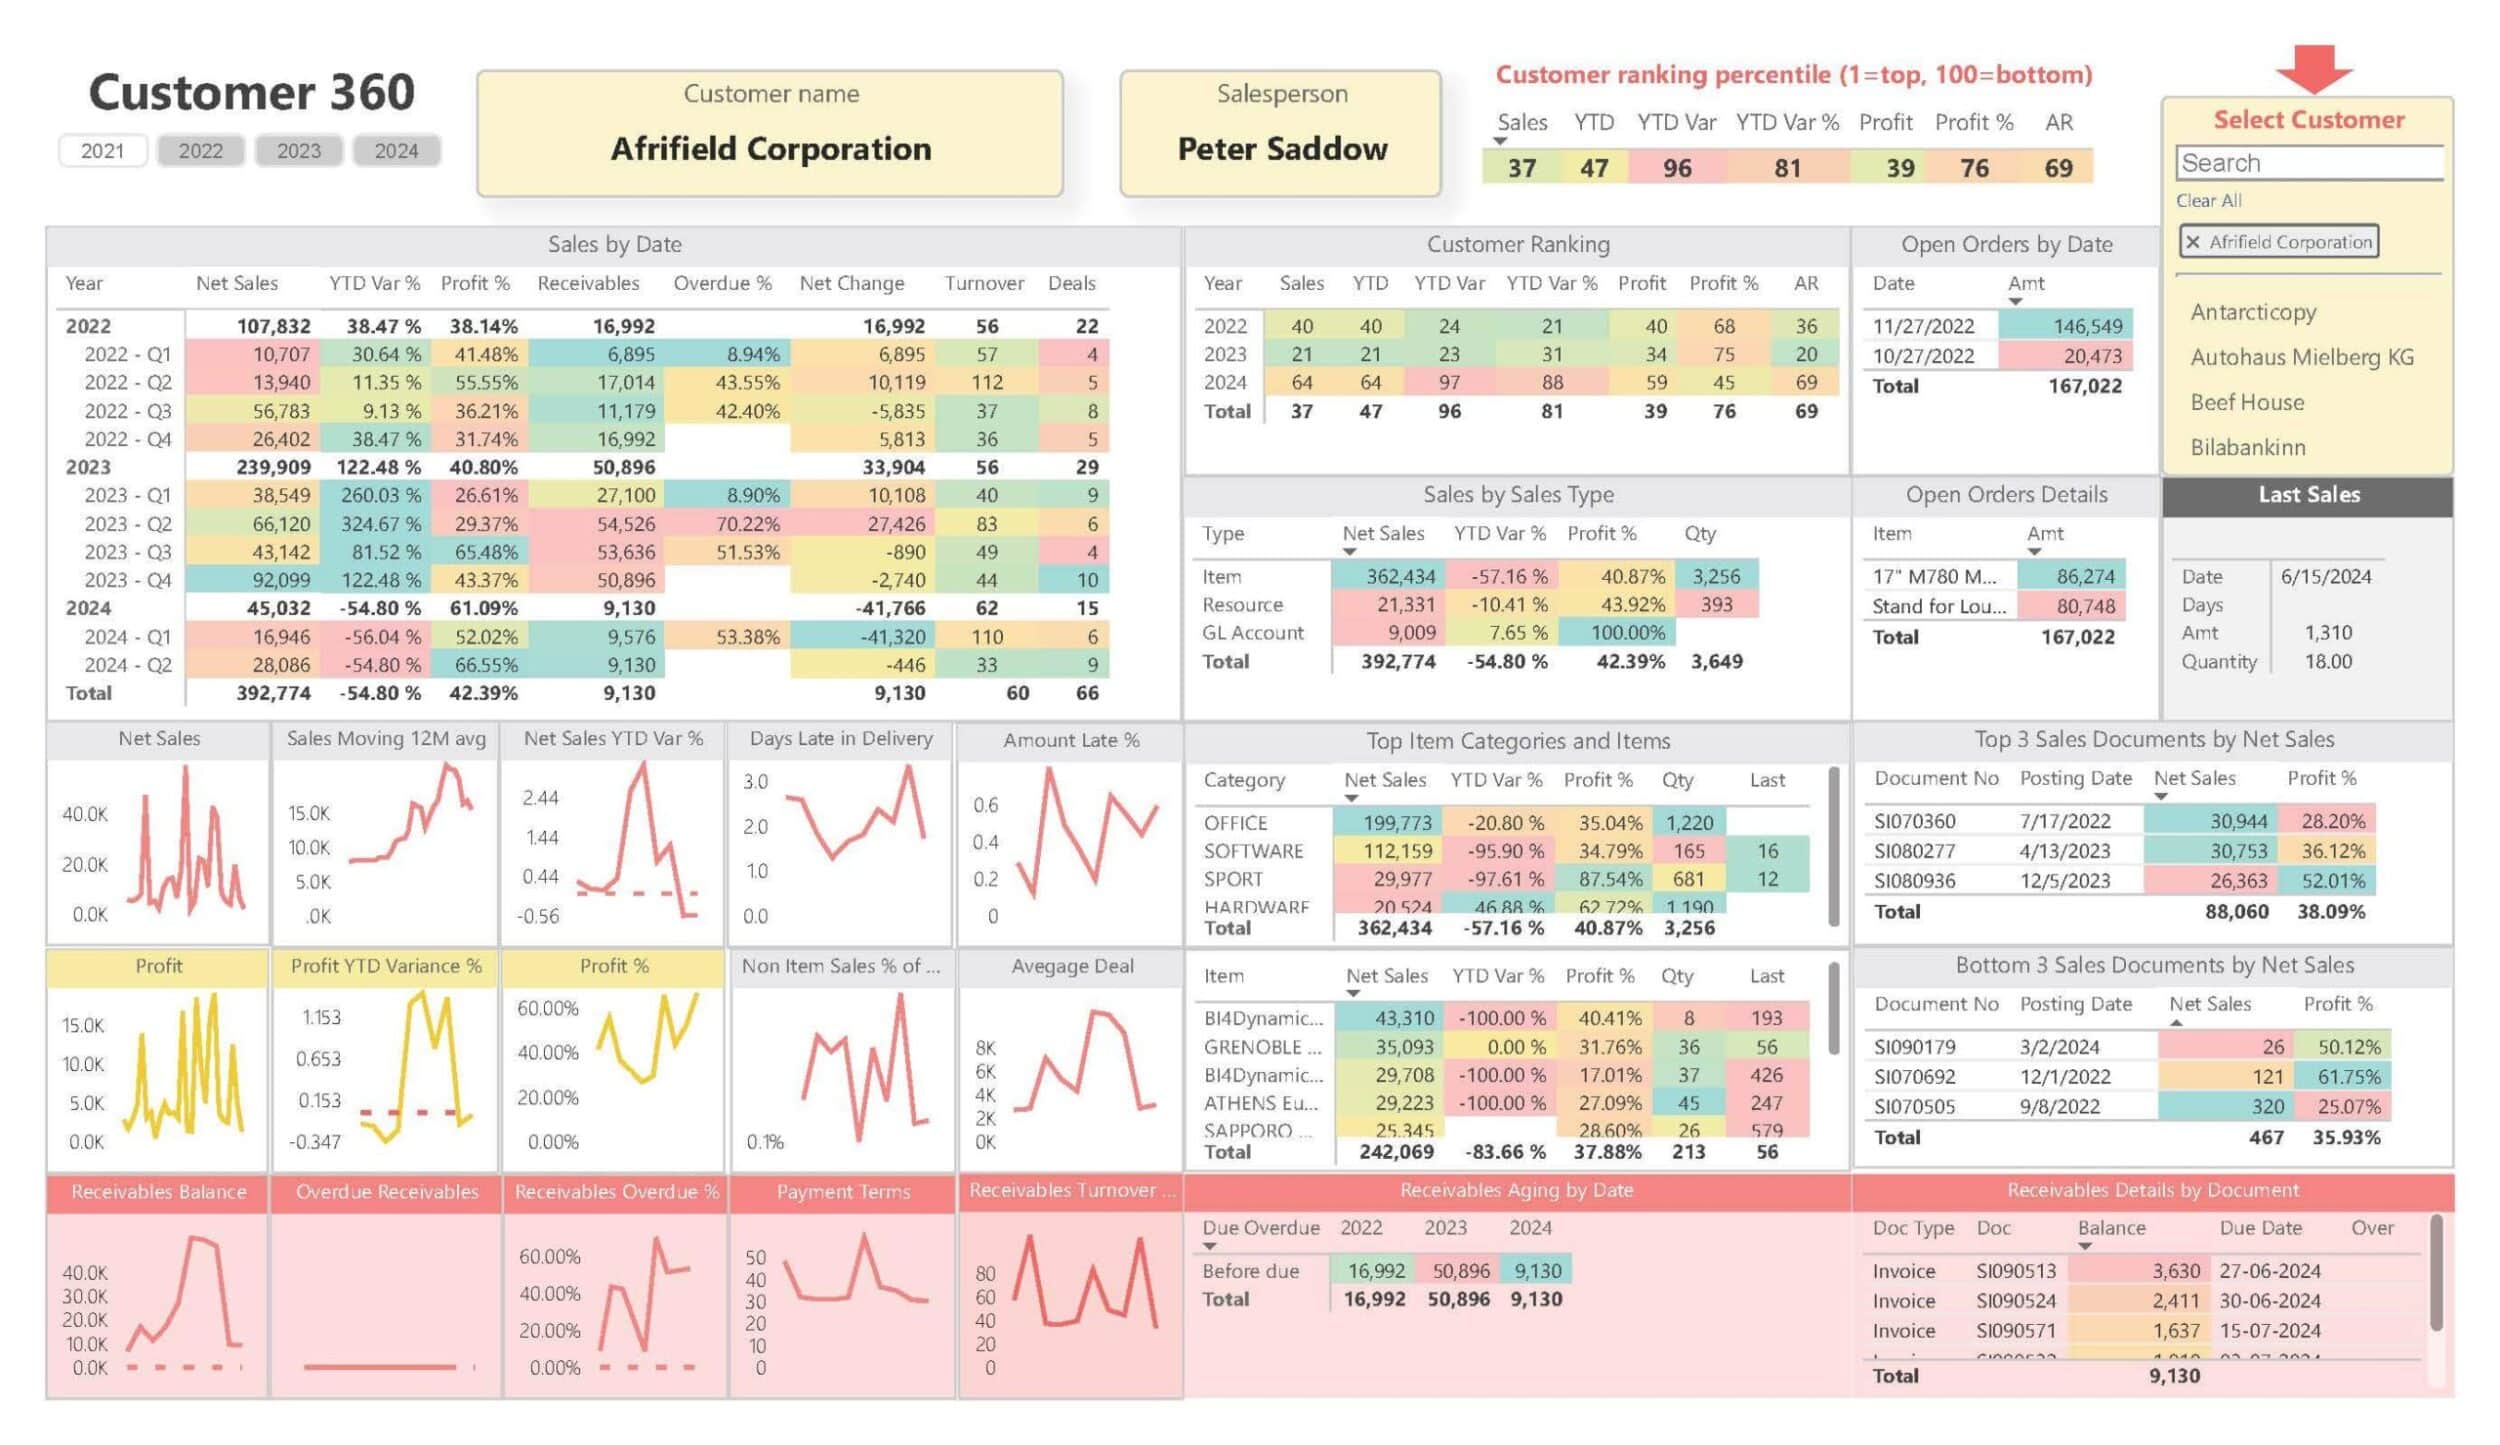
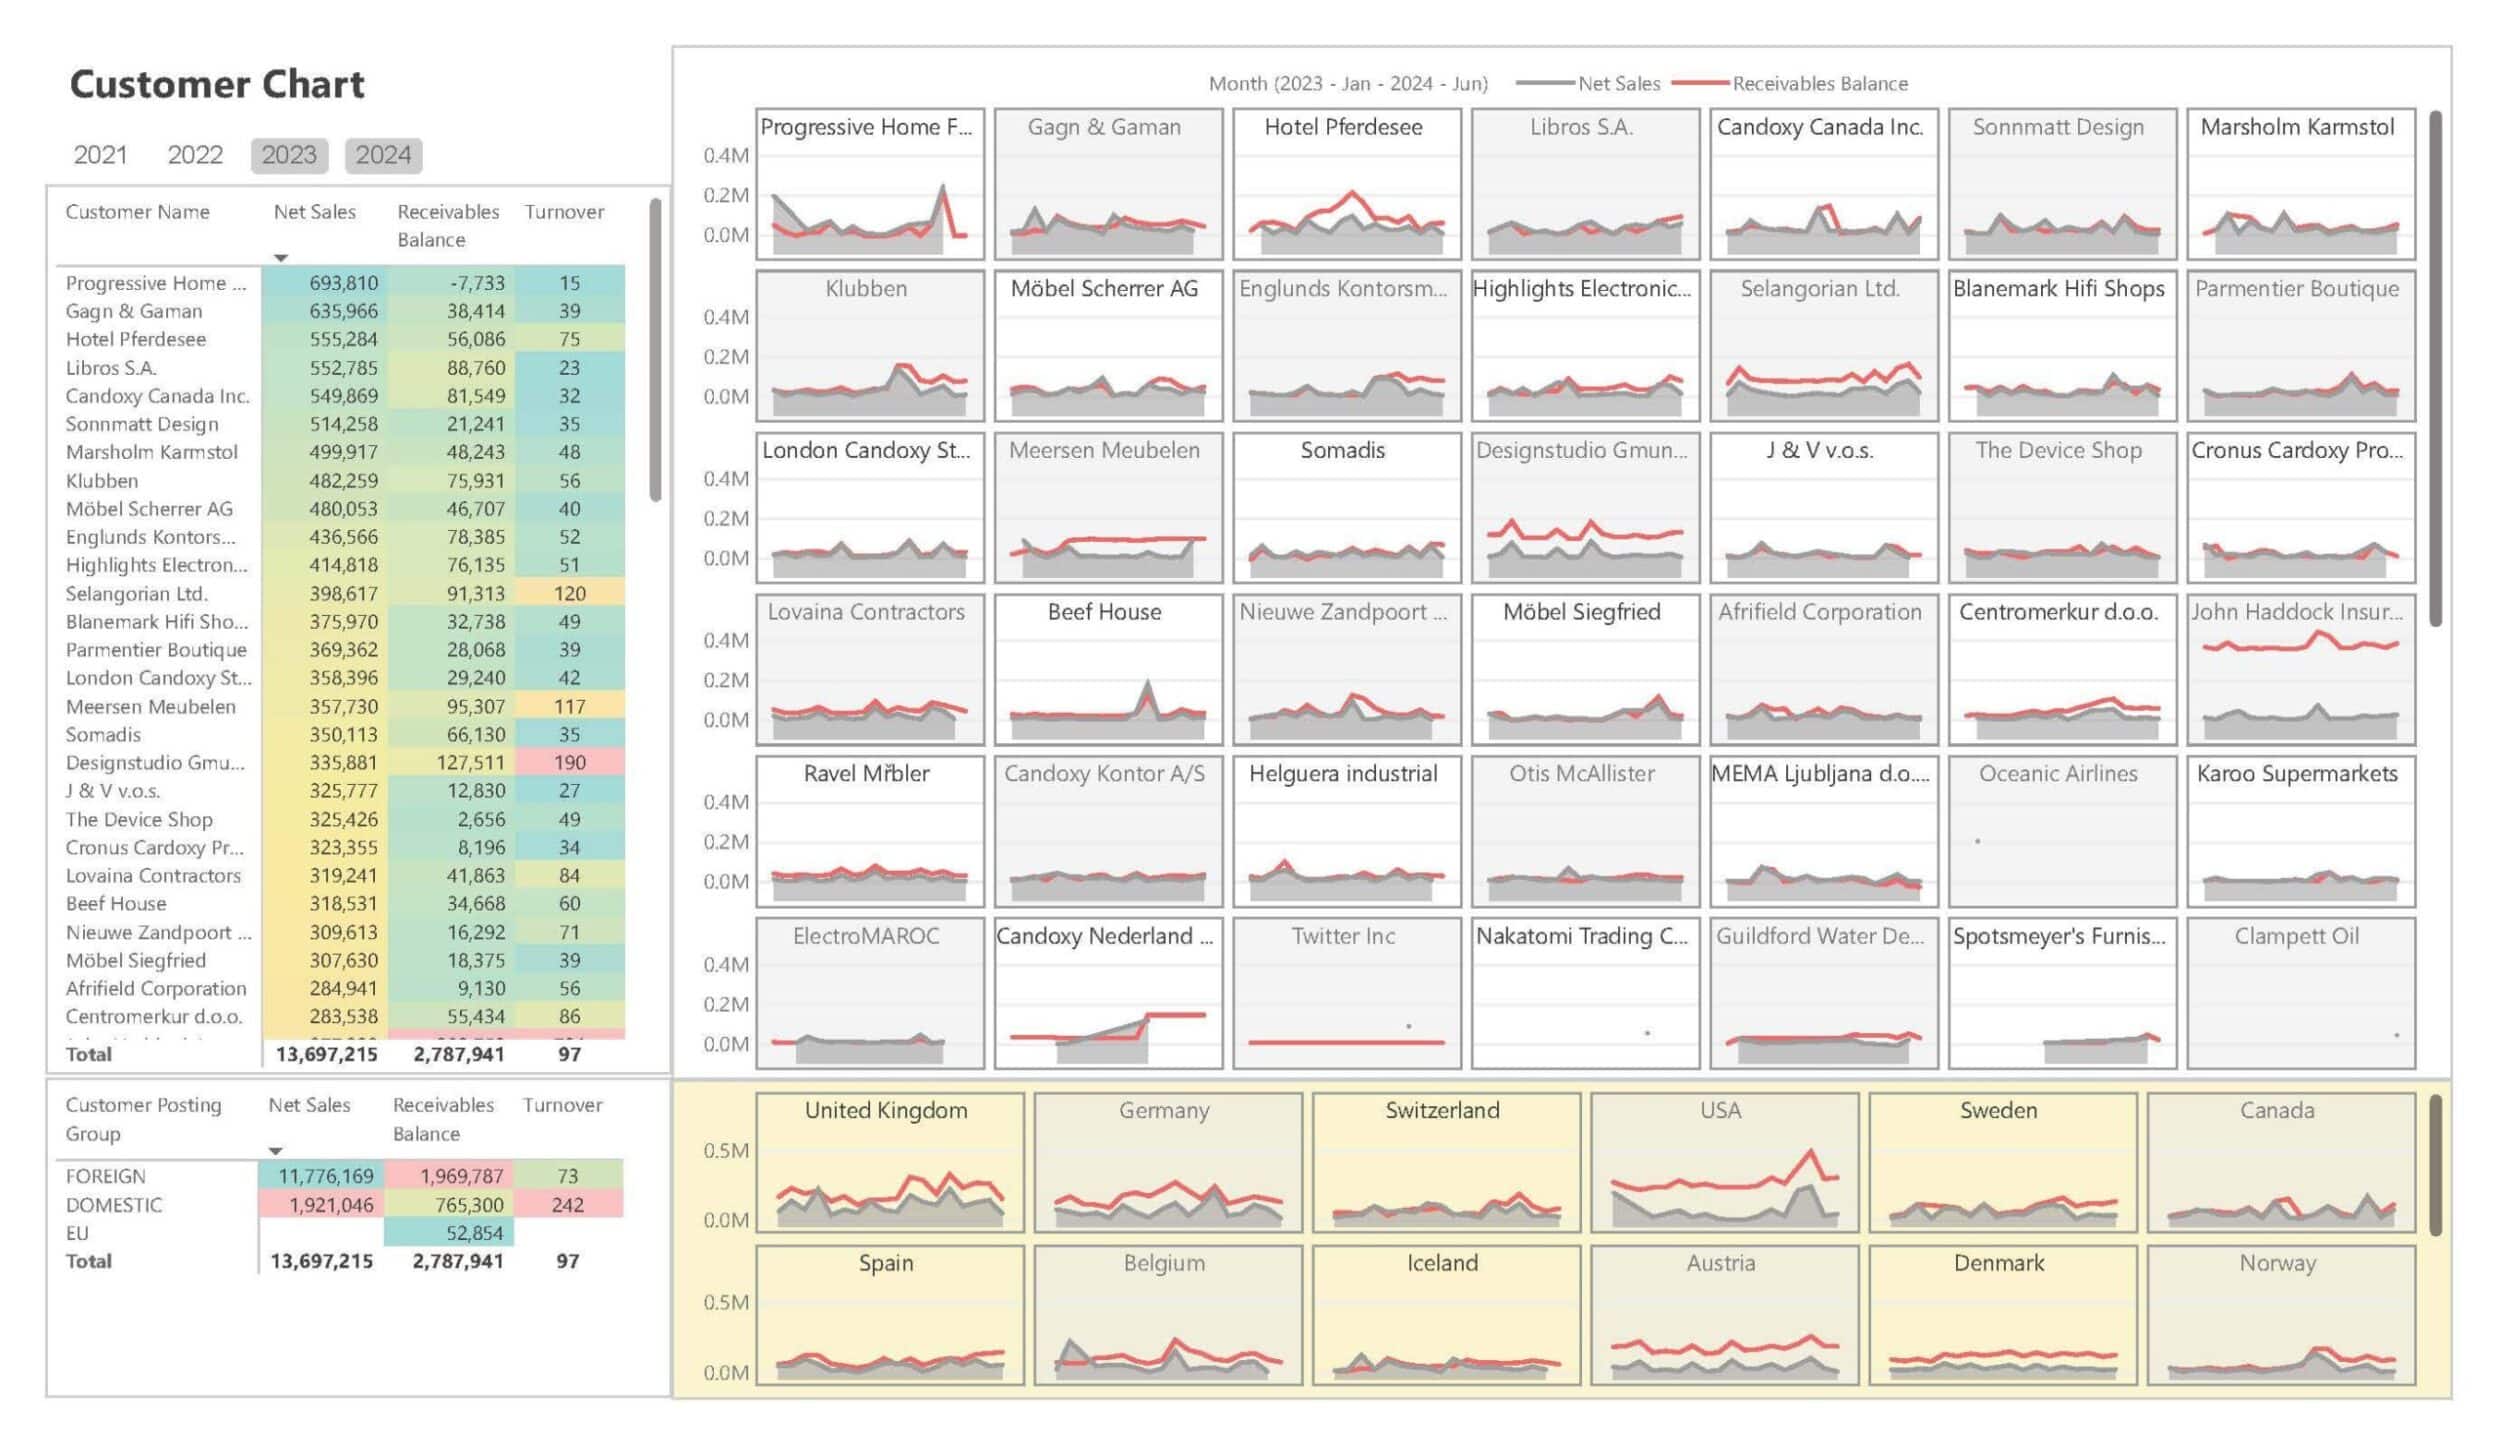
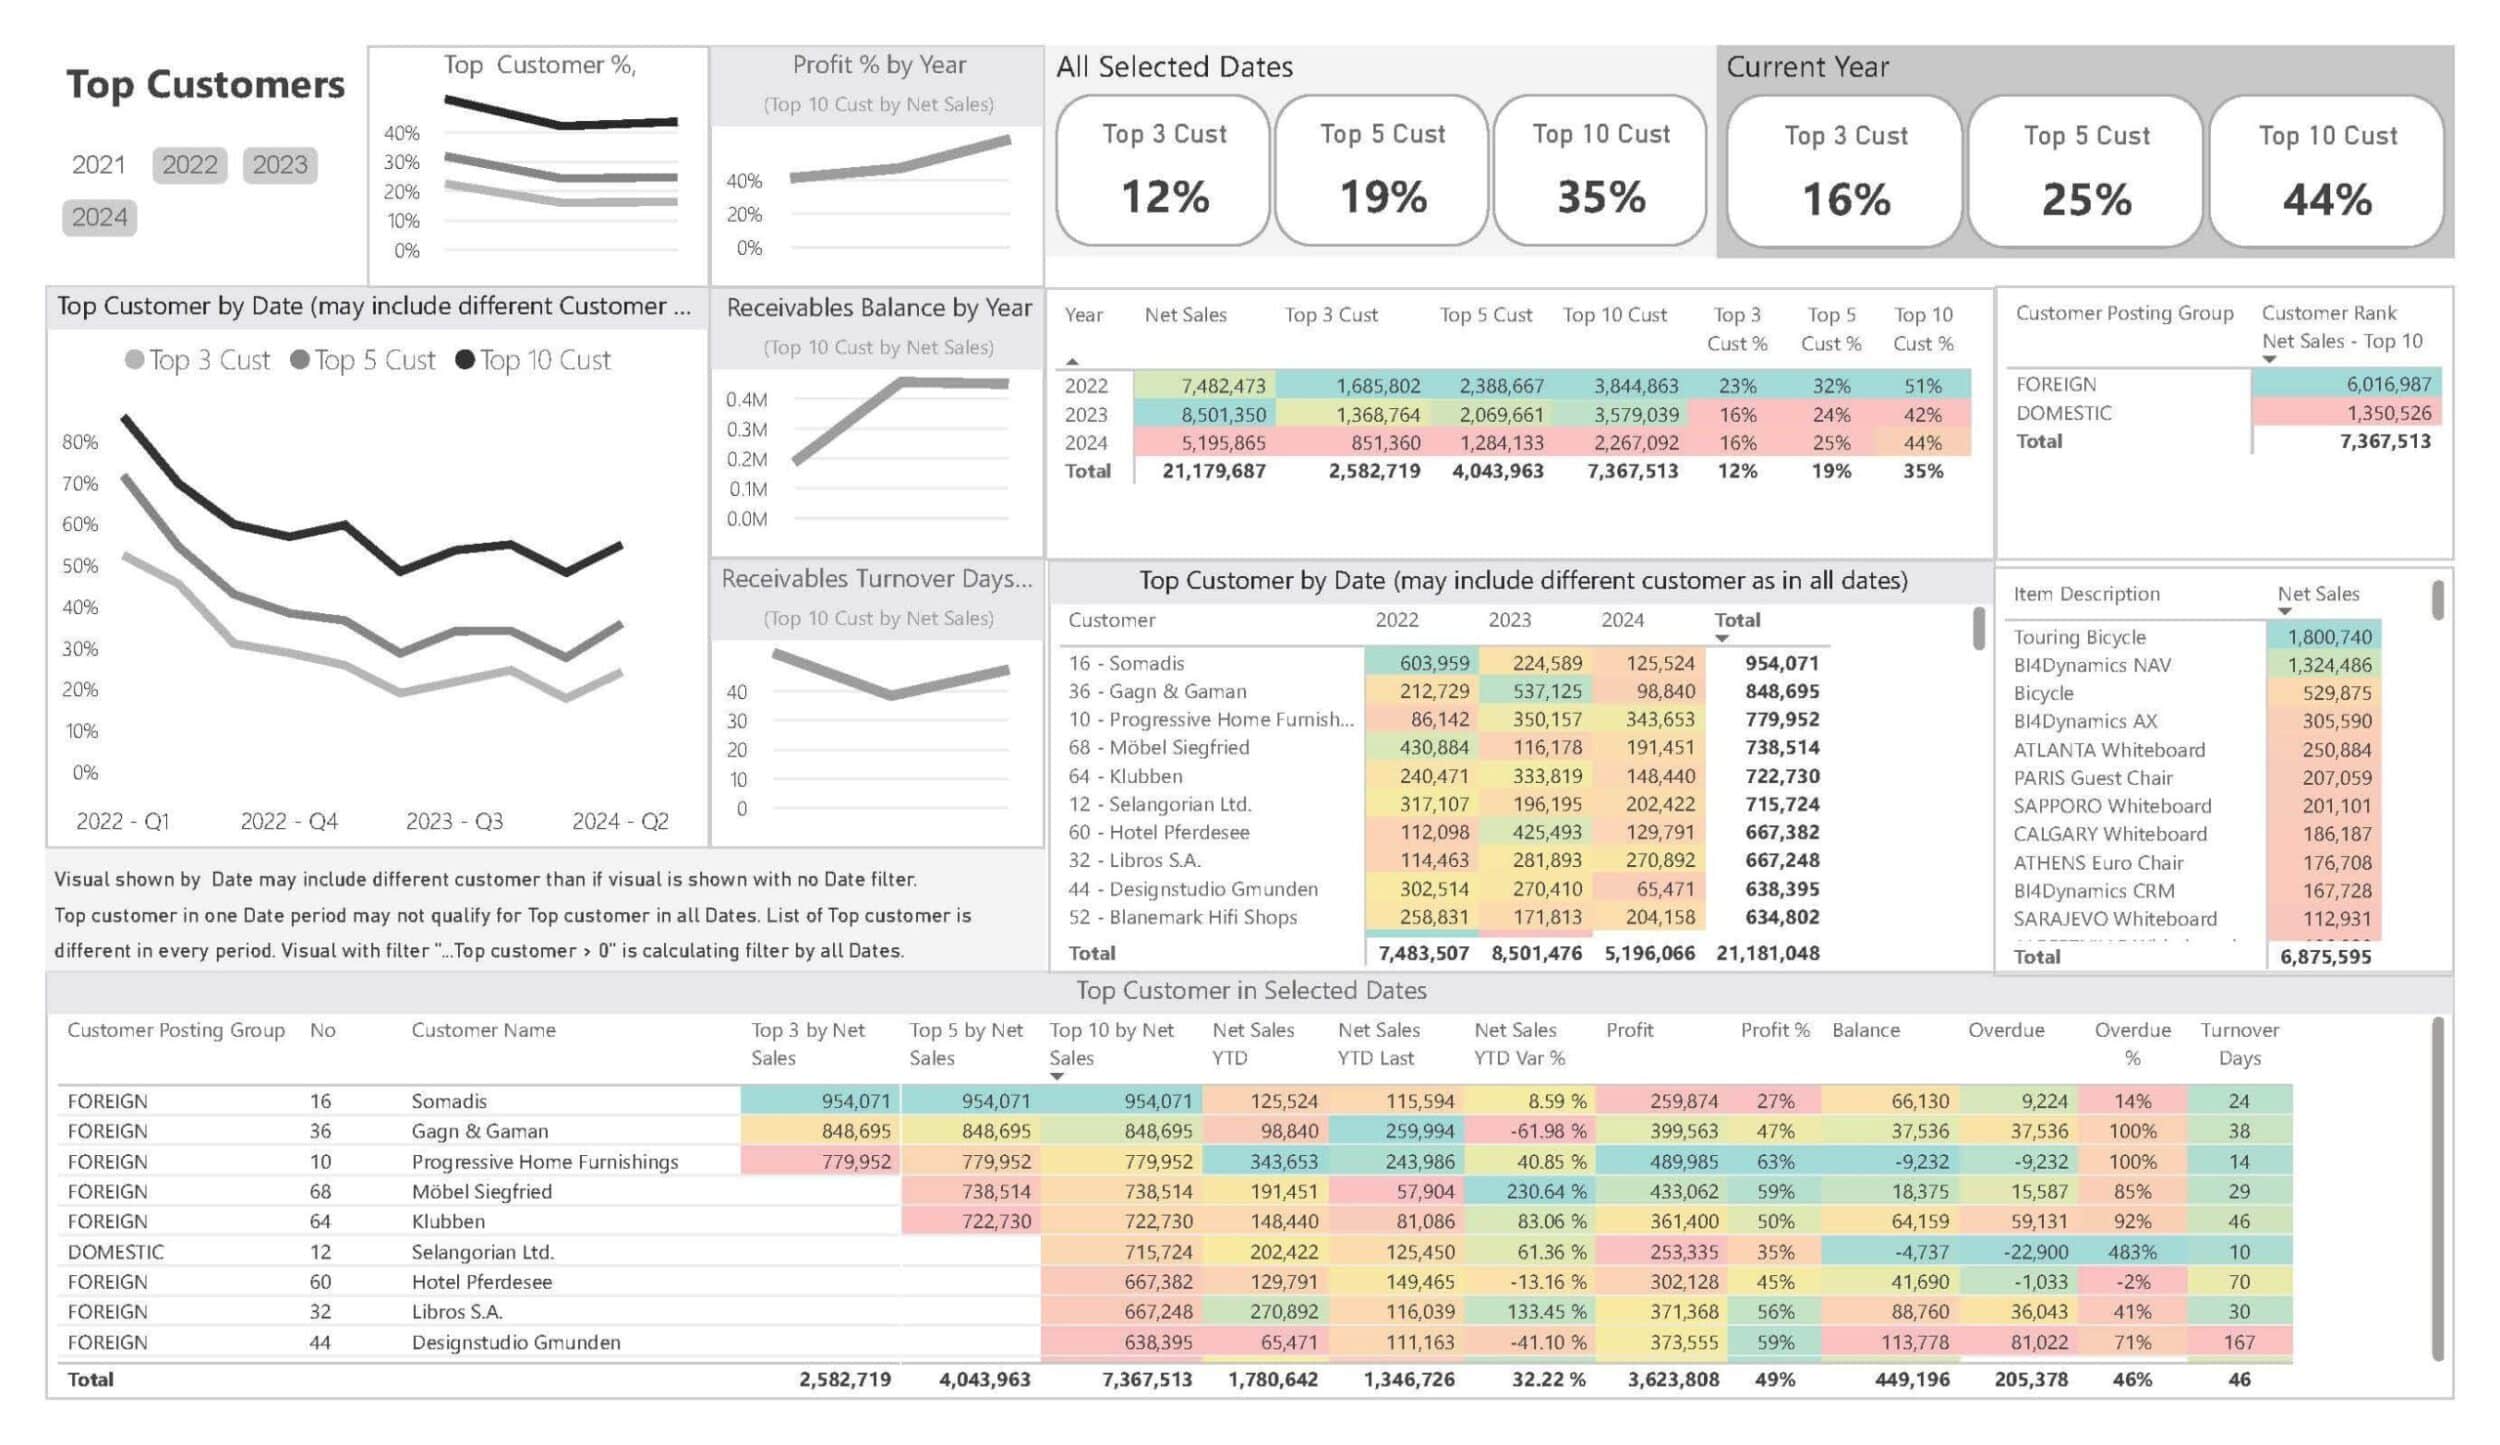
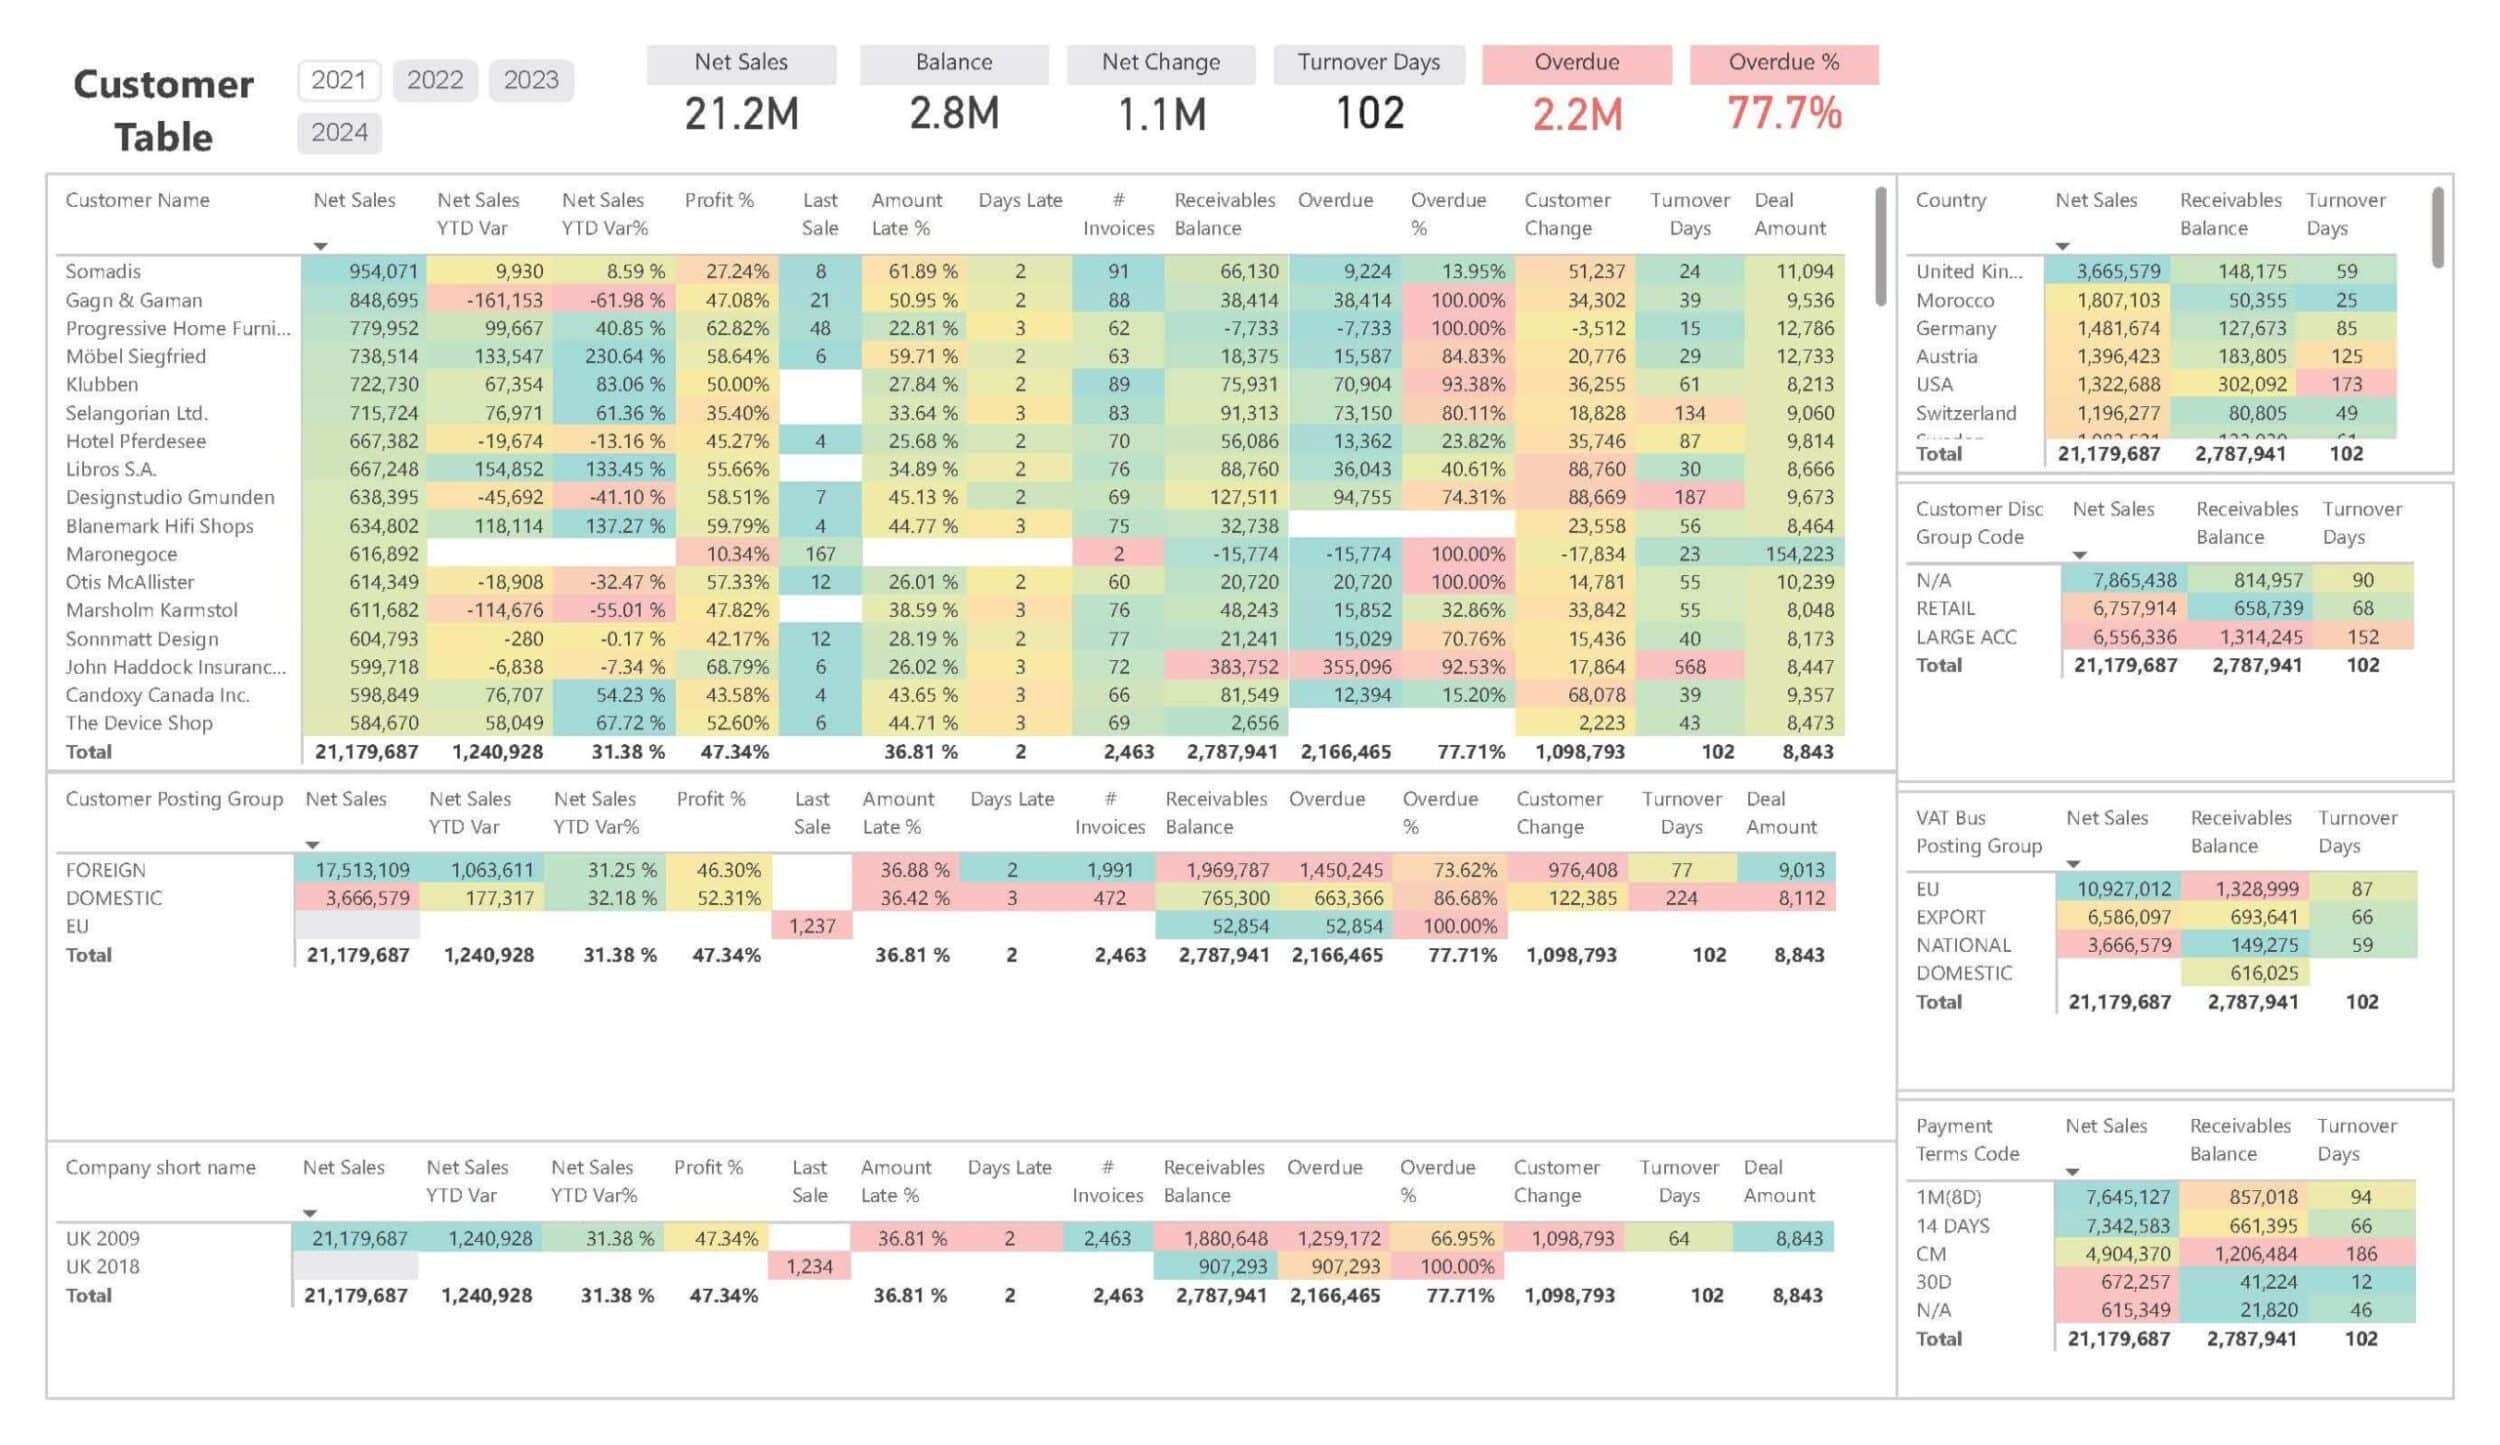
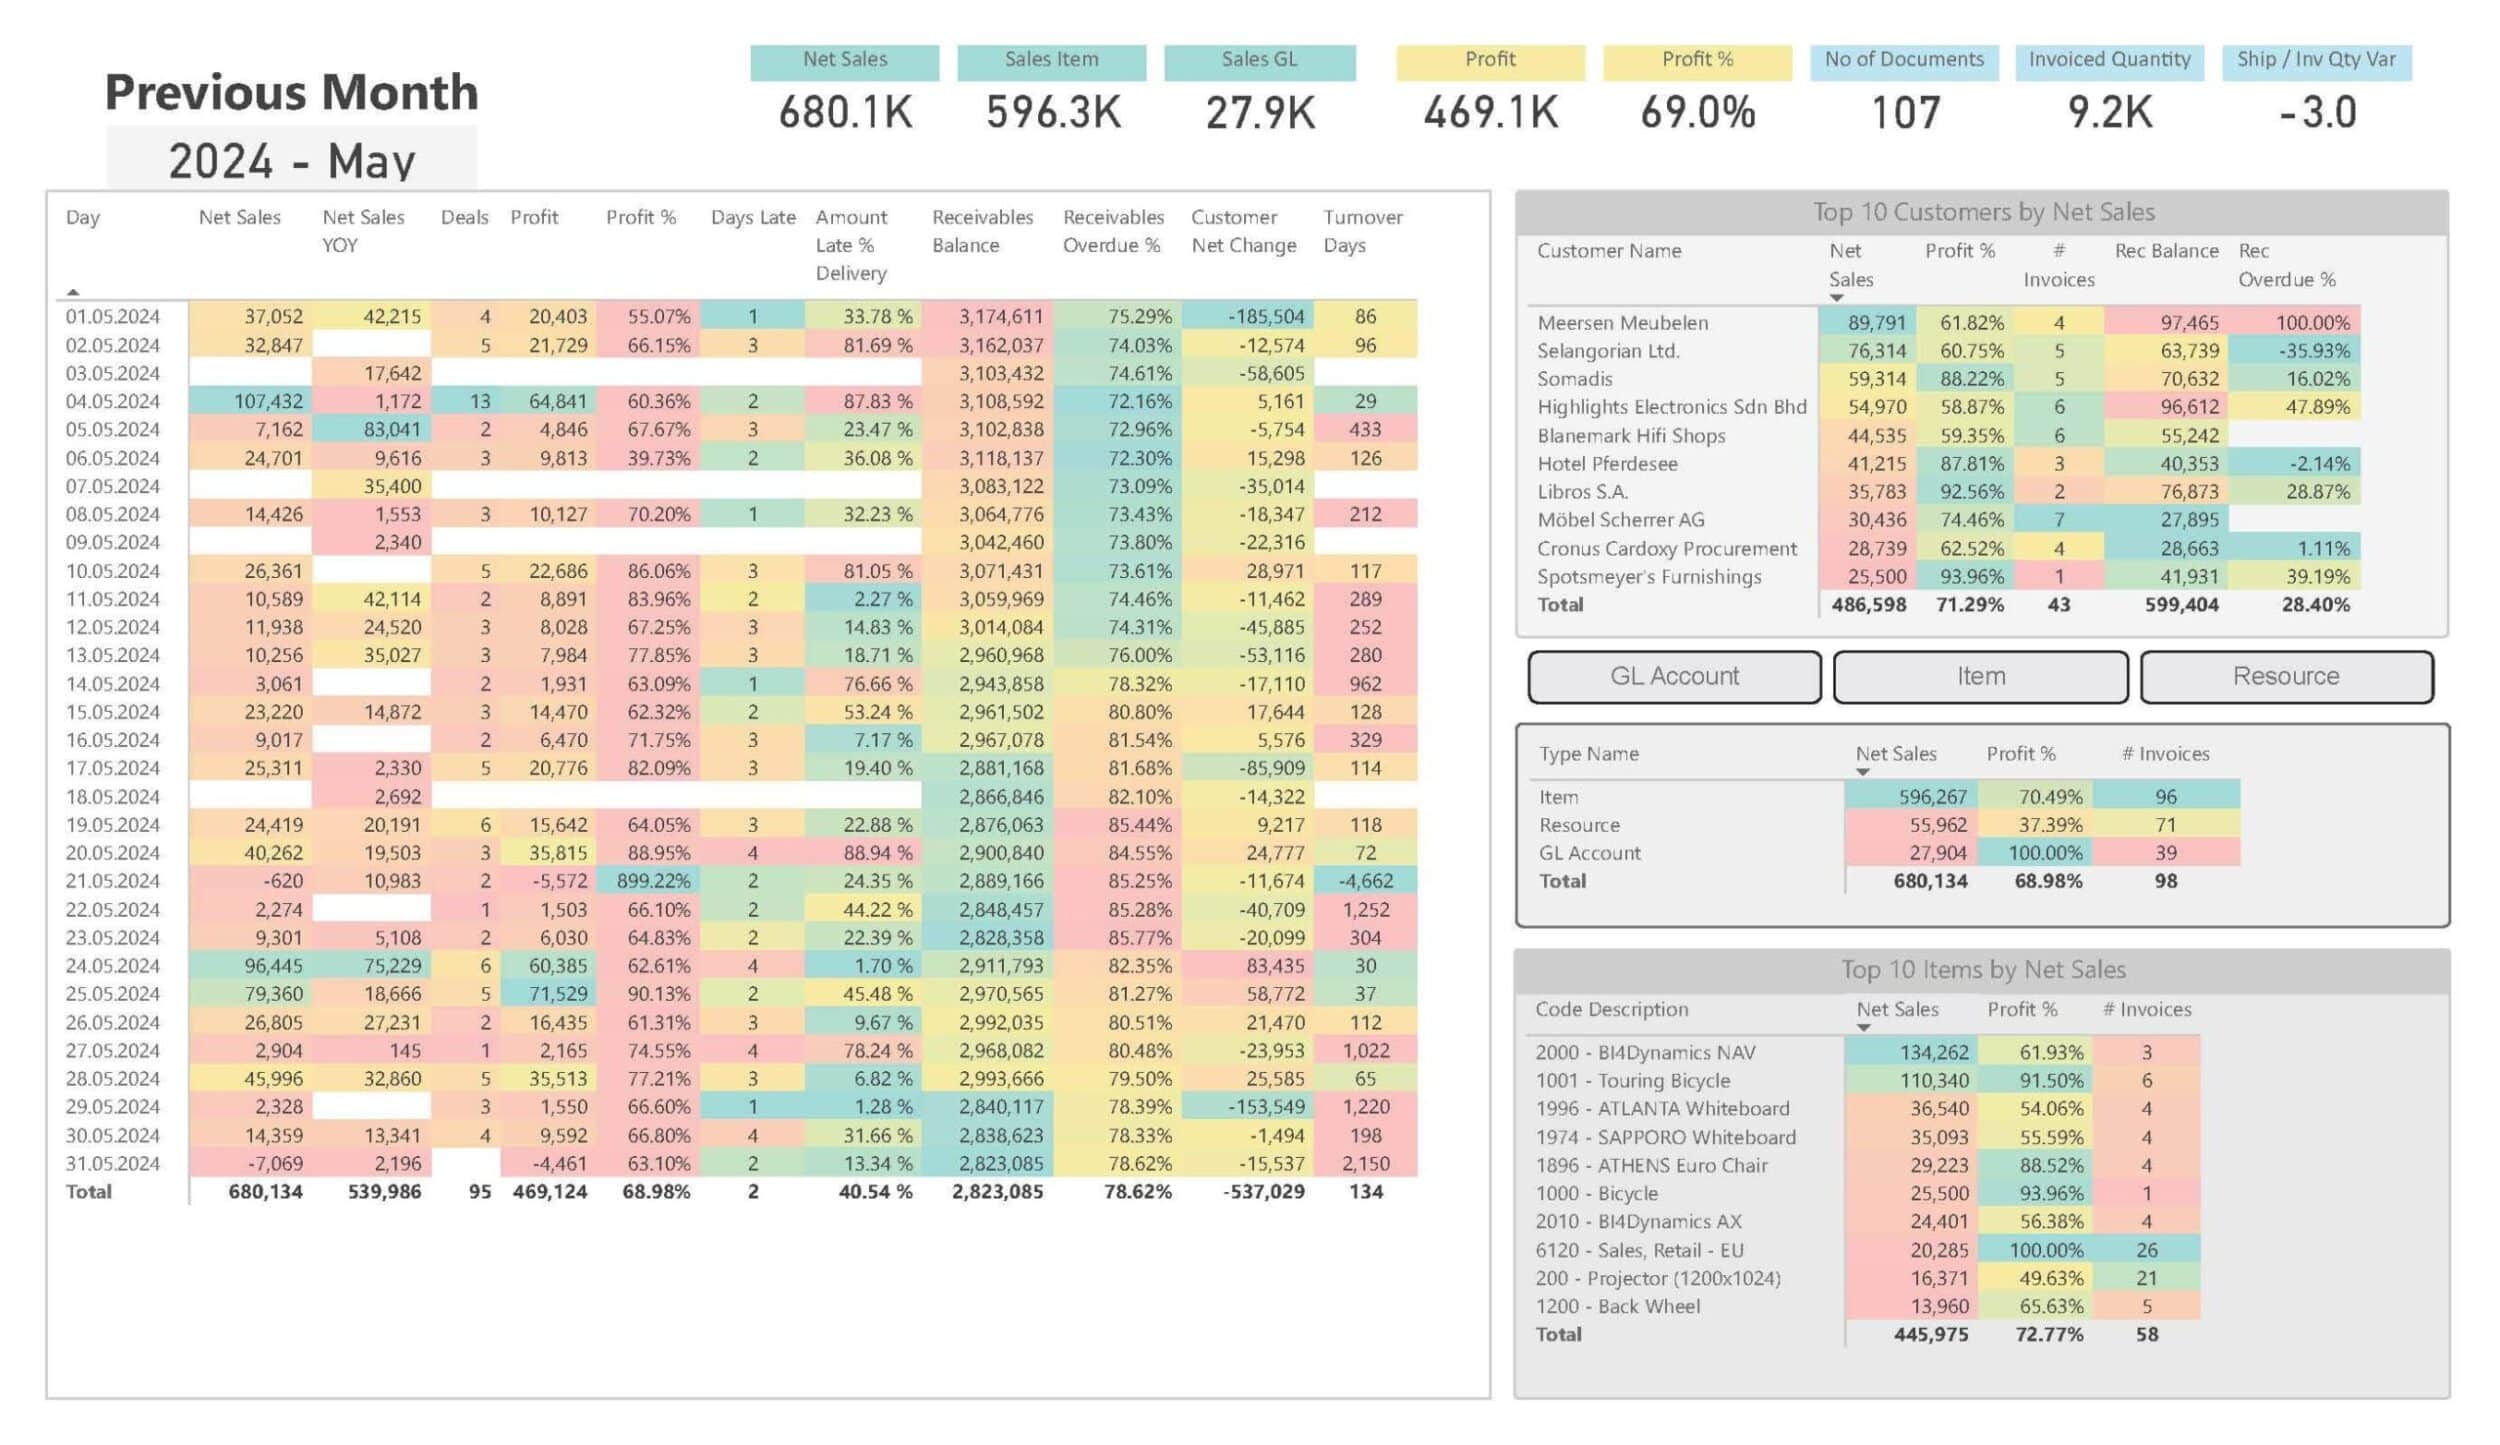
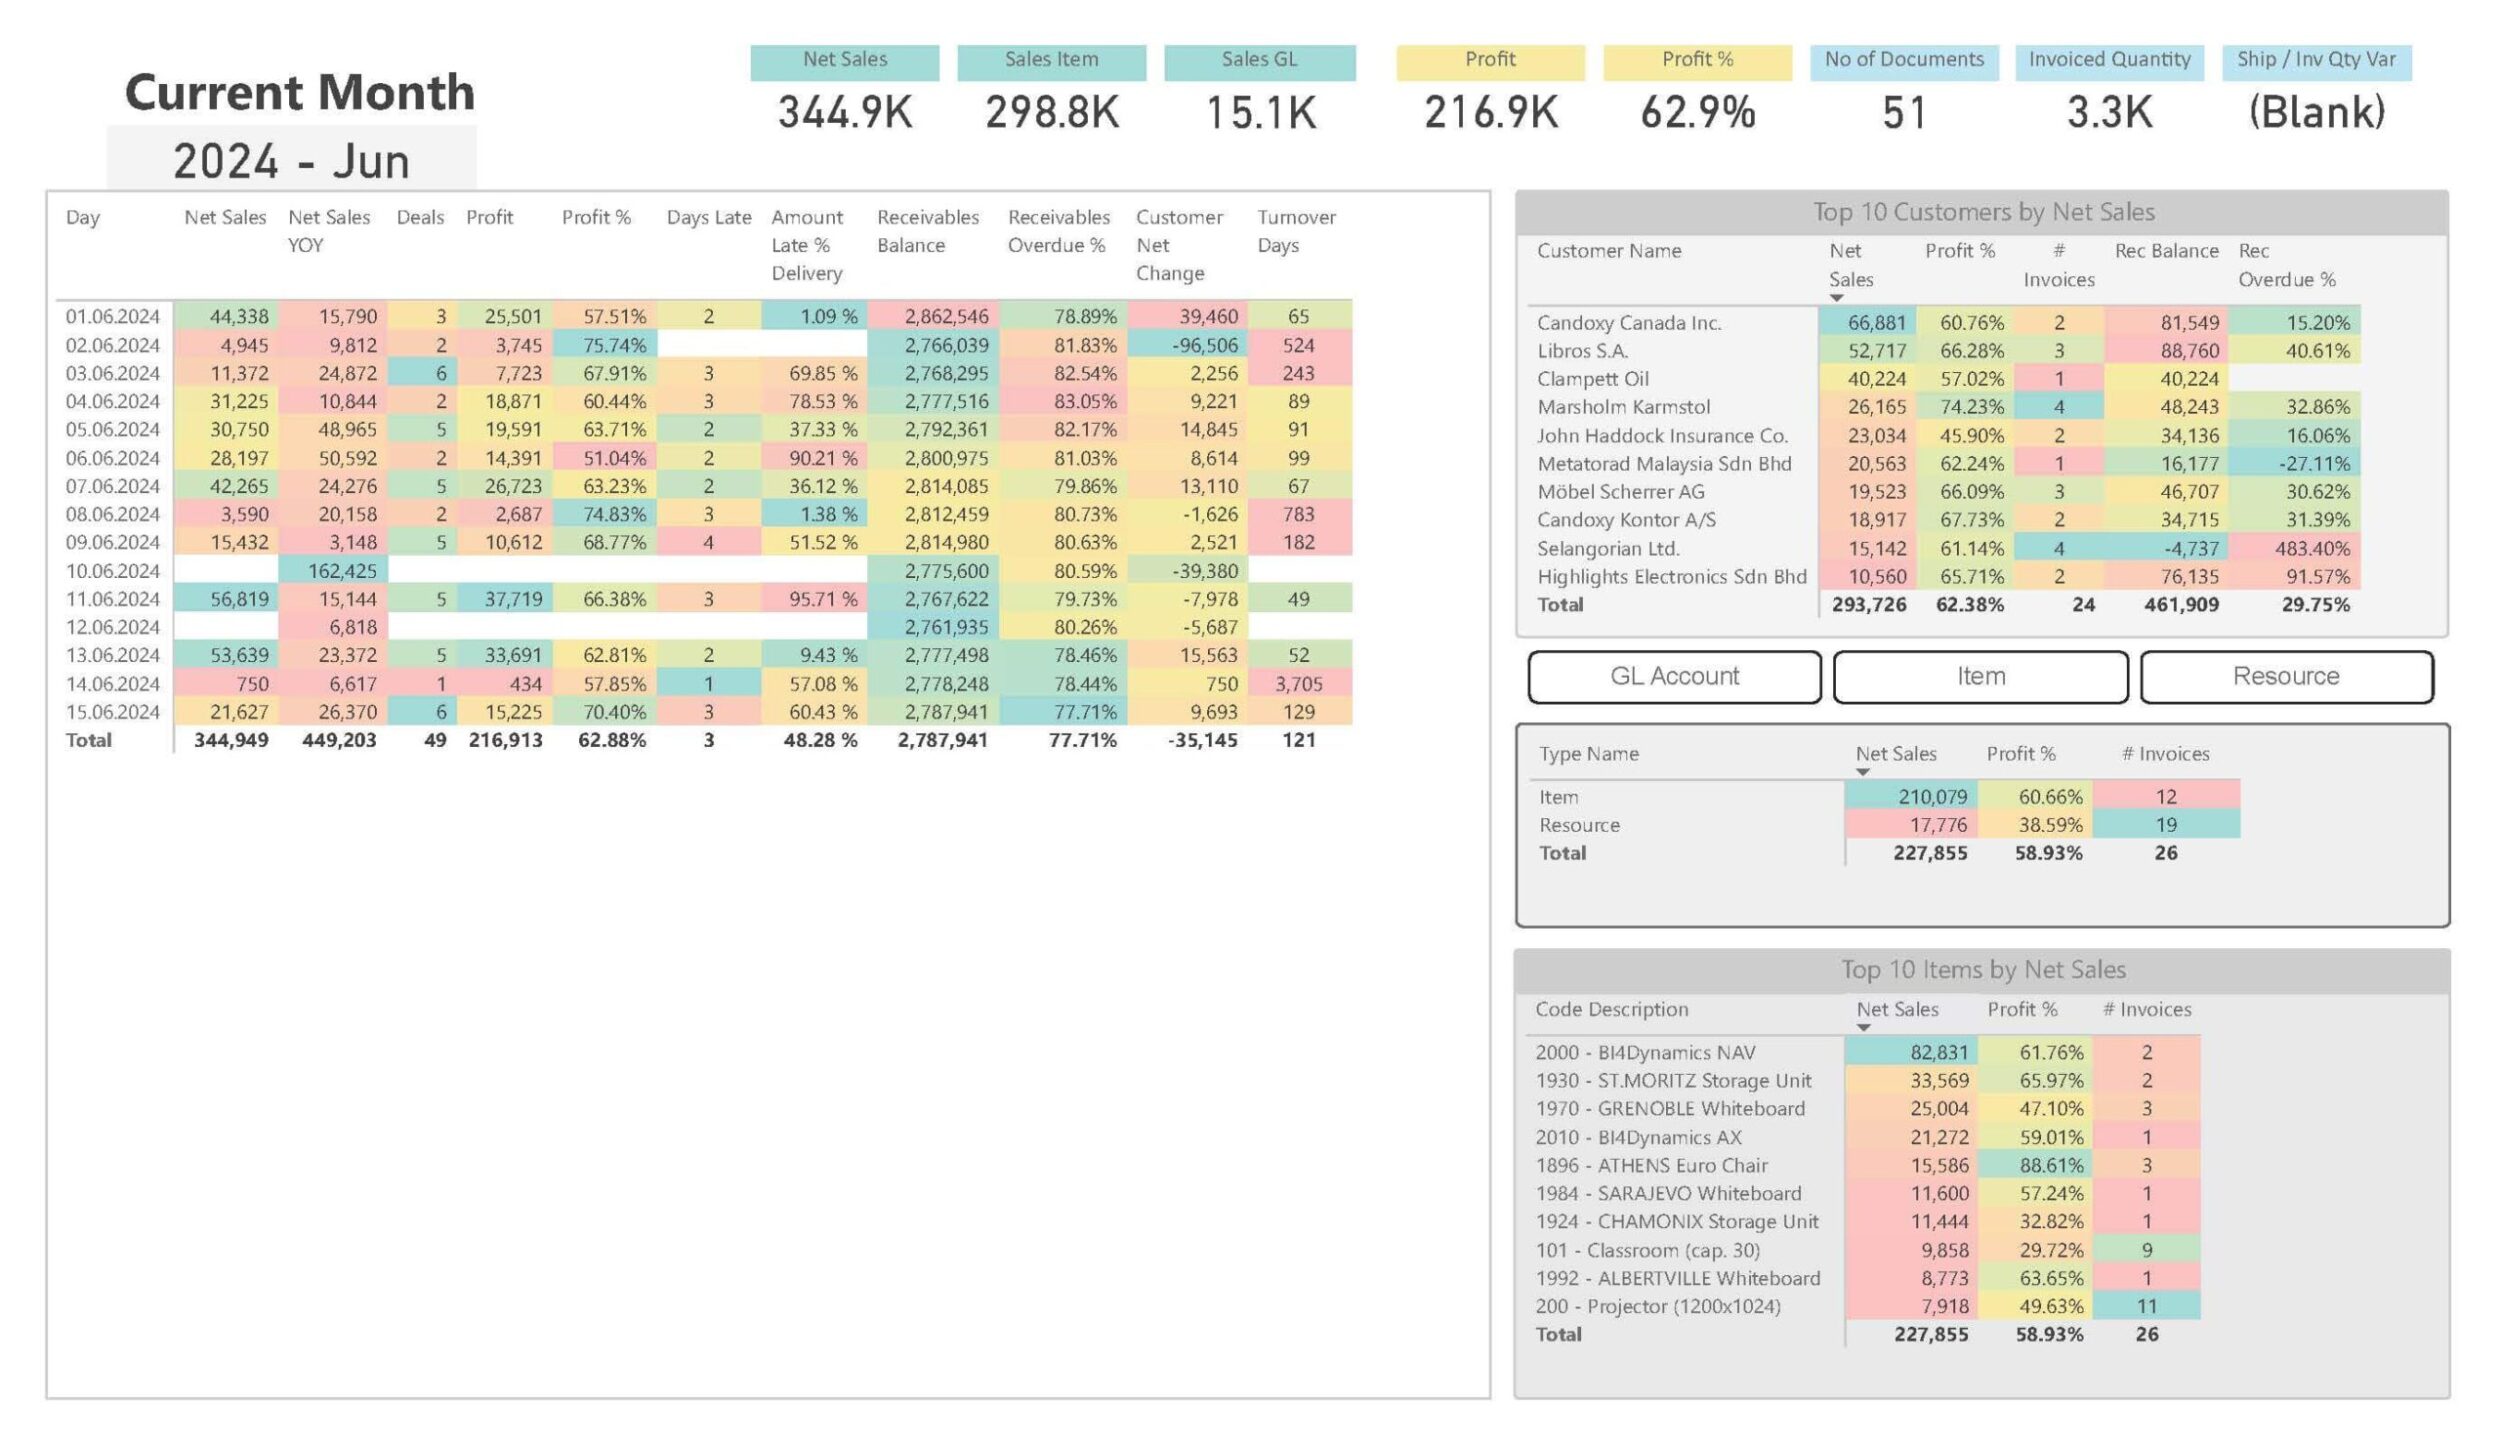
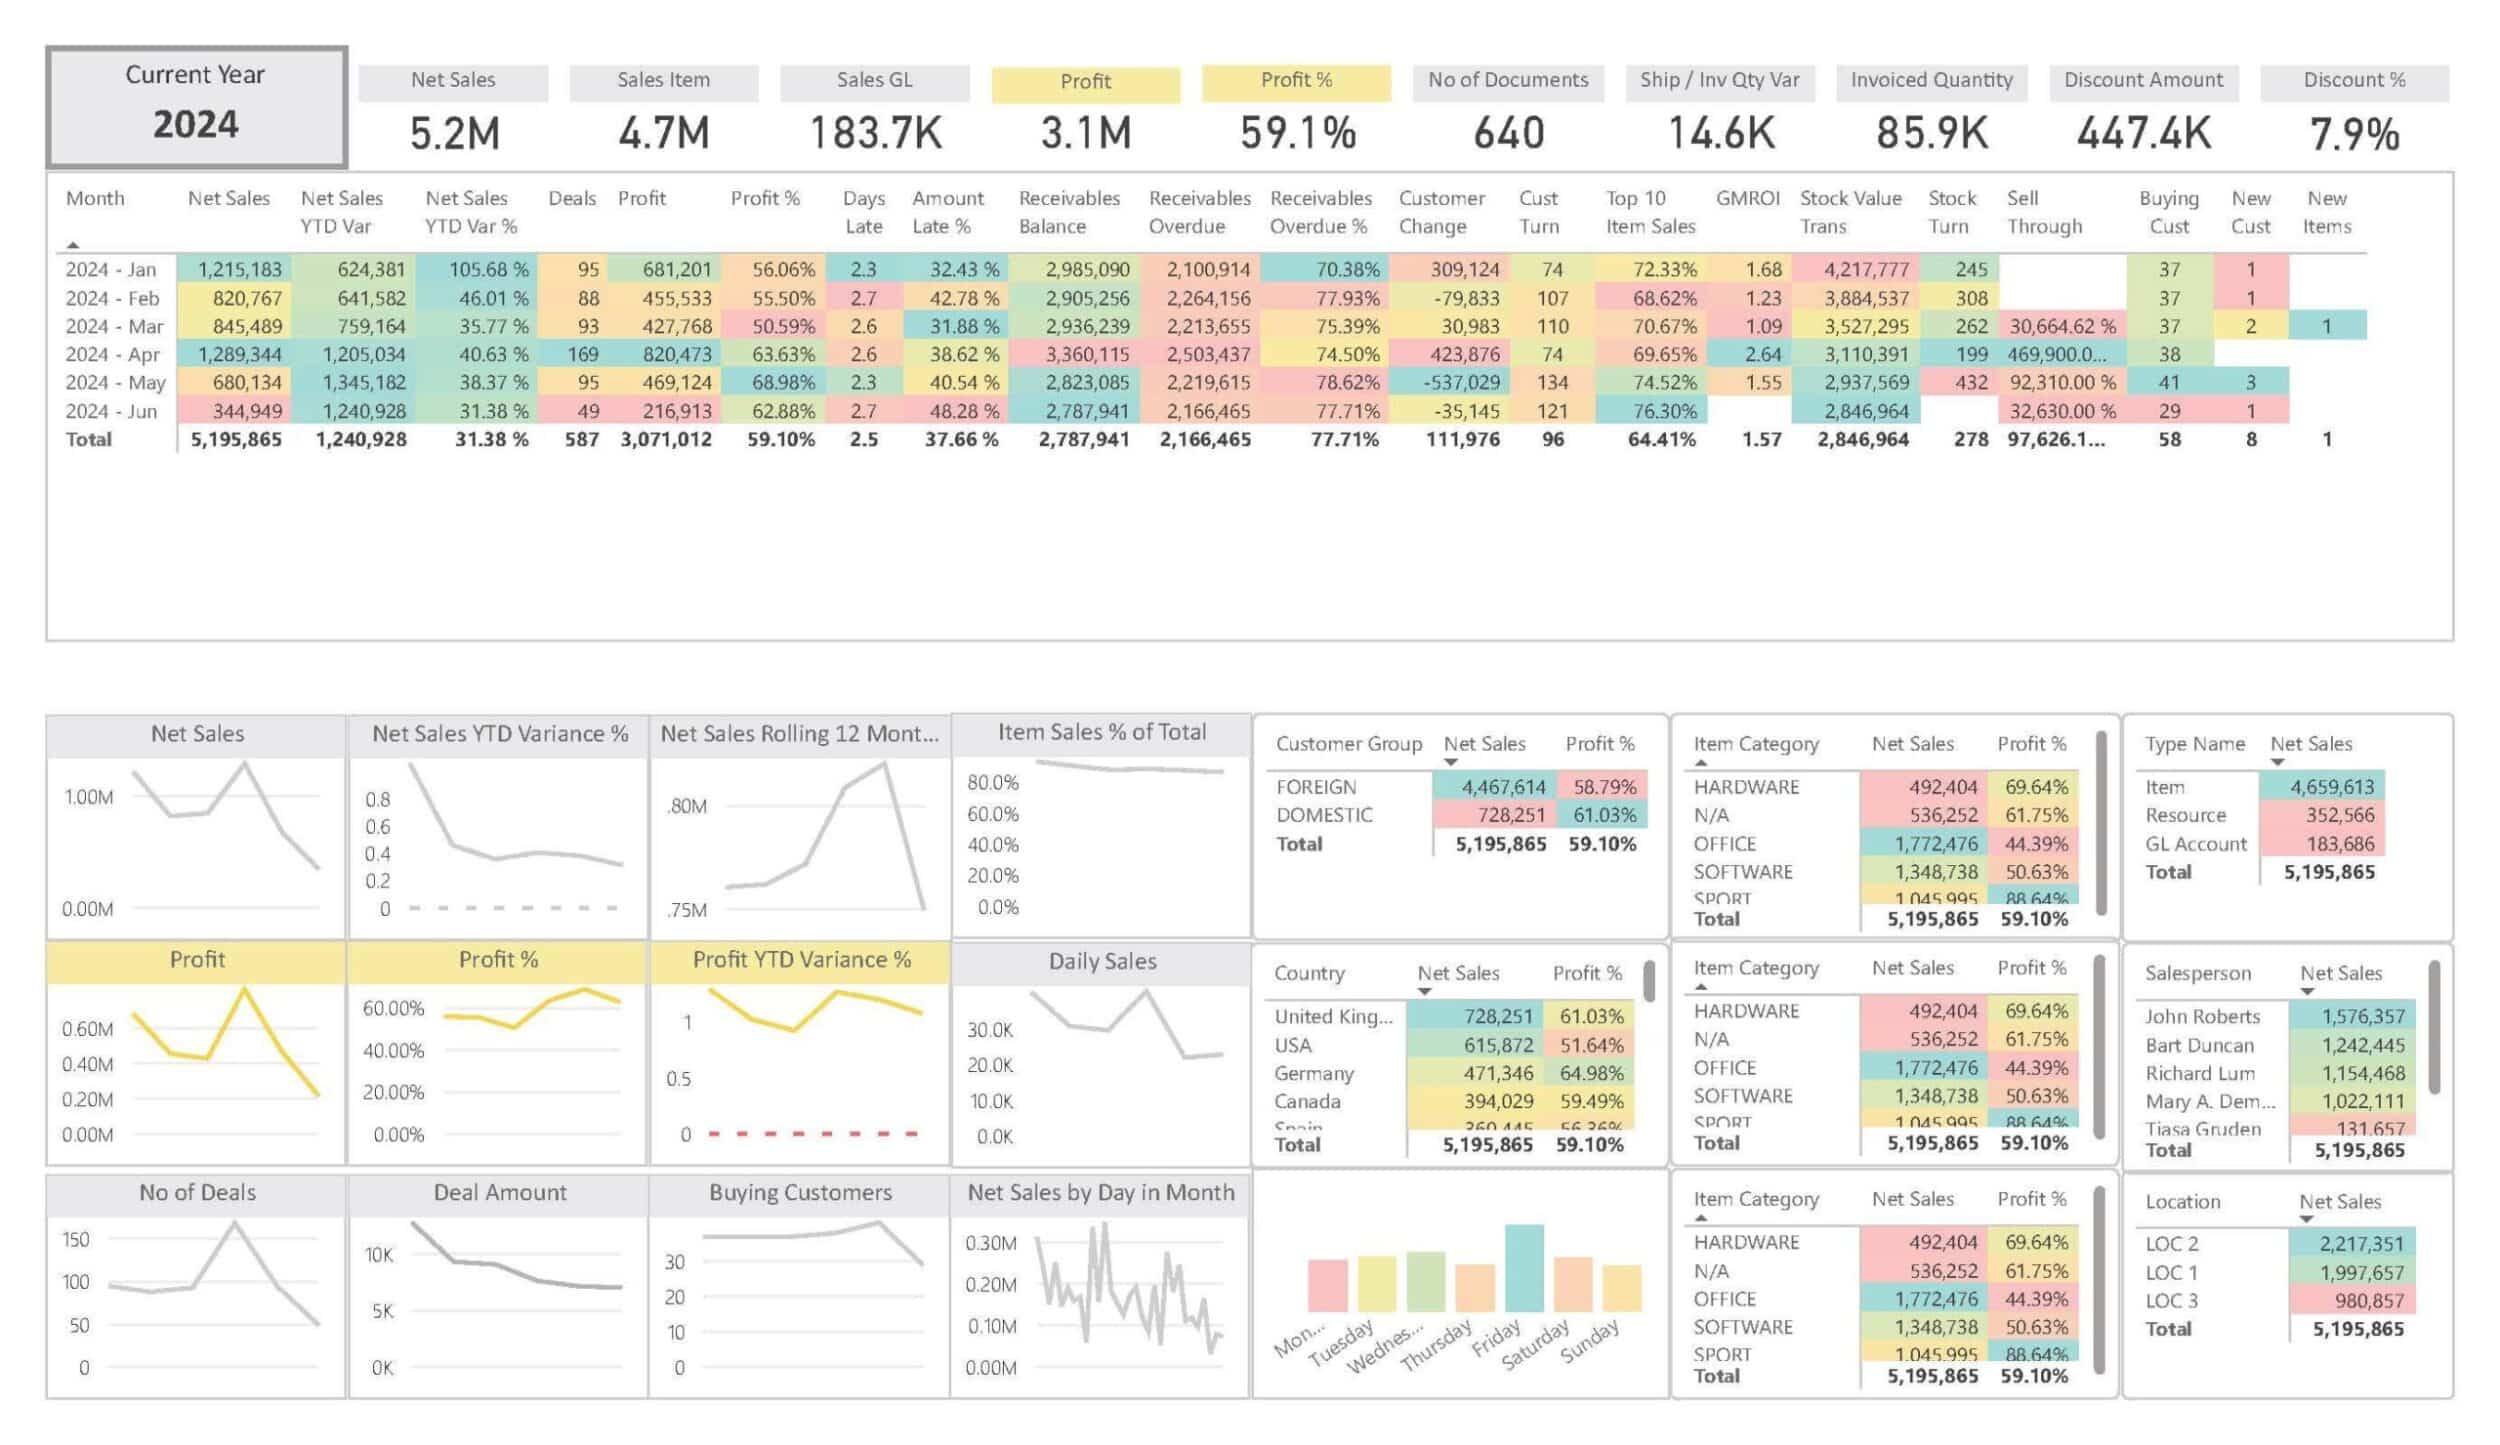
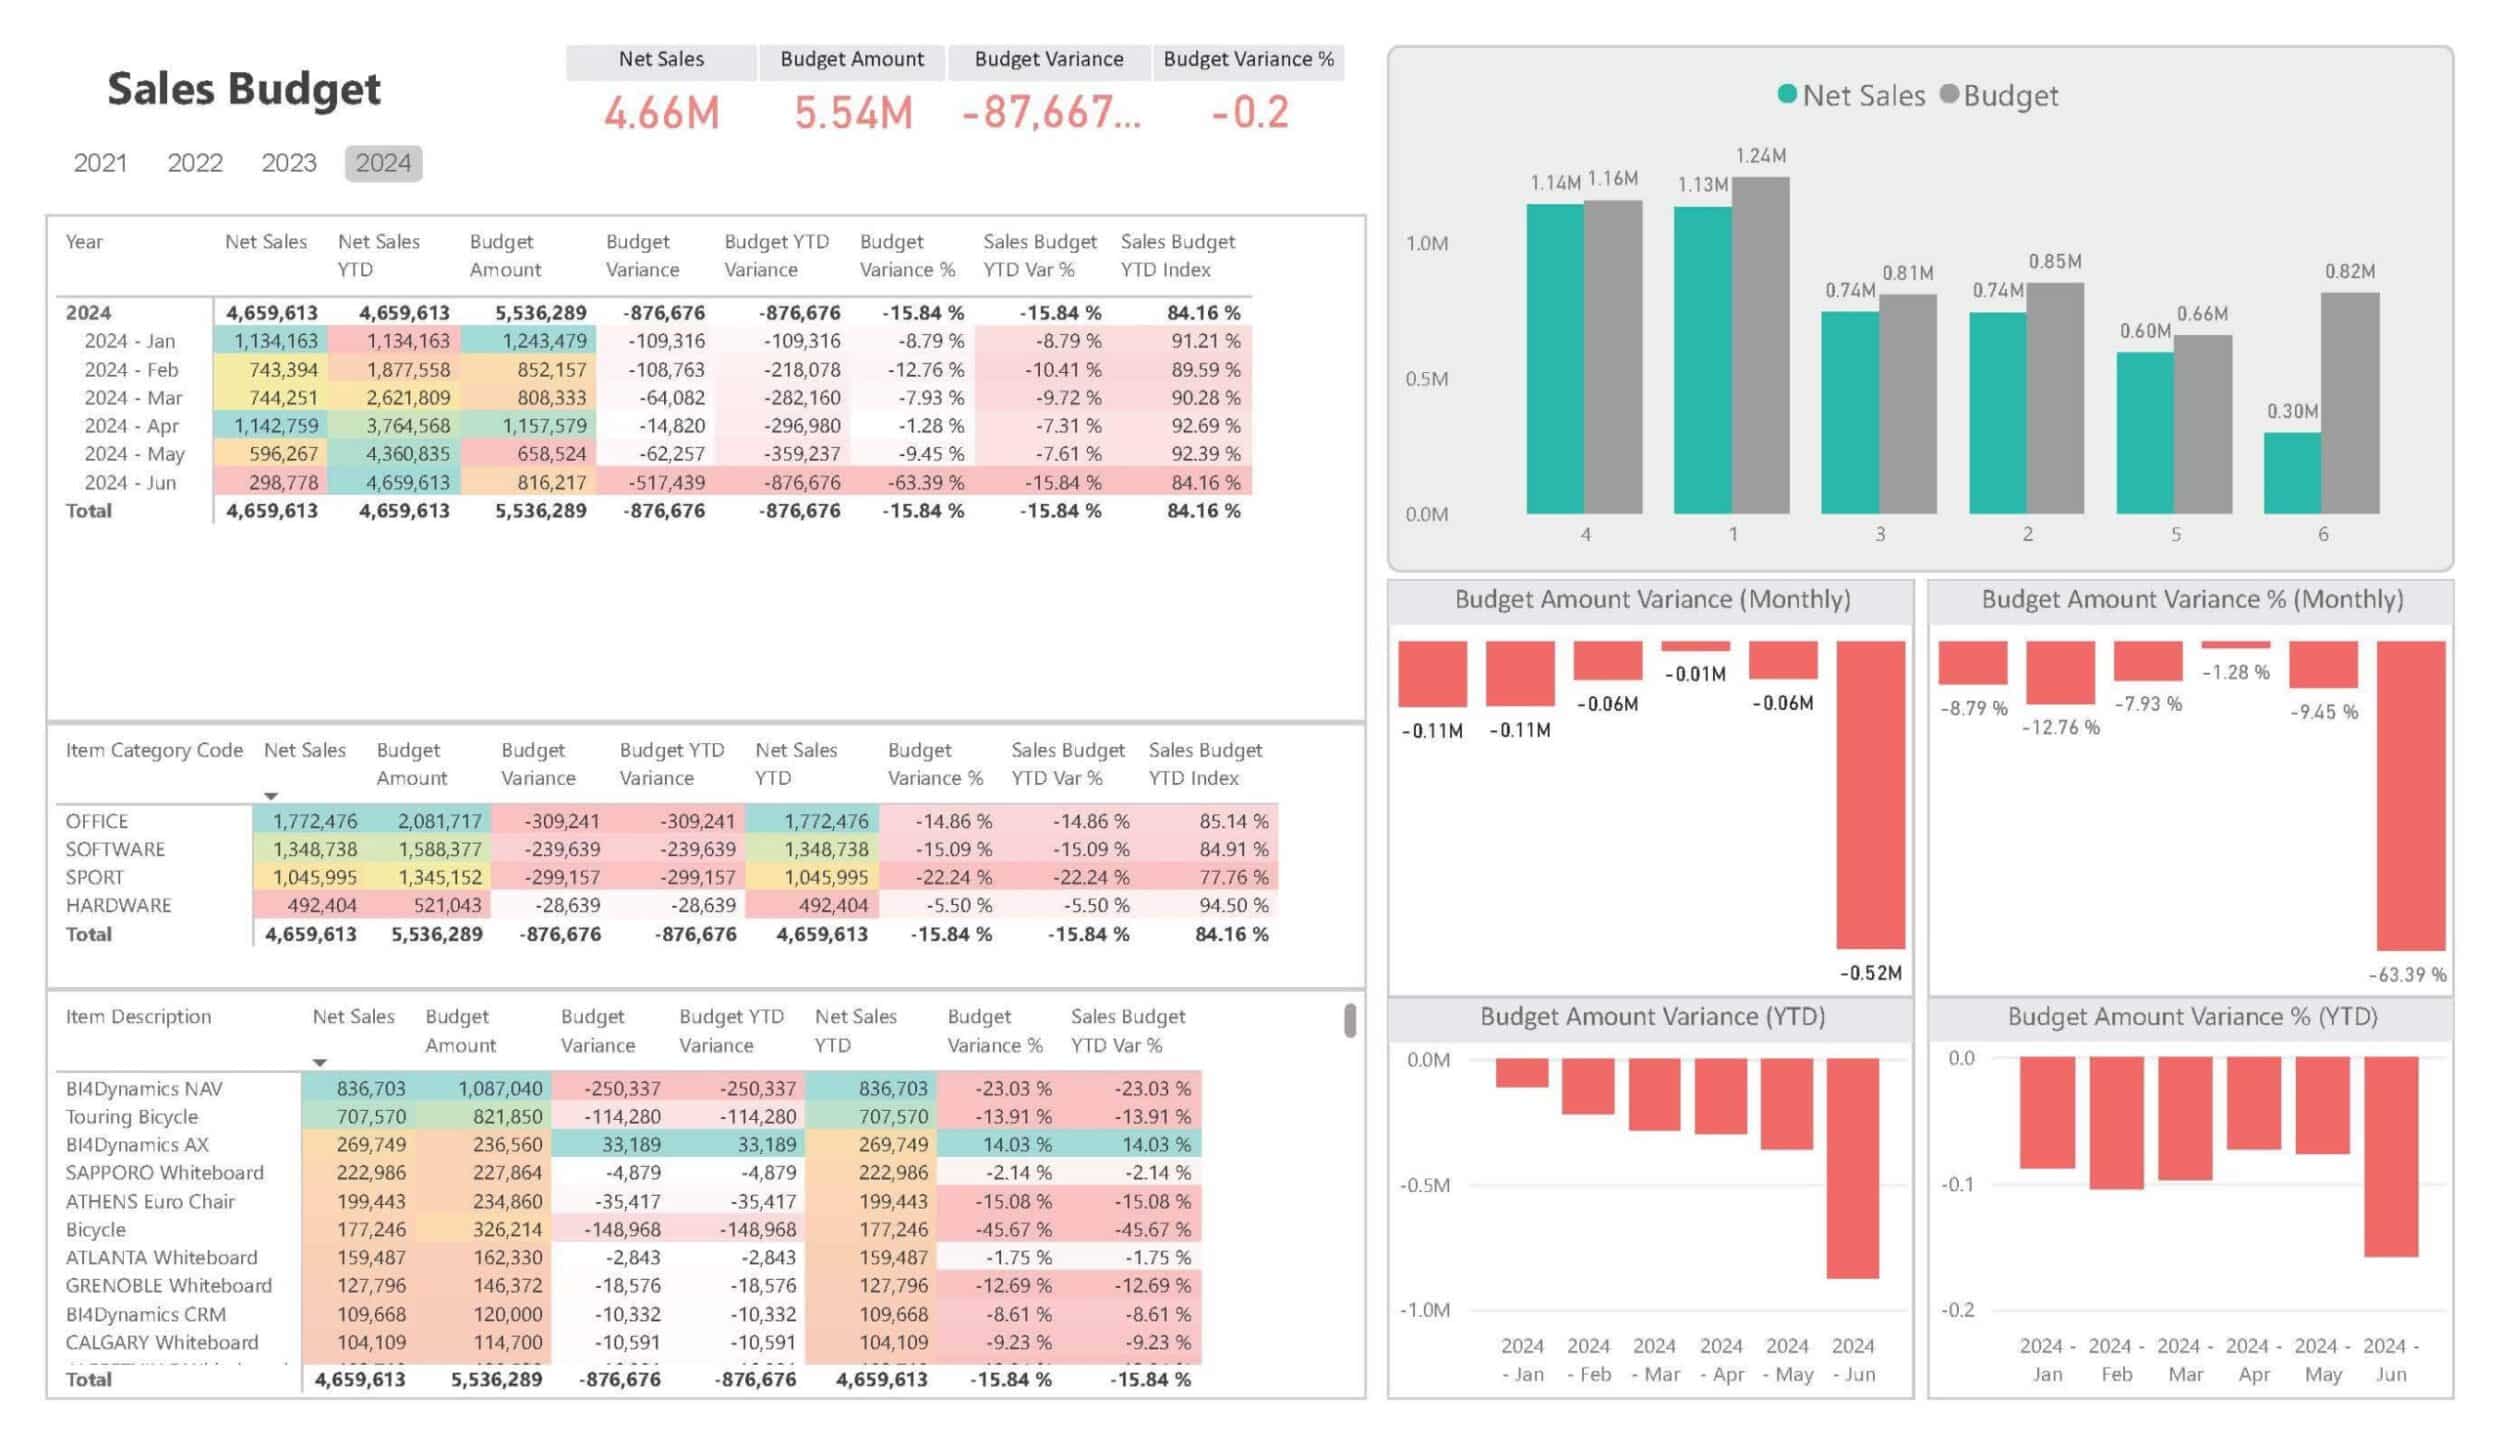
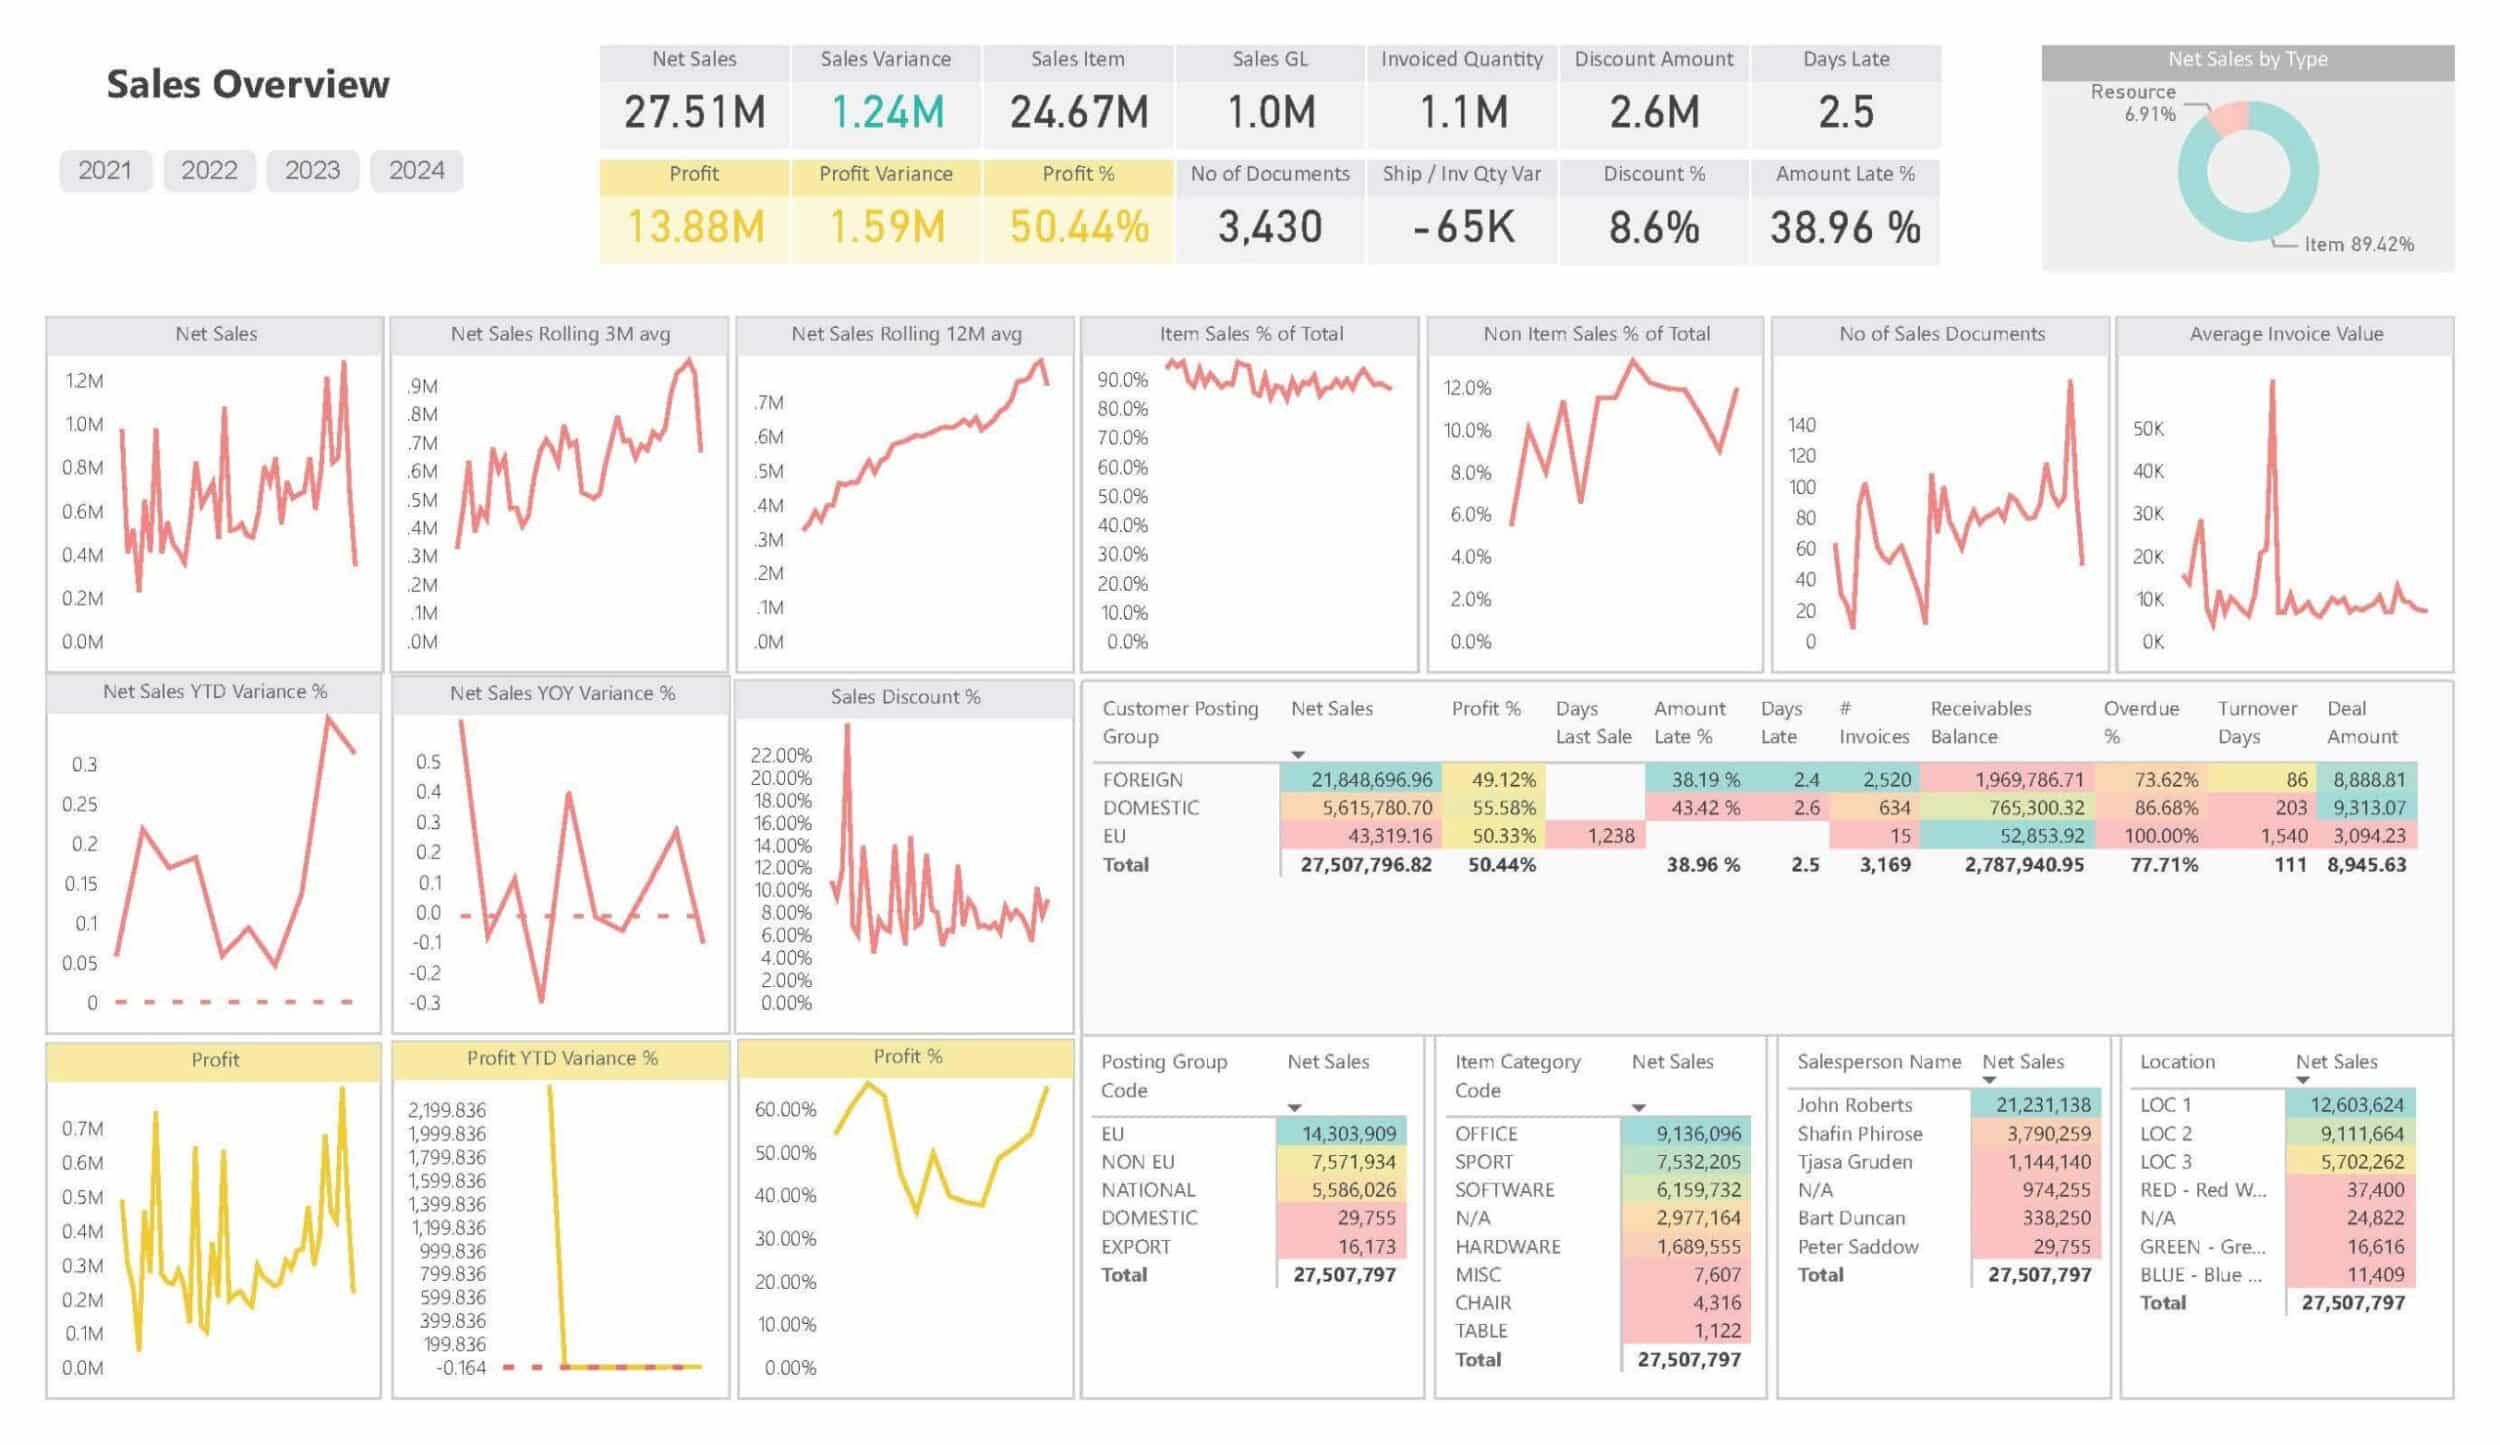
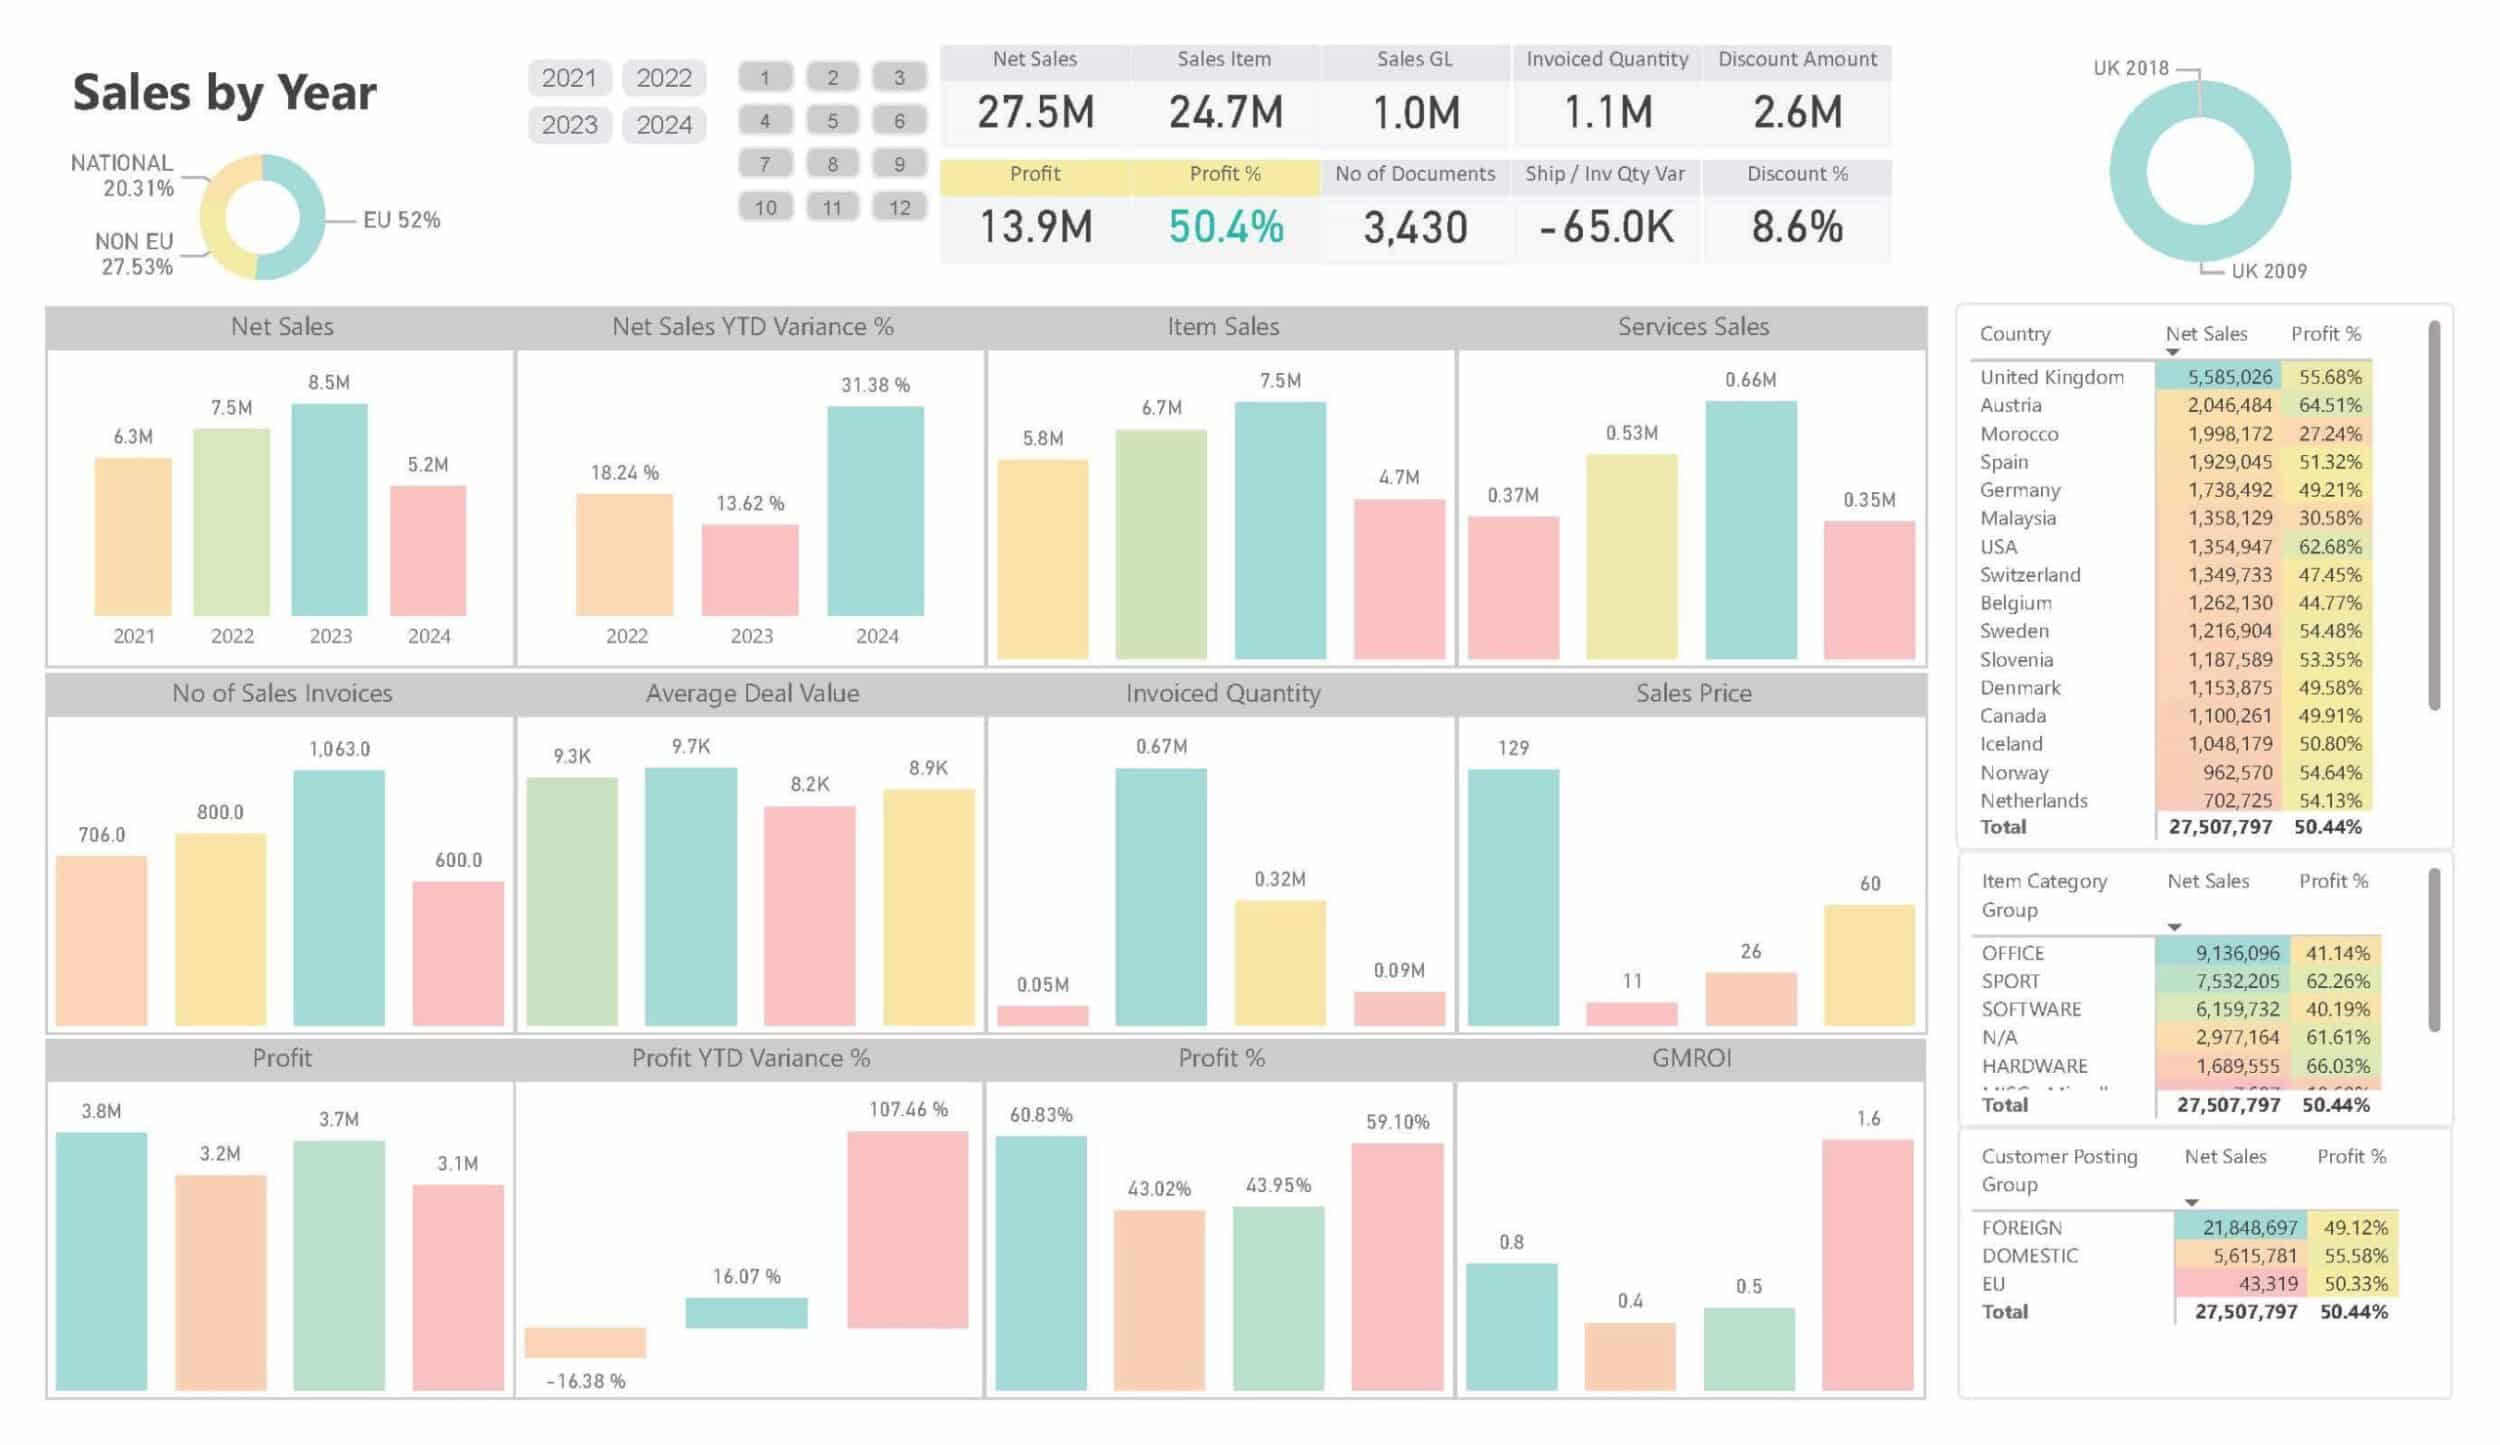
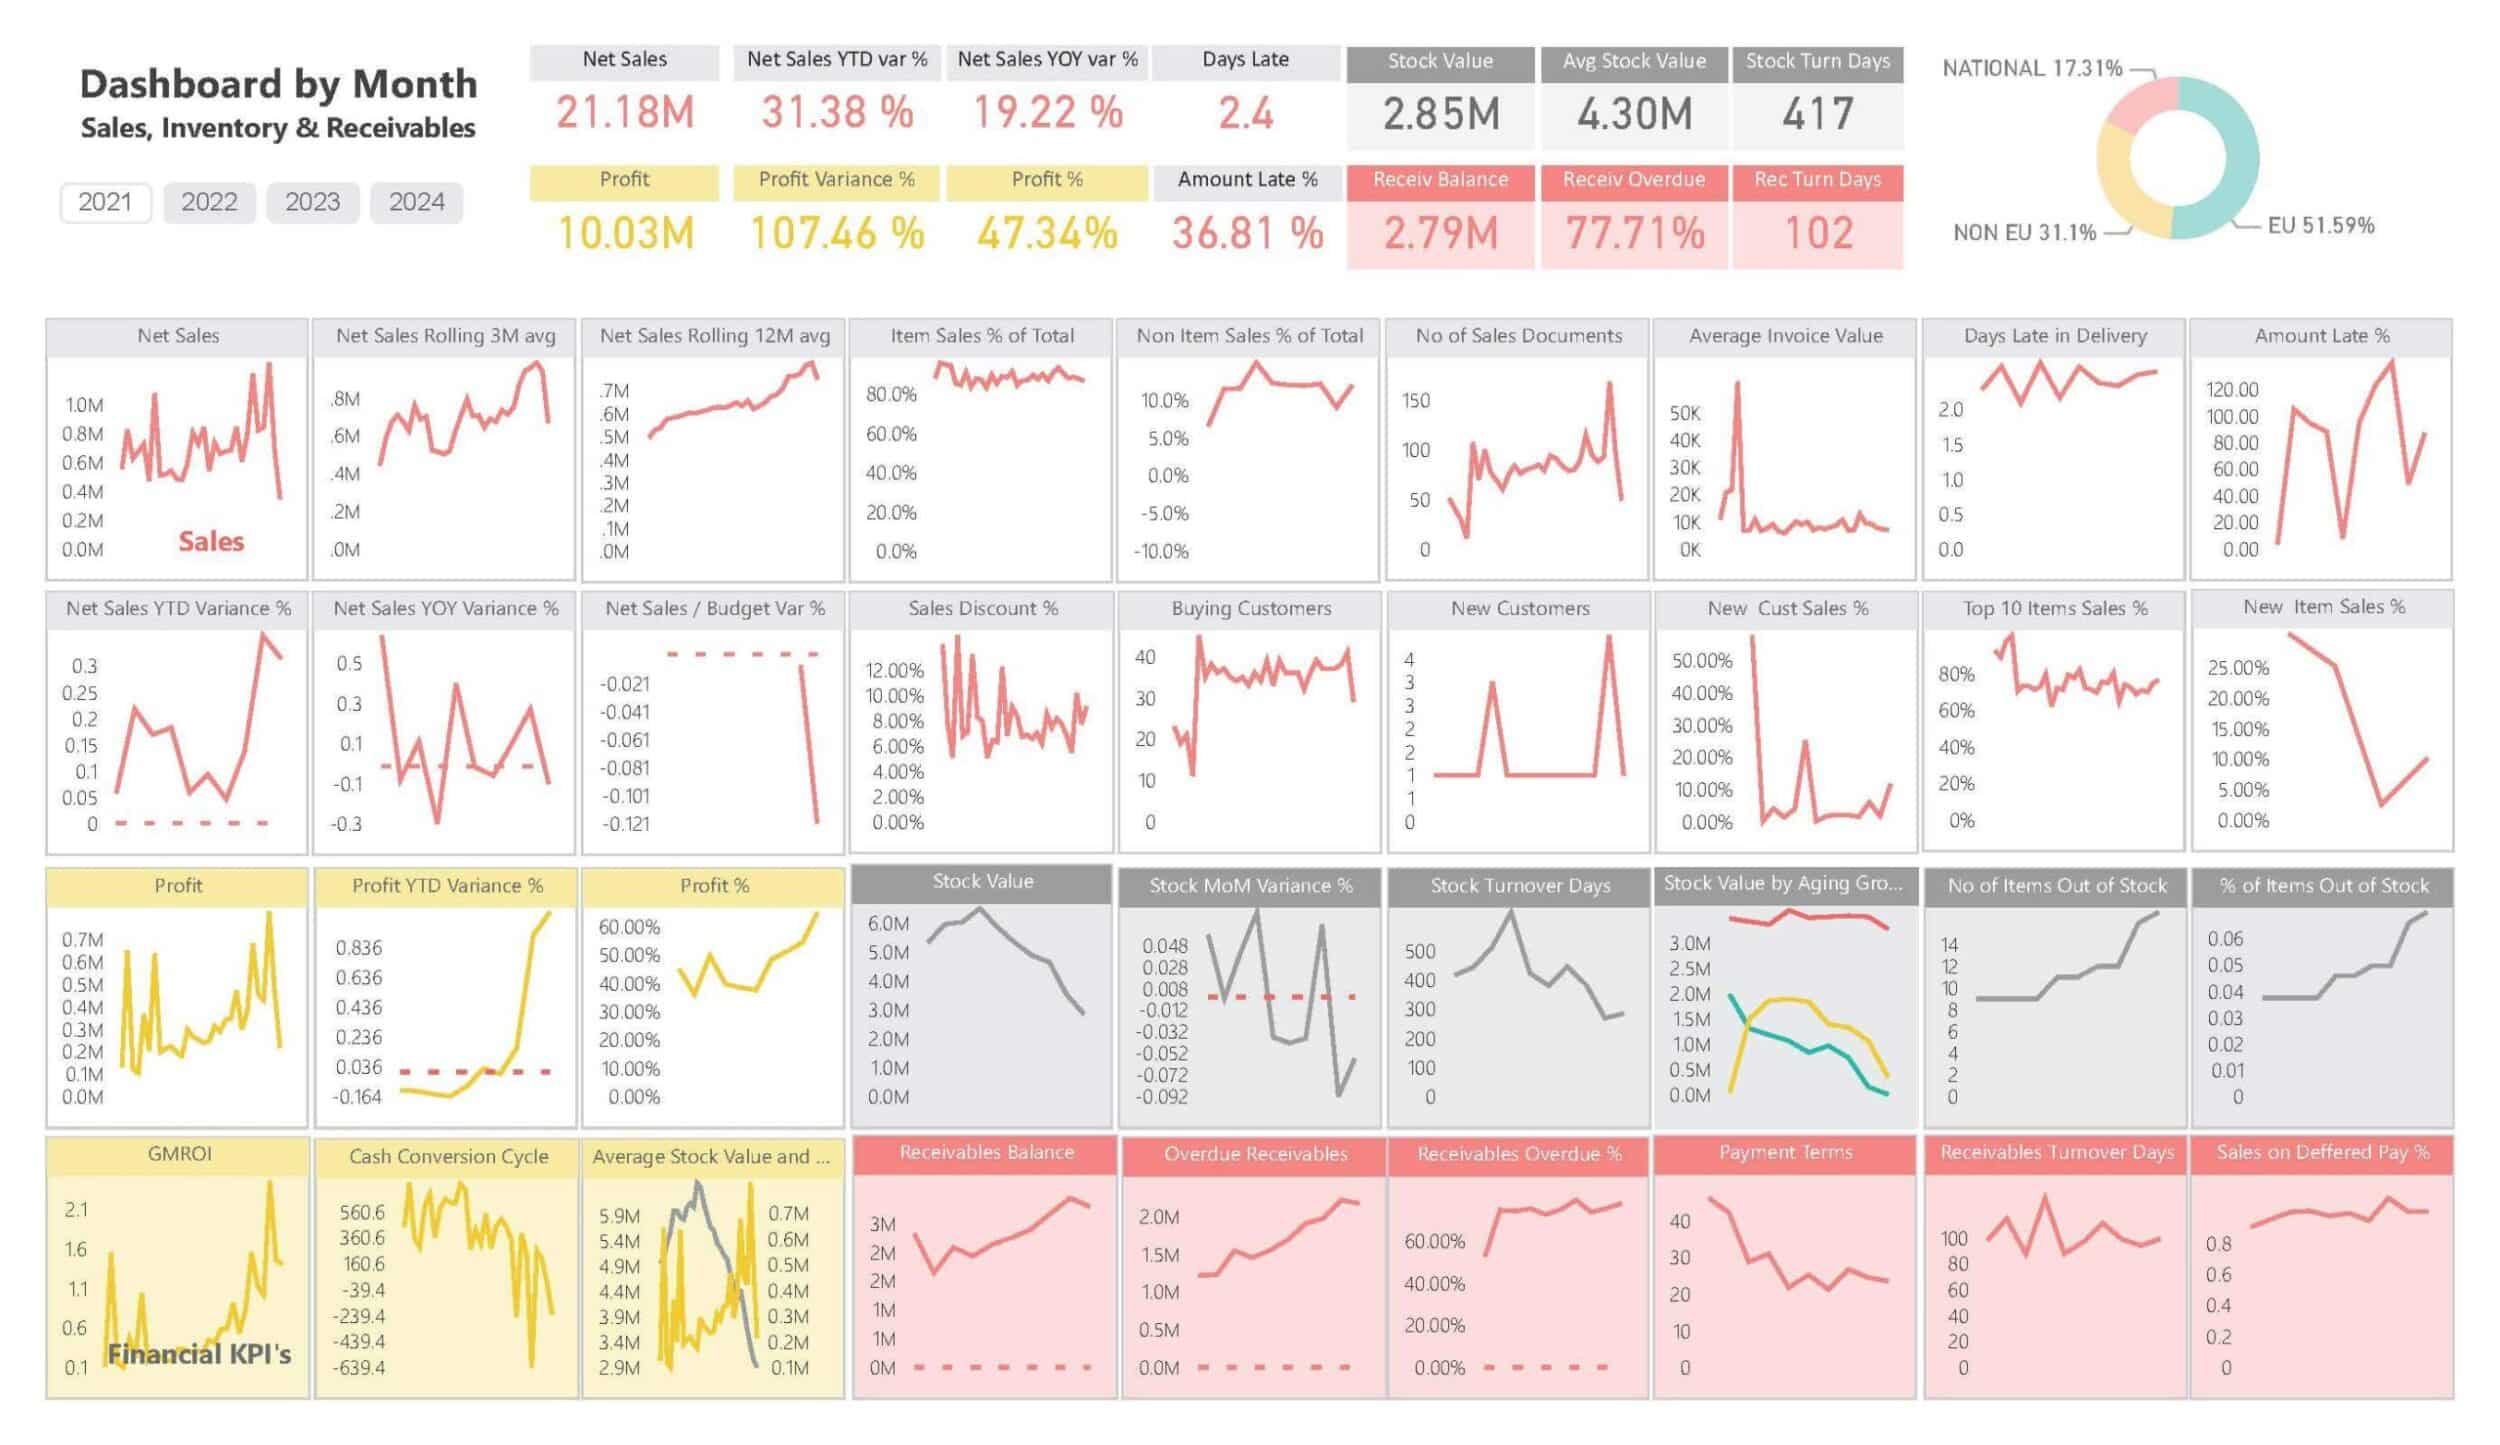
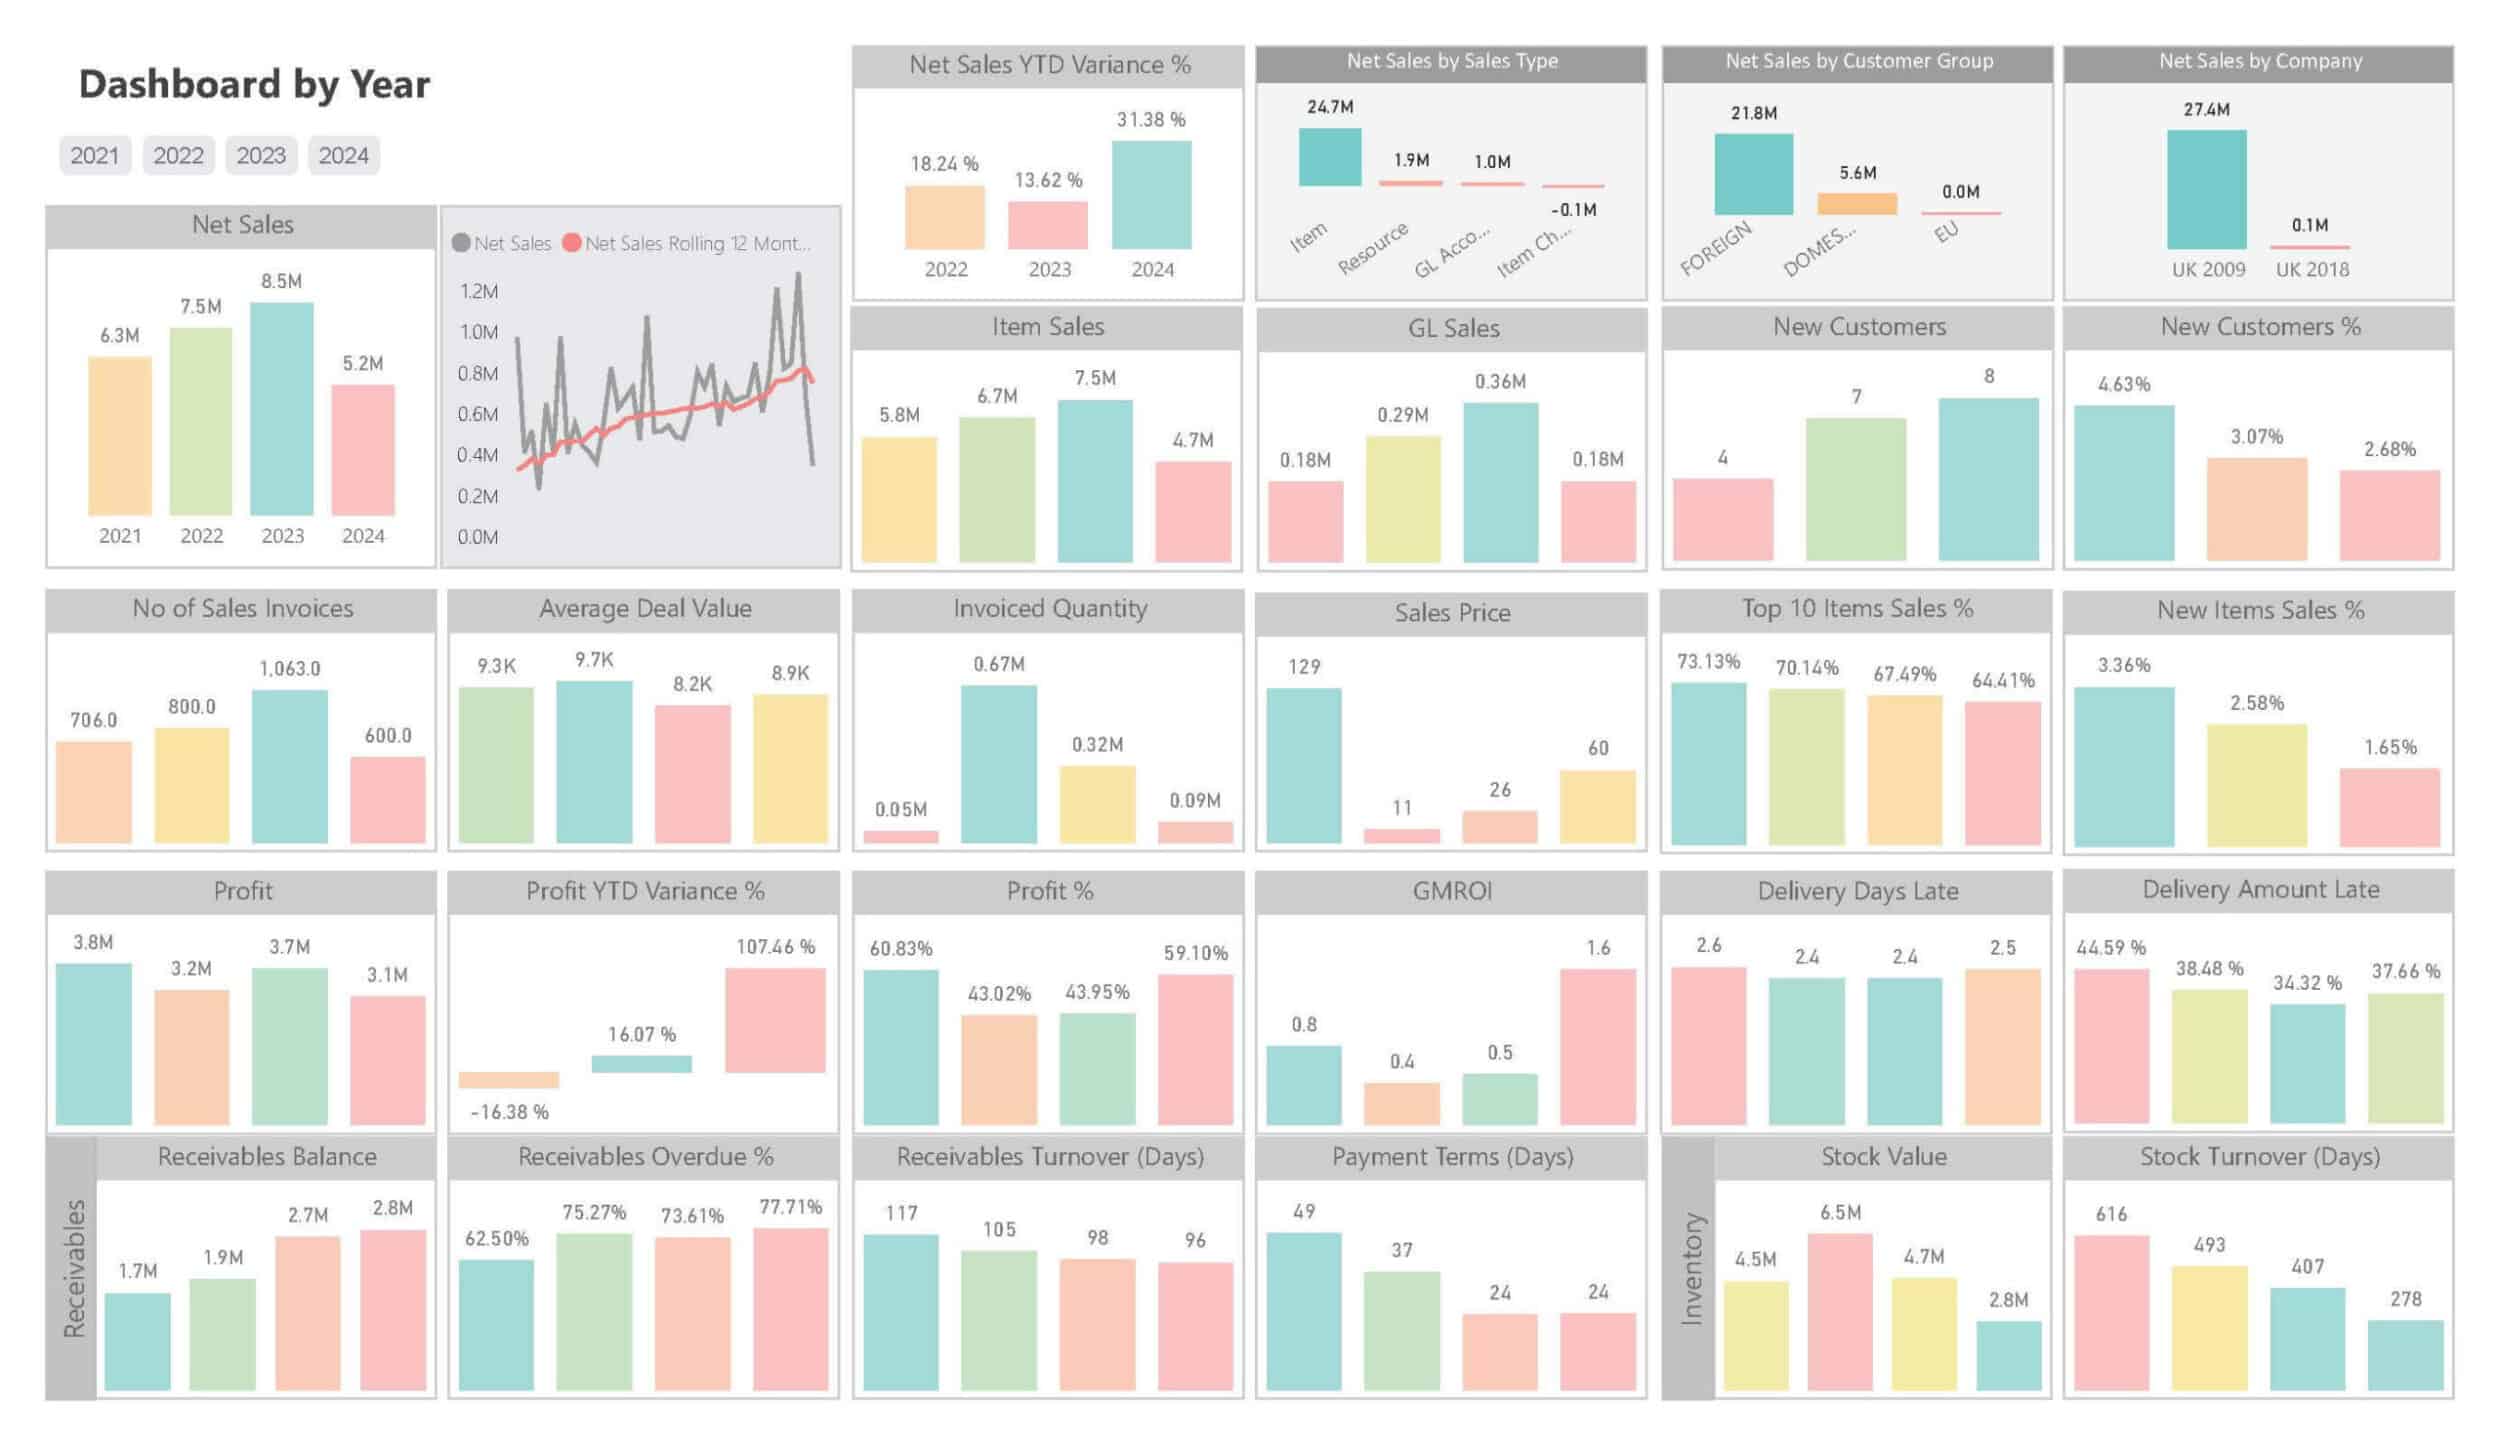
Boardroom-Ready Power BI Dashboards
for All Your Business Areas
This dashboard isn’t available here yet. For the full interactive experience, explore our Live Demo.
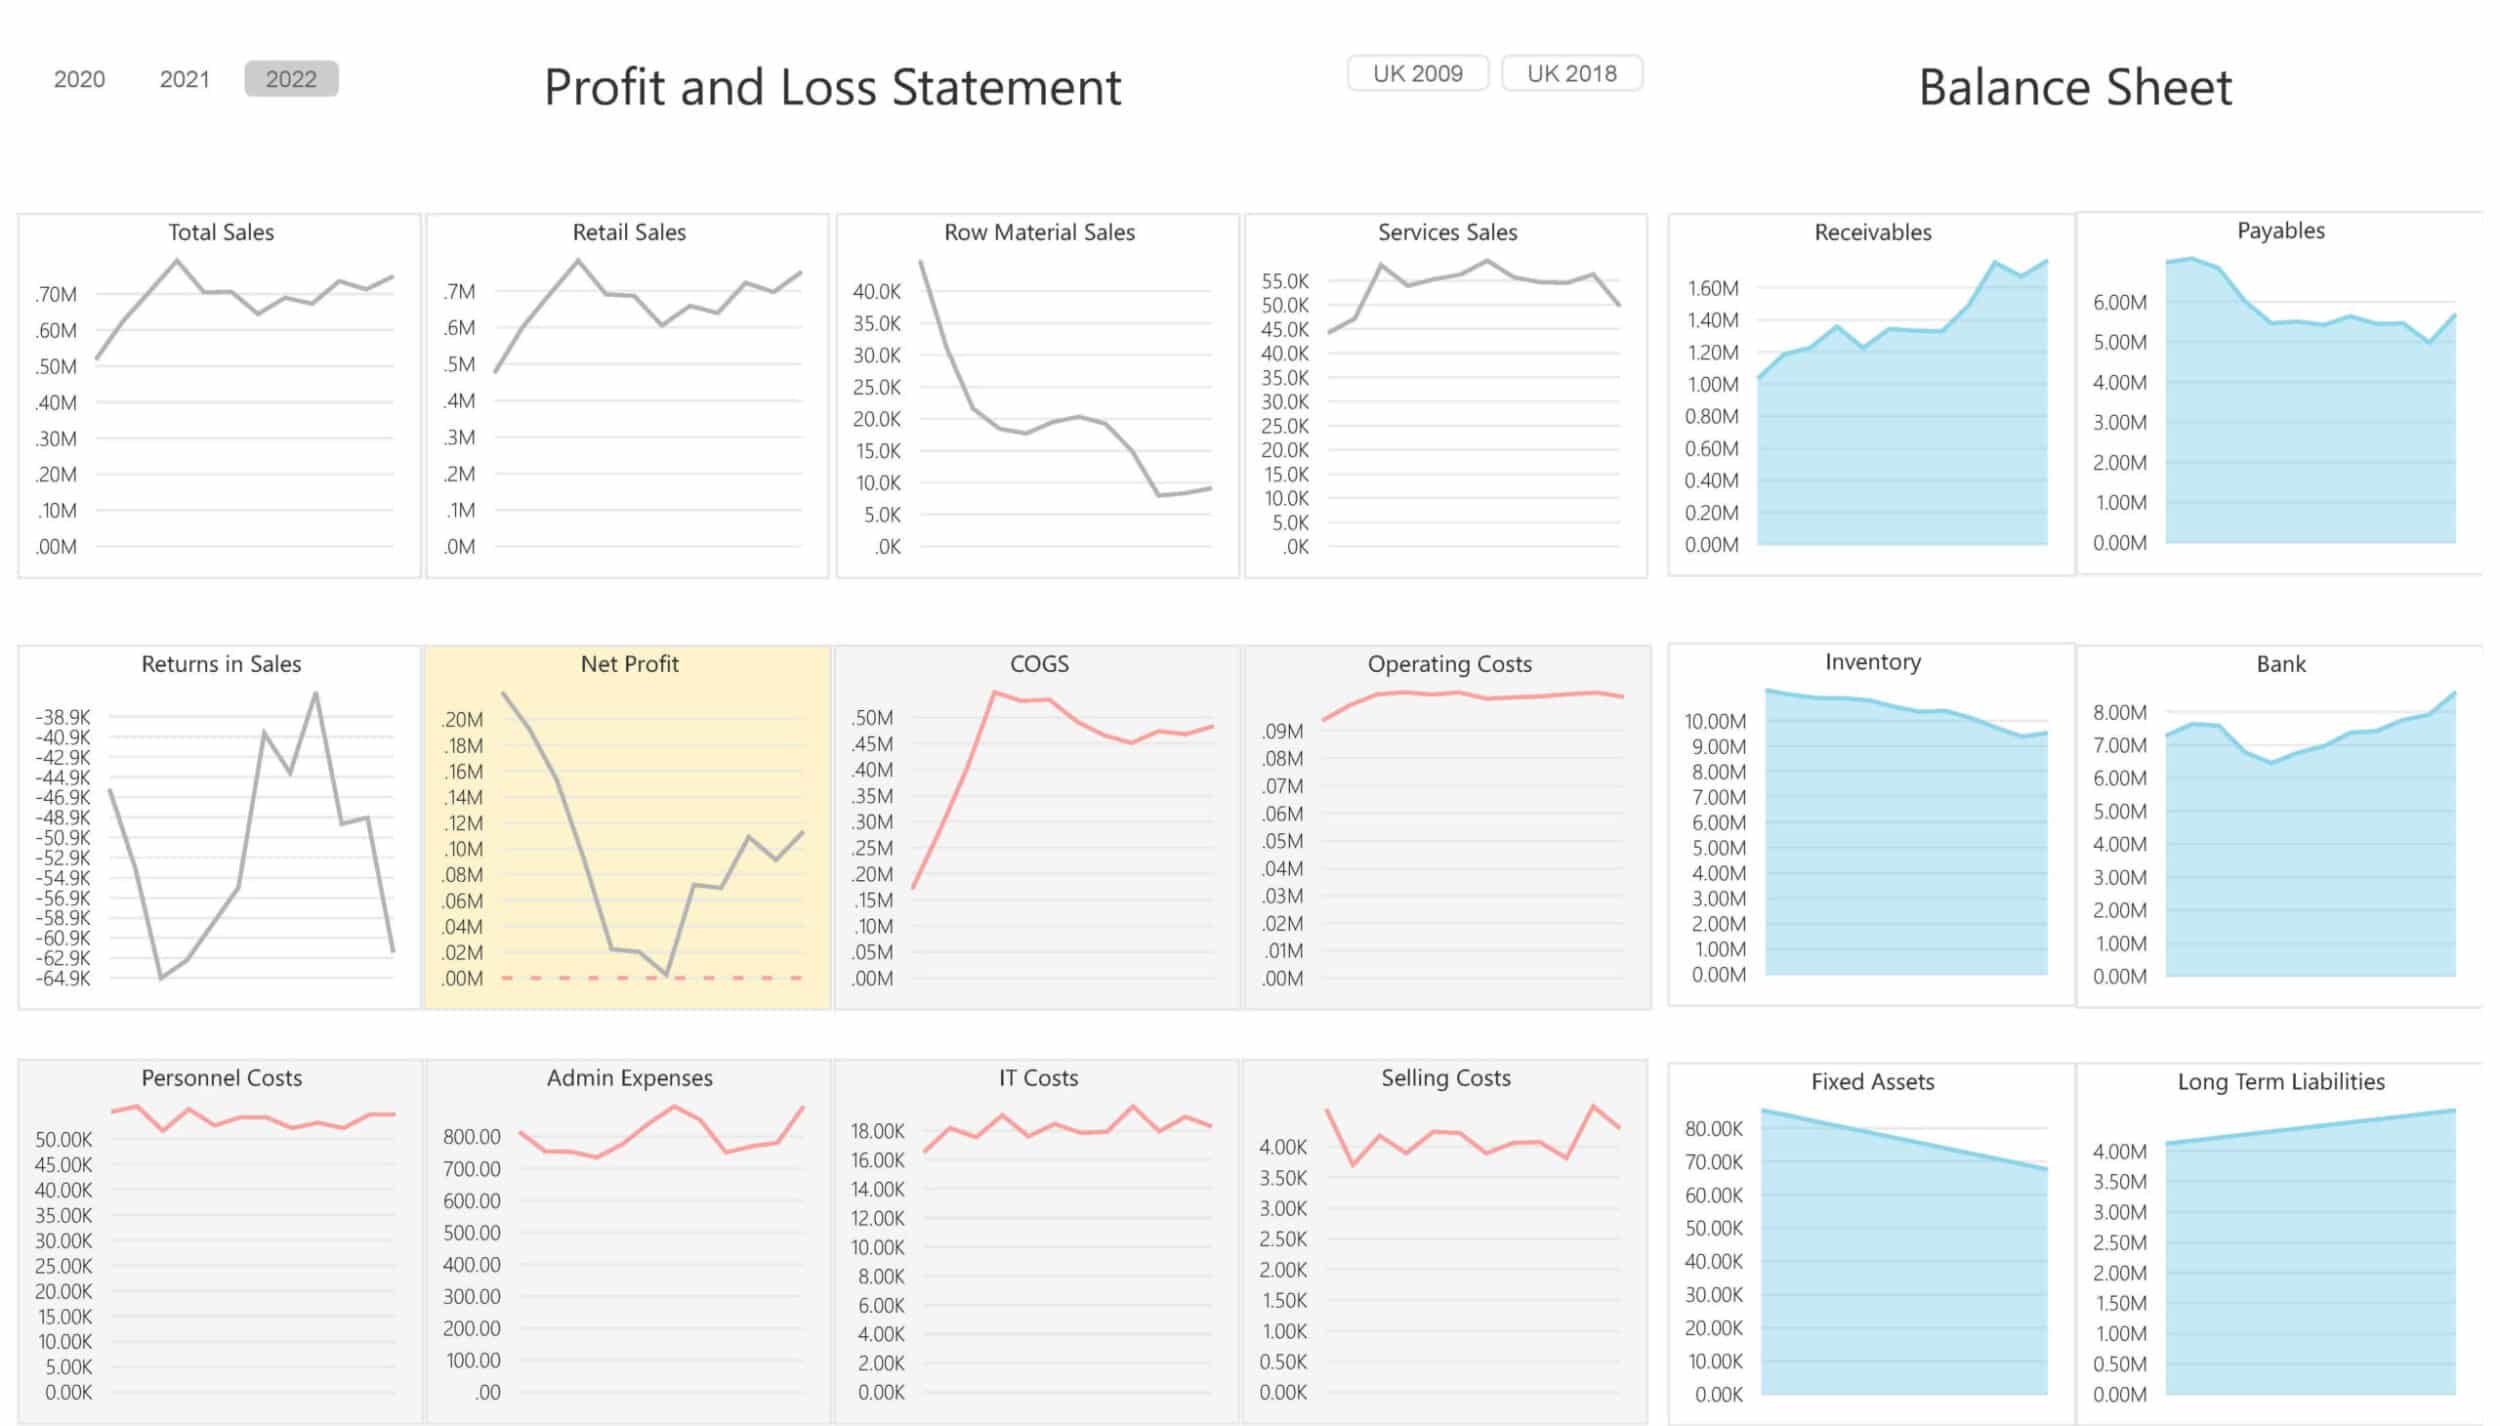
This dashboard isn’t available here yet. For the full interactive experience, explore our Live Demo.
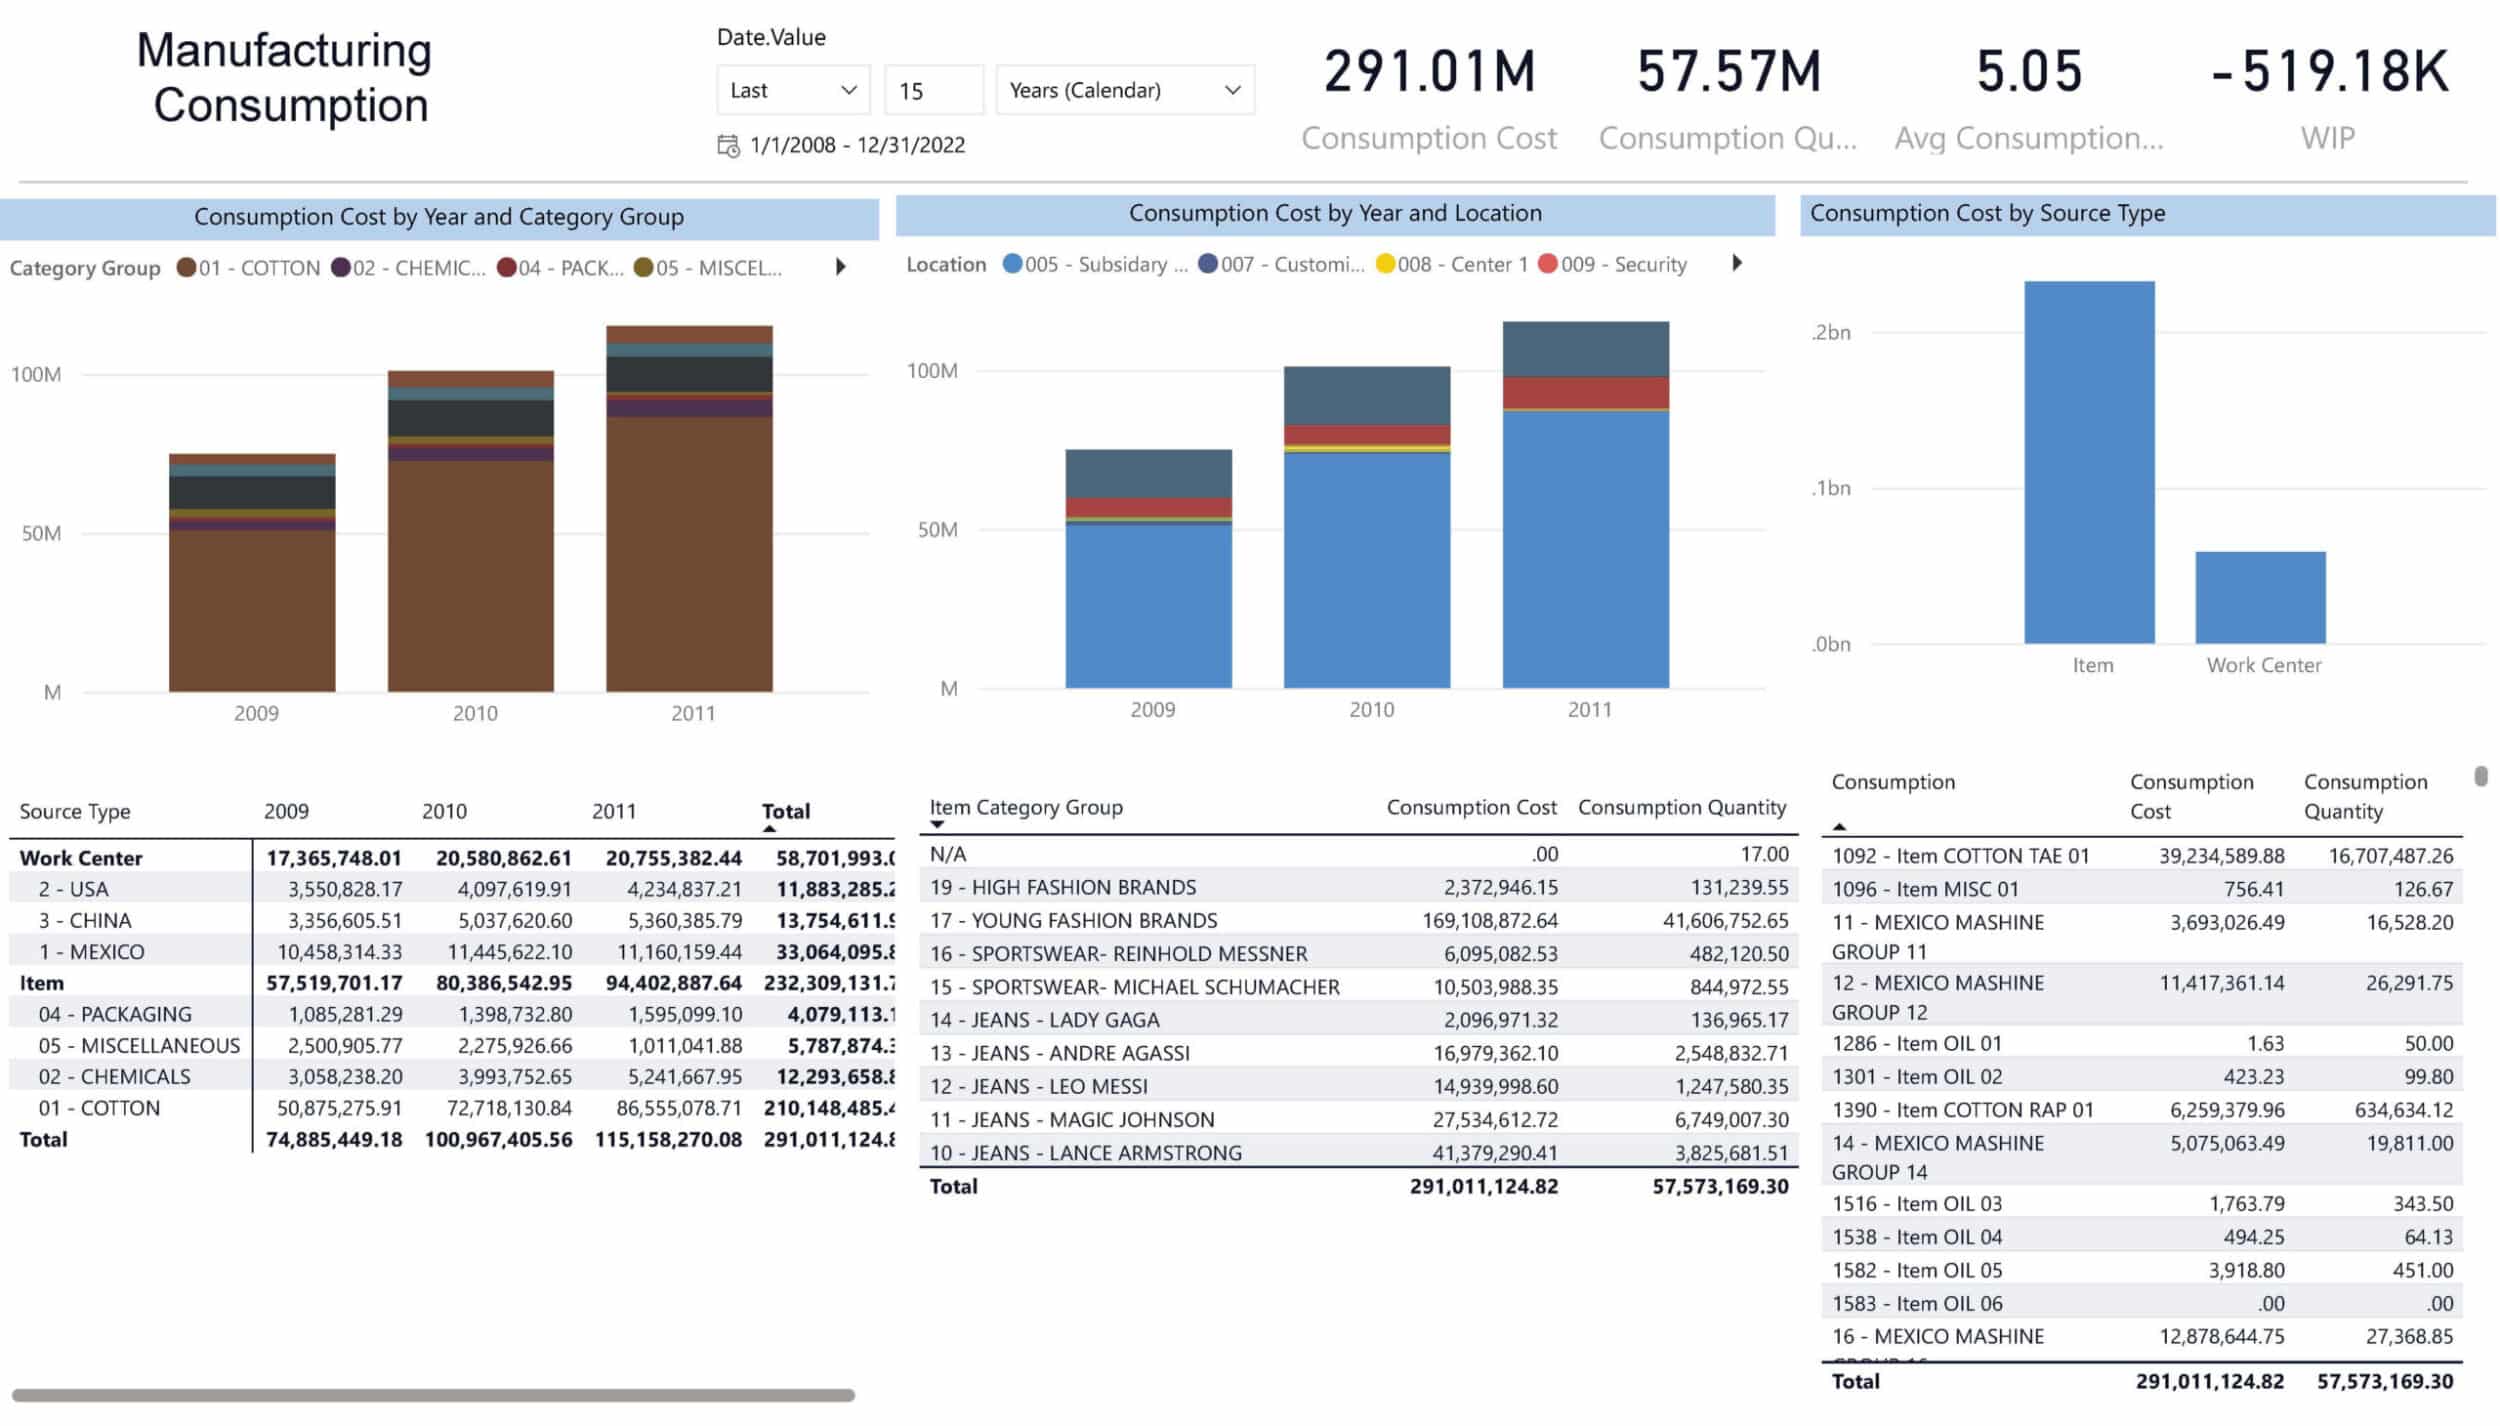
This dashboard isn’t available here yet. For the full interactive experience, explore our Live Demo.
Supercharge Your F&O Analytics with a Robust Data Warehouse for Fast & Seamless Power BI Reporting
From Raw Data to Boardroom-Ready Insights in Hours
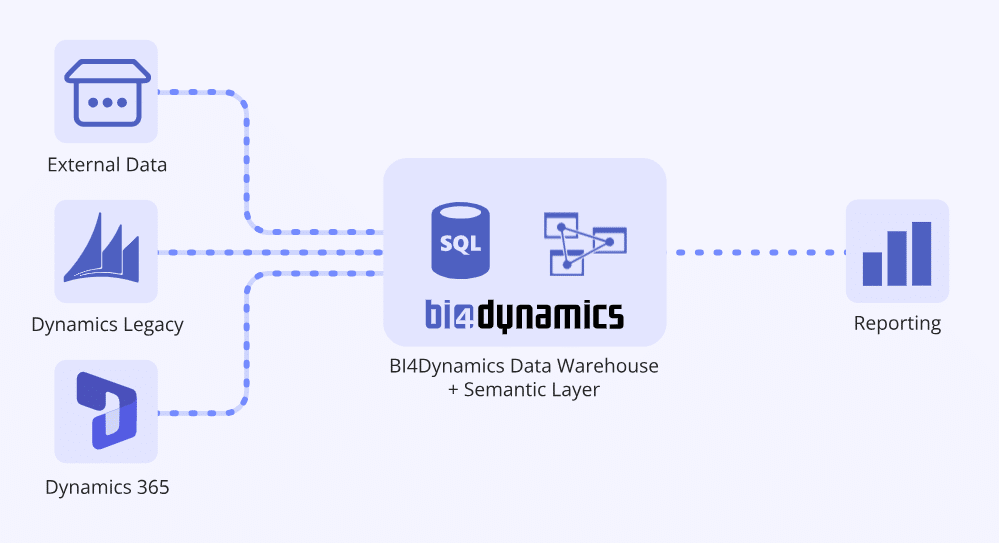
Seamless Data Integration Across All F&O Versions
Effortlessly connect all your data sources, from AX 2012 R3 to the latest D365 F&O, ensuring seamless integration across versions.
BI4Dynamics simplifies the complex process of consolidating your data into a centralized, powerful Data Warehouse.

Get Insights in Hours with Automation
Streamline your data processes with BI4Dynamics’ automated solution, which provides comprehensive insights into every business area in a matter of hours.
Say goodbye to manual work and enjoy the benefits of rapid, reliable data transformation.
3000+ BI Metrics - Fully Flexible Analytics
Unlock over 150 pre-built Power BI dashboards and gain access to more than 3000 BI metrics.
With our flexible data warehouse, you can start visualizing and analyzing critical business data from day one.
Empower your team to make informed, data-driven decisions instantly.

Get a detailed guide on getting data out for D365 Finance and Operations
✅ Full architecture diagram with all options available
✅ 3 different ETL processes from D365 FO
✅ Best practices on advanced data modeling
✅ Seamless reporting in Power BI and Excel example
Getting Data from D365 Finance and Operations - Key Information
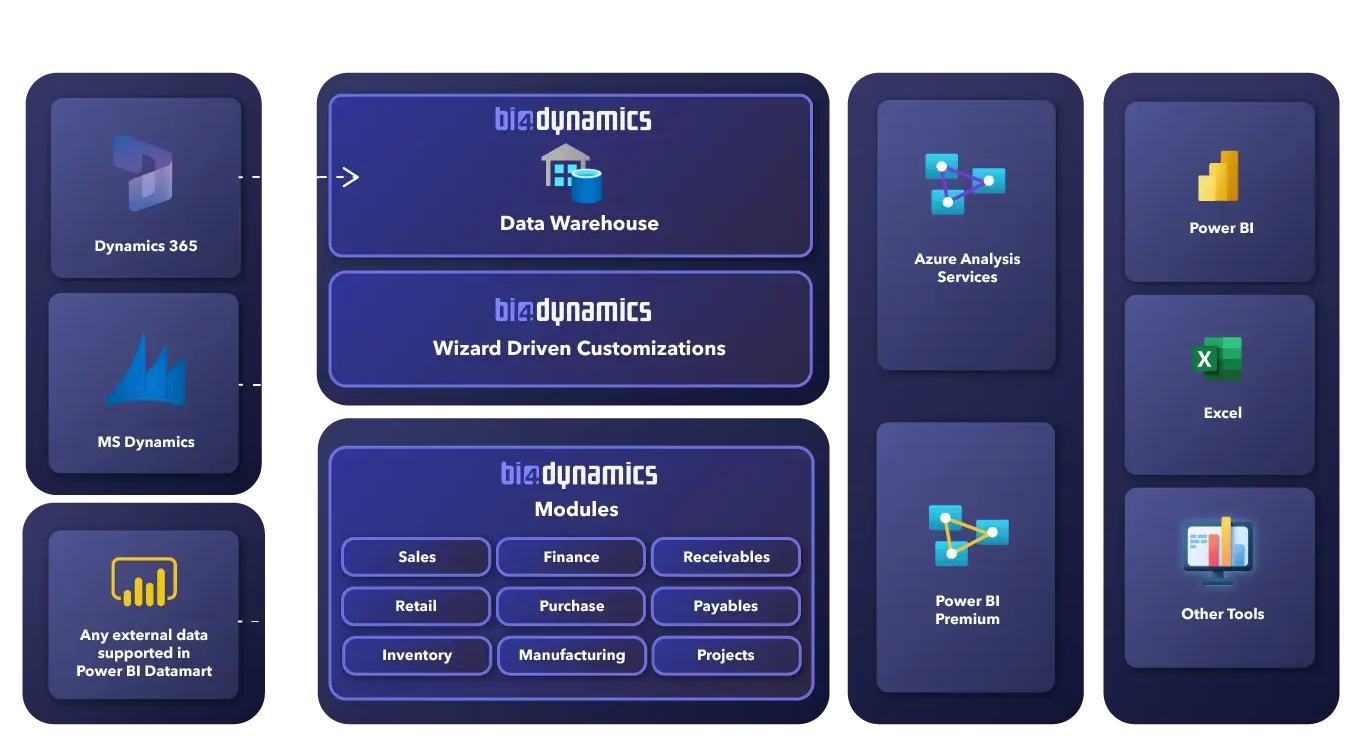
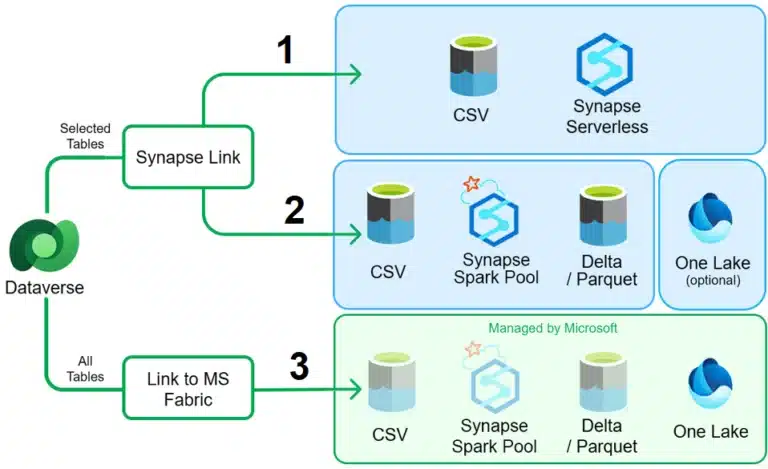
Architecture
ETL (extract, transform, load) from D365FO
D365 Finance and Operations data is not available to external tools due to security and performance reasons. Microsoft is providing the following ETL process options (extract, transform, load) to get data out of D365:
- Synapse link – Synapse Serverless
- Synapse link – Synapse Spark Pool
- Link to Microsoft Fabric
All options for extracting data from D365 F&O lead to accessing transactional data that isn’t optimized for analytics.
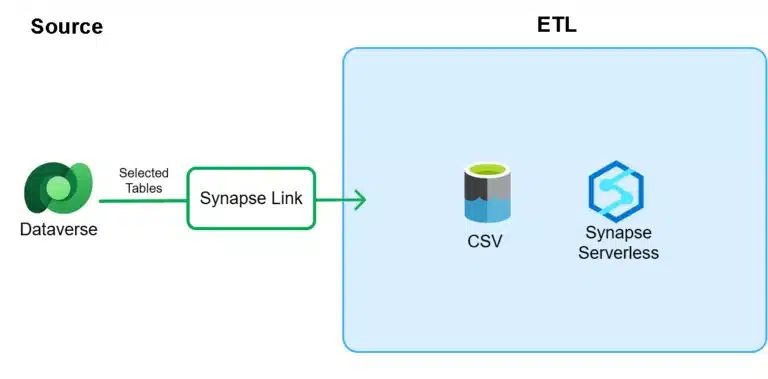
1: Synapse link - CSV files - Synapse Serverless
Data Flow:
1. From D365 FO to CSV files – Microsoft service:
- Utilizing Synapse Link, managed by Microsoft at no additional costs.
- Customers manually select D365 FO tables in Dataverse.
- Microsoft Service generates CSV files into an Azure Storage Container.
2. From CSV files to Data Warehouse – BI4Dynamics solution:
- Synapse Serverless reads these CSV files.
- Inserts them into the BI4Dynamics Data Warehouse staging area.
A new solution from BI4Dynamics is available; the solution used in Export to DataLake will not work.
Key Features:
- Data Format: Synapse Serverless employs architecture like Export to DataLake, with different CSV formats and file structures.
- Cost: The most economical option: Synapse Serverless is priced at 5$ per terabyte (TB) of data processed.
- Complexity: This option requires the transformation of CSV files, making it from a customer perspective more complex. However, with a BI4Dynamics license, customers get a fully automated solution.
- Latency: It boasts the best latency among available options, it takes about 5-10 minutes after On-demand execution from receiving the CSV files to landing data in the data warehouse for a DFO database of 200 GB.
Verdict: This setup offers efficient data integration with cost-effectiveness, although it may require some complexity in development. However, it provides the advantage of optimal latency, which is crucial for real-time analytics and reporting.
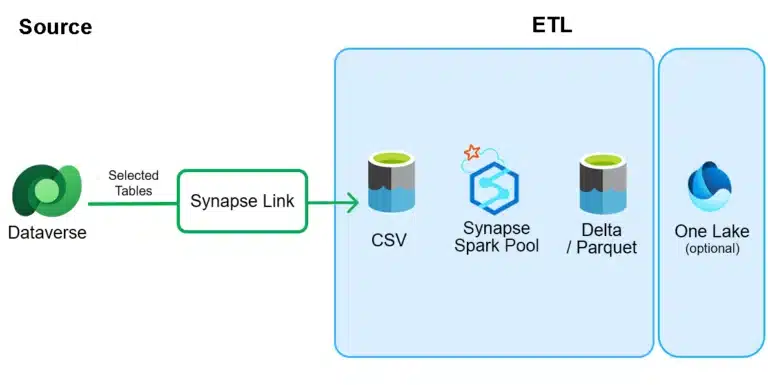
2: Synapse link – Synapse Spark Pool - Delta / Parquet
Data Flow:
1. From D365 FO to CSV files – Microsoft service:
- The same as it was described in option #1.
2. CSV conversion to Delta/Parquet – Microsoft service:
- Synapse Spark Pool engine is utilized to transform these CSV files into Delta/Parquet format.
- Files are linked in OneLake to act like SQL endpoint, available for many processing solutions (Power BI, data warehouse)
3. From Delta/Parquet to Data Warehouse – BI4Dynamics solution:
- OneLake SQL endpoint acts as an SQL database and is used as the source for the BI4Dynamics Data Warehouse staging area.
Key Features:
- Data Format: Delta/Parquet format, providing many advantages for further processing.
- Cost: Utilizing Synapse Spark Pool incurs an additional cost (priced per hour). Refer to the Azure pricing page for details.
- Complexity: Synapse Spark Pool transforms CSV files to Delta/Parquet files which gives a better starting point for building the BI model.
- Latency: have higher latency compared to #1 due to the additional step of Spark conversion. Conversion from CSV to Delta/Parquet is scheduled in intervals, minimum is 15 minutes.
Verdict: This approach provides processing flexibility and the data format is great for further transformations; This comes with additional costs and potentially higher latency due to the Spark conversion process.
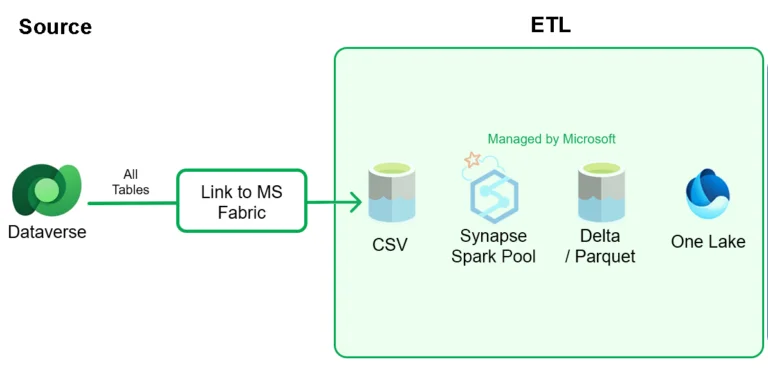
3: Link to MS Fabric – Delta / Parquet in One Lake
Data Flow:
1. From D365 FO to CSV files – Microsoft service:
- The same as it was described in option #1.
2. CSV conversion to Delta/Parquet – Microsoft service:
- Synapse Spark Pool engine is utilized to transform these CSV files into Delta/Parquet format.
- Files are linked in OneLake to act like SQL endpoint, available for many processing solutions (Power BI, data warehouse)
3. From Delta/Parquet to Data Warehouse – BI4Dynamics solution:
- OneLake SQL endpoint acts as an SQL database and is used as the source for the BI4Dynamics Data Warehouse staging area.
Key Features:
- Data Format: Delta/Parquet format, providing many advantages for further processing.
- Cost: Utilizing Synapse Spark Pool incurs an additional cost (priced per hour). Refer to the Azure pricing page for details.
- Complexity: Synapse Spark Pool transforms CSV files to Delta/Parquet files which gives a better starting point for building the BI model.
- Latency: have higher latency compared to #1 due to the additional step of Spark conversion. Conversion from CSV to Delta/Parquet is scheduled in intervals, minimum is 15 minutes.
Verdict: This approach provides processing flexibility and the data format is great for further transformations; This comes with additional costs and potentially higher latency due to the Spark conversion process.
Data Warehouse Automation vs. Power BI Modeling
After completing the ETL process, the modeling phase begins.
All options for extracting data from D365 F&O, lead to accessing transactional data that isn’t optimized for analytics. At this stage, the choice lies between initiating modeling efforts or selecting from existing models or business intelligence solutions available on a market.
BI4Dynamics Data Warehouse Automation
Data Warehouse Automation is a BI modeling process that automatically creates a Data warehouse without writing a line of code. Using BI4Dynamics templates for D365 F&O, 90% of BI project completion is available on day 1. BI4Dynamics brings a paradigm shift in business intelligence for Microsoft Dynamics.
The model, built on best practices, includes immediately available:
- 52 transactional tables,
- 150 dimensional tables and
- over 3000 immediately available KPIs.
In-house Power BI modeling
Project implementation cycle
Opting for Power BI alone for modeling triggers a project implementation cycle primarily responsive to business demands. This approach may result in unpredictable outcomes and expenses, often costing more than out-of-the-box solutions such as BI4Dynamics, which offer anticipated results from day one.
Resource Intense project
Although Power BI’s functionality improves and becomes more user-friendly, achieving high productivity requires additional skills, experience, and expertise. Incorporating multiple databases, companies, or even different versions of Dynamics introduces an additional layer of complexity to the modeling.
Data validation
BI4Dynamics automates data validation processes and flags any discrepancies in the data. With in-house modeling, data validation must be done with each major project update to ensure matching the data between BI and ERP systems. It’s challenging to create a matching model that covers all specifics as non-item sales, charges, multiple discount types, cost posting in sales, etc. If data doesn’t match, people might lose trust in the system and stop using it.
Unlock Hidden Profits in Your Dynamics Data
Empower Your Team with Self-Service BI
Self-Service BI: Effortless Changes Without Programming Skills
Empower everyone in your organization to make BI changes with minimal training. Our wizard-driven customizations guide you through a seamless five-step process, bringing your BI vision to life.
Powered by Metadata: We Know Every Detail of Your Dynamics
BI4Dynamics connects to Microsoft Dynamics, utilizing detailed AOT/Object Metadata including tables, columns, table relations, and enums, ensuring precise and adaptable BI customizations.
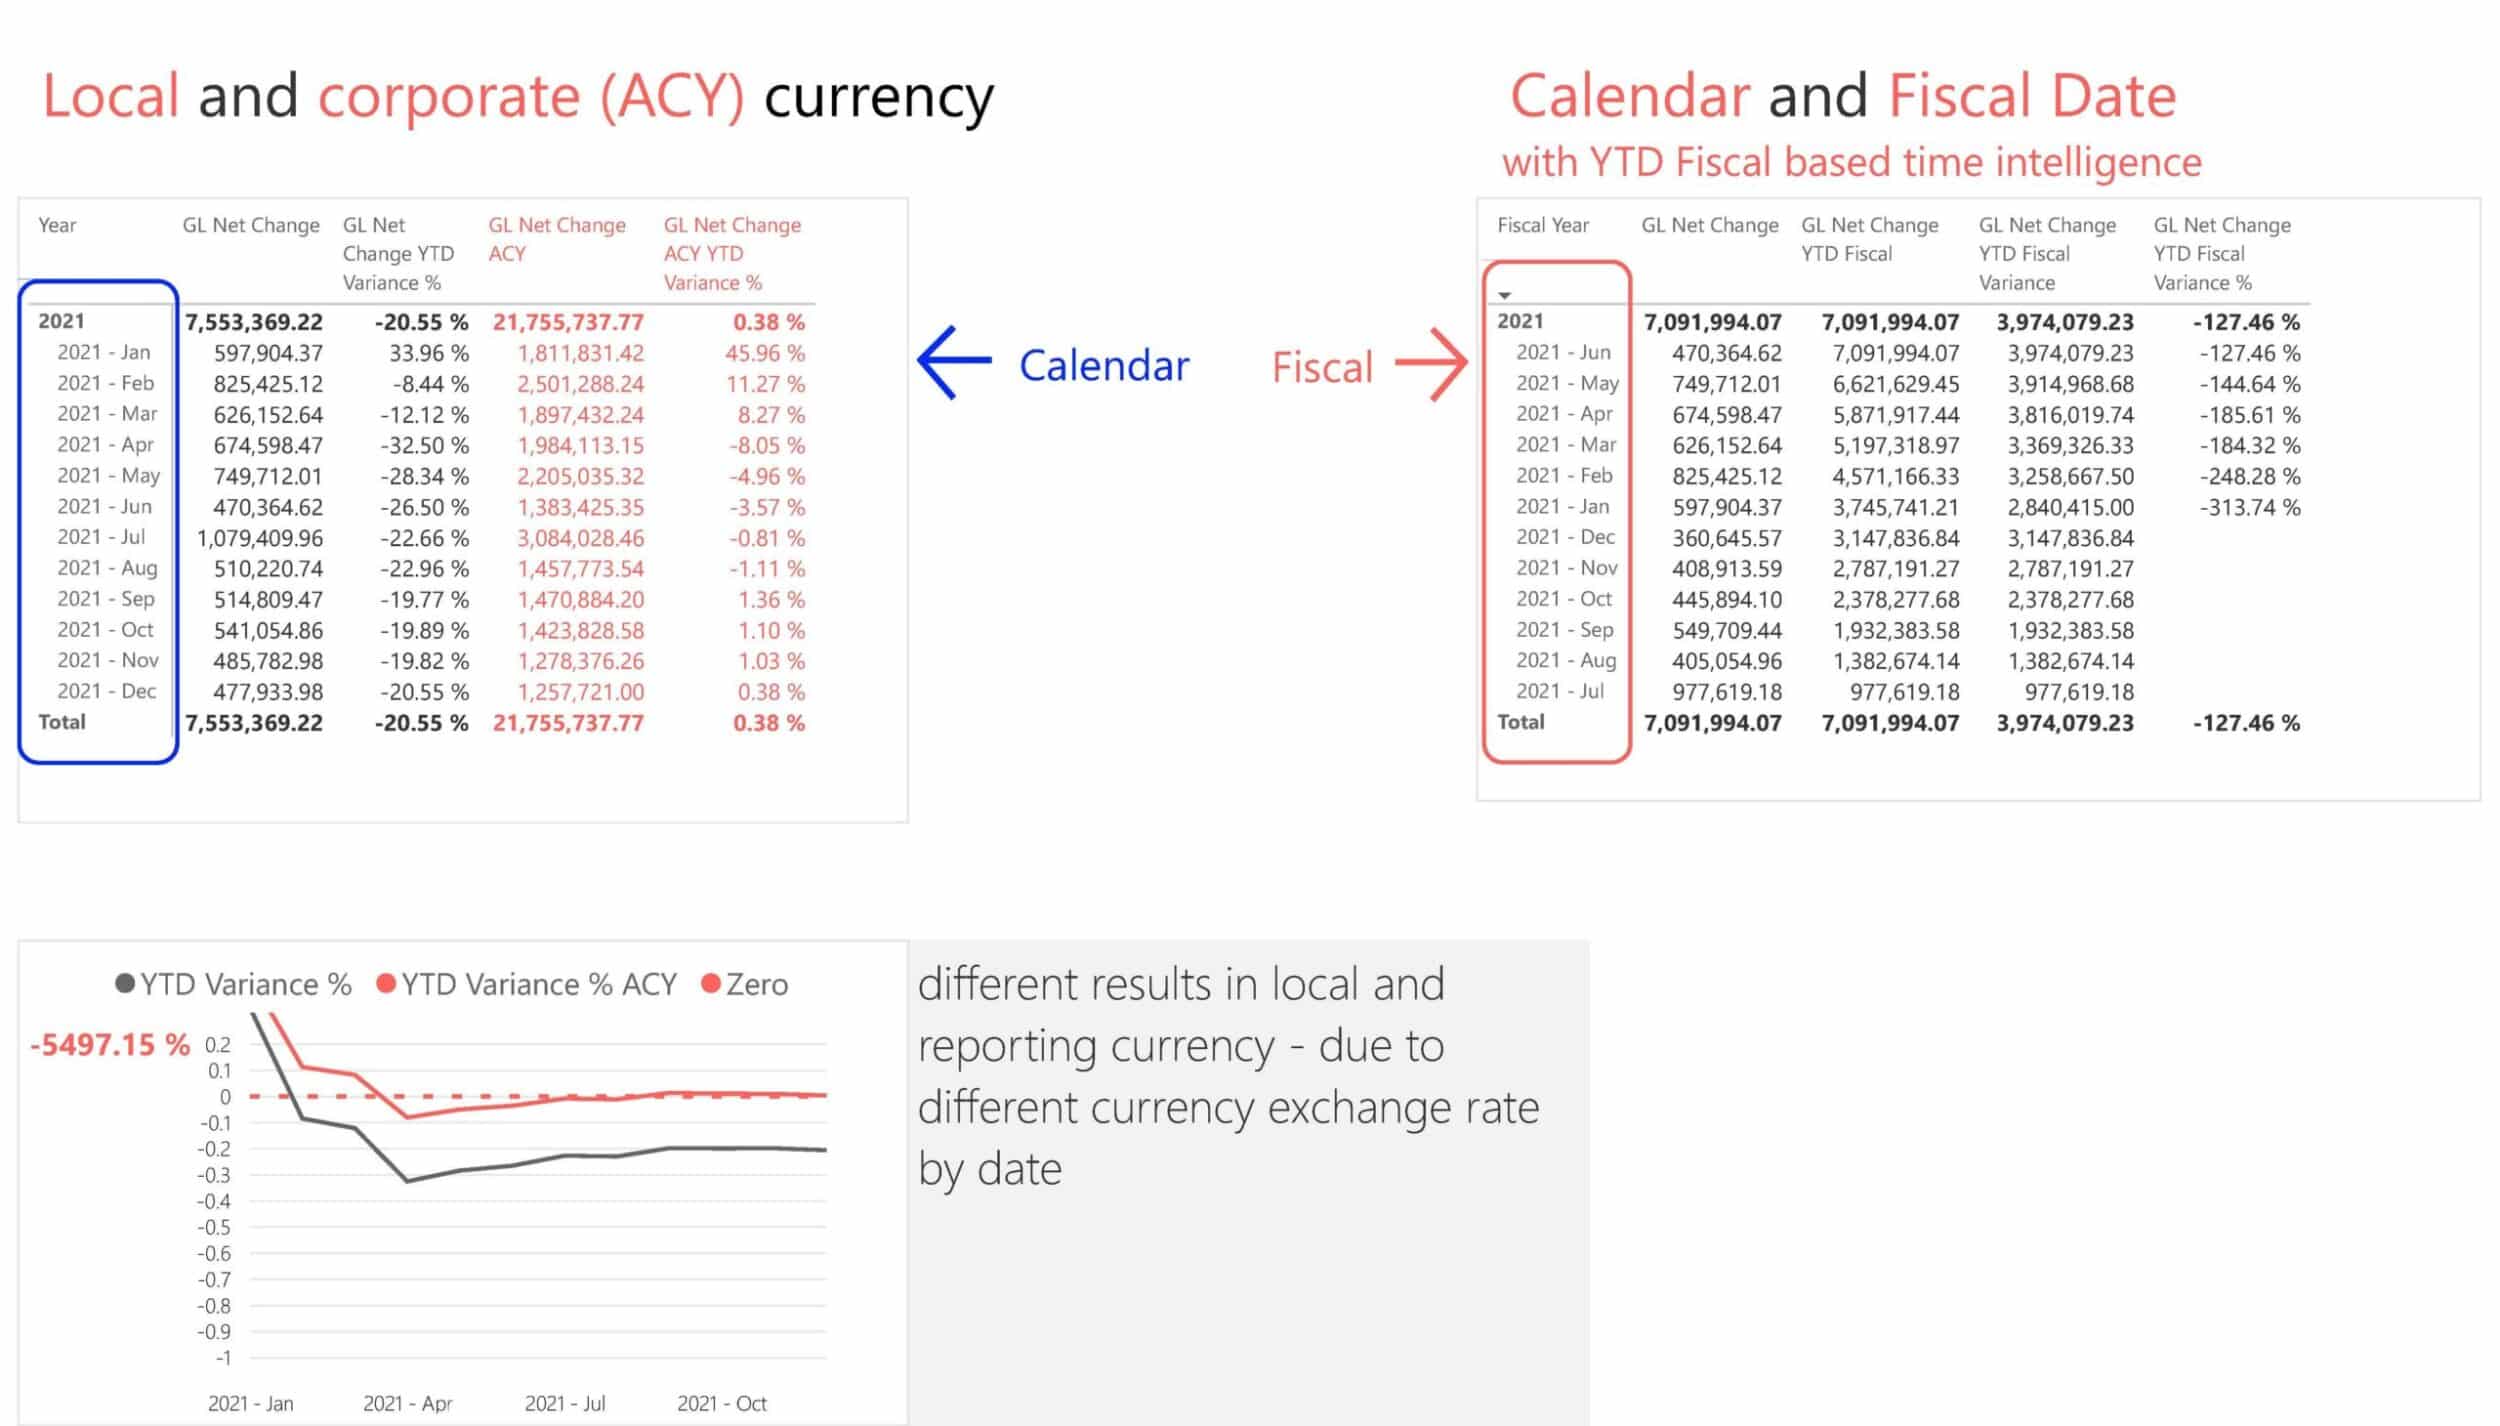
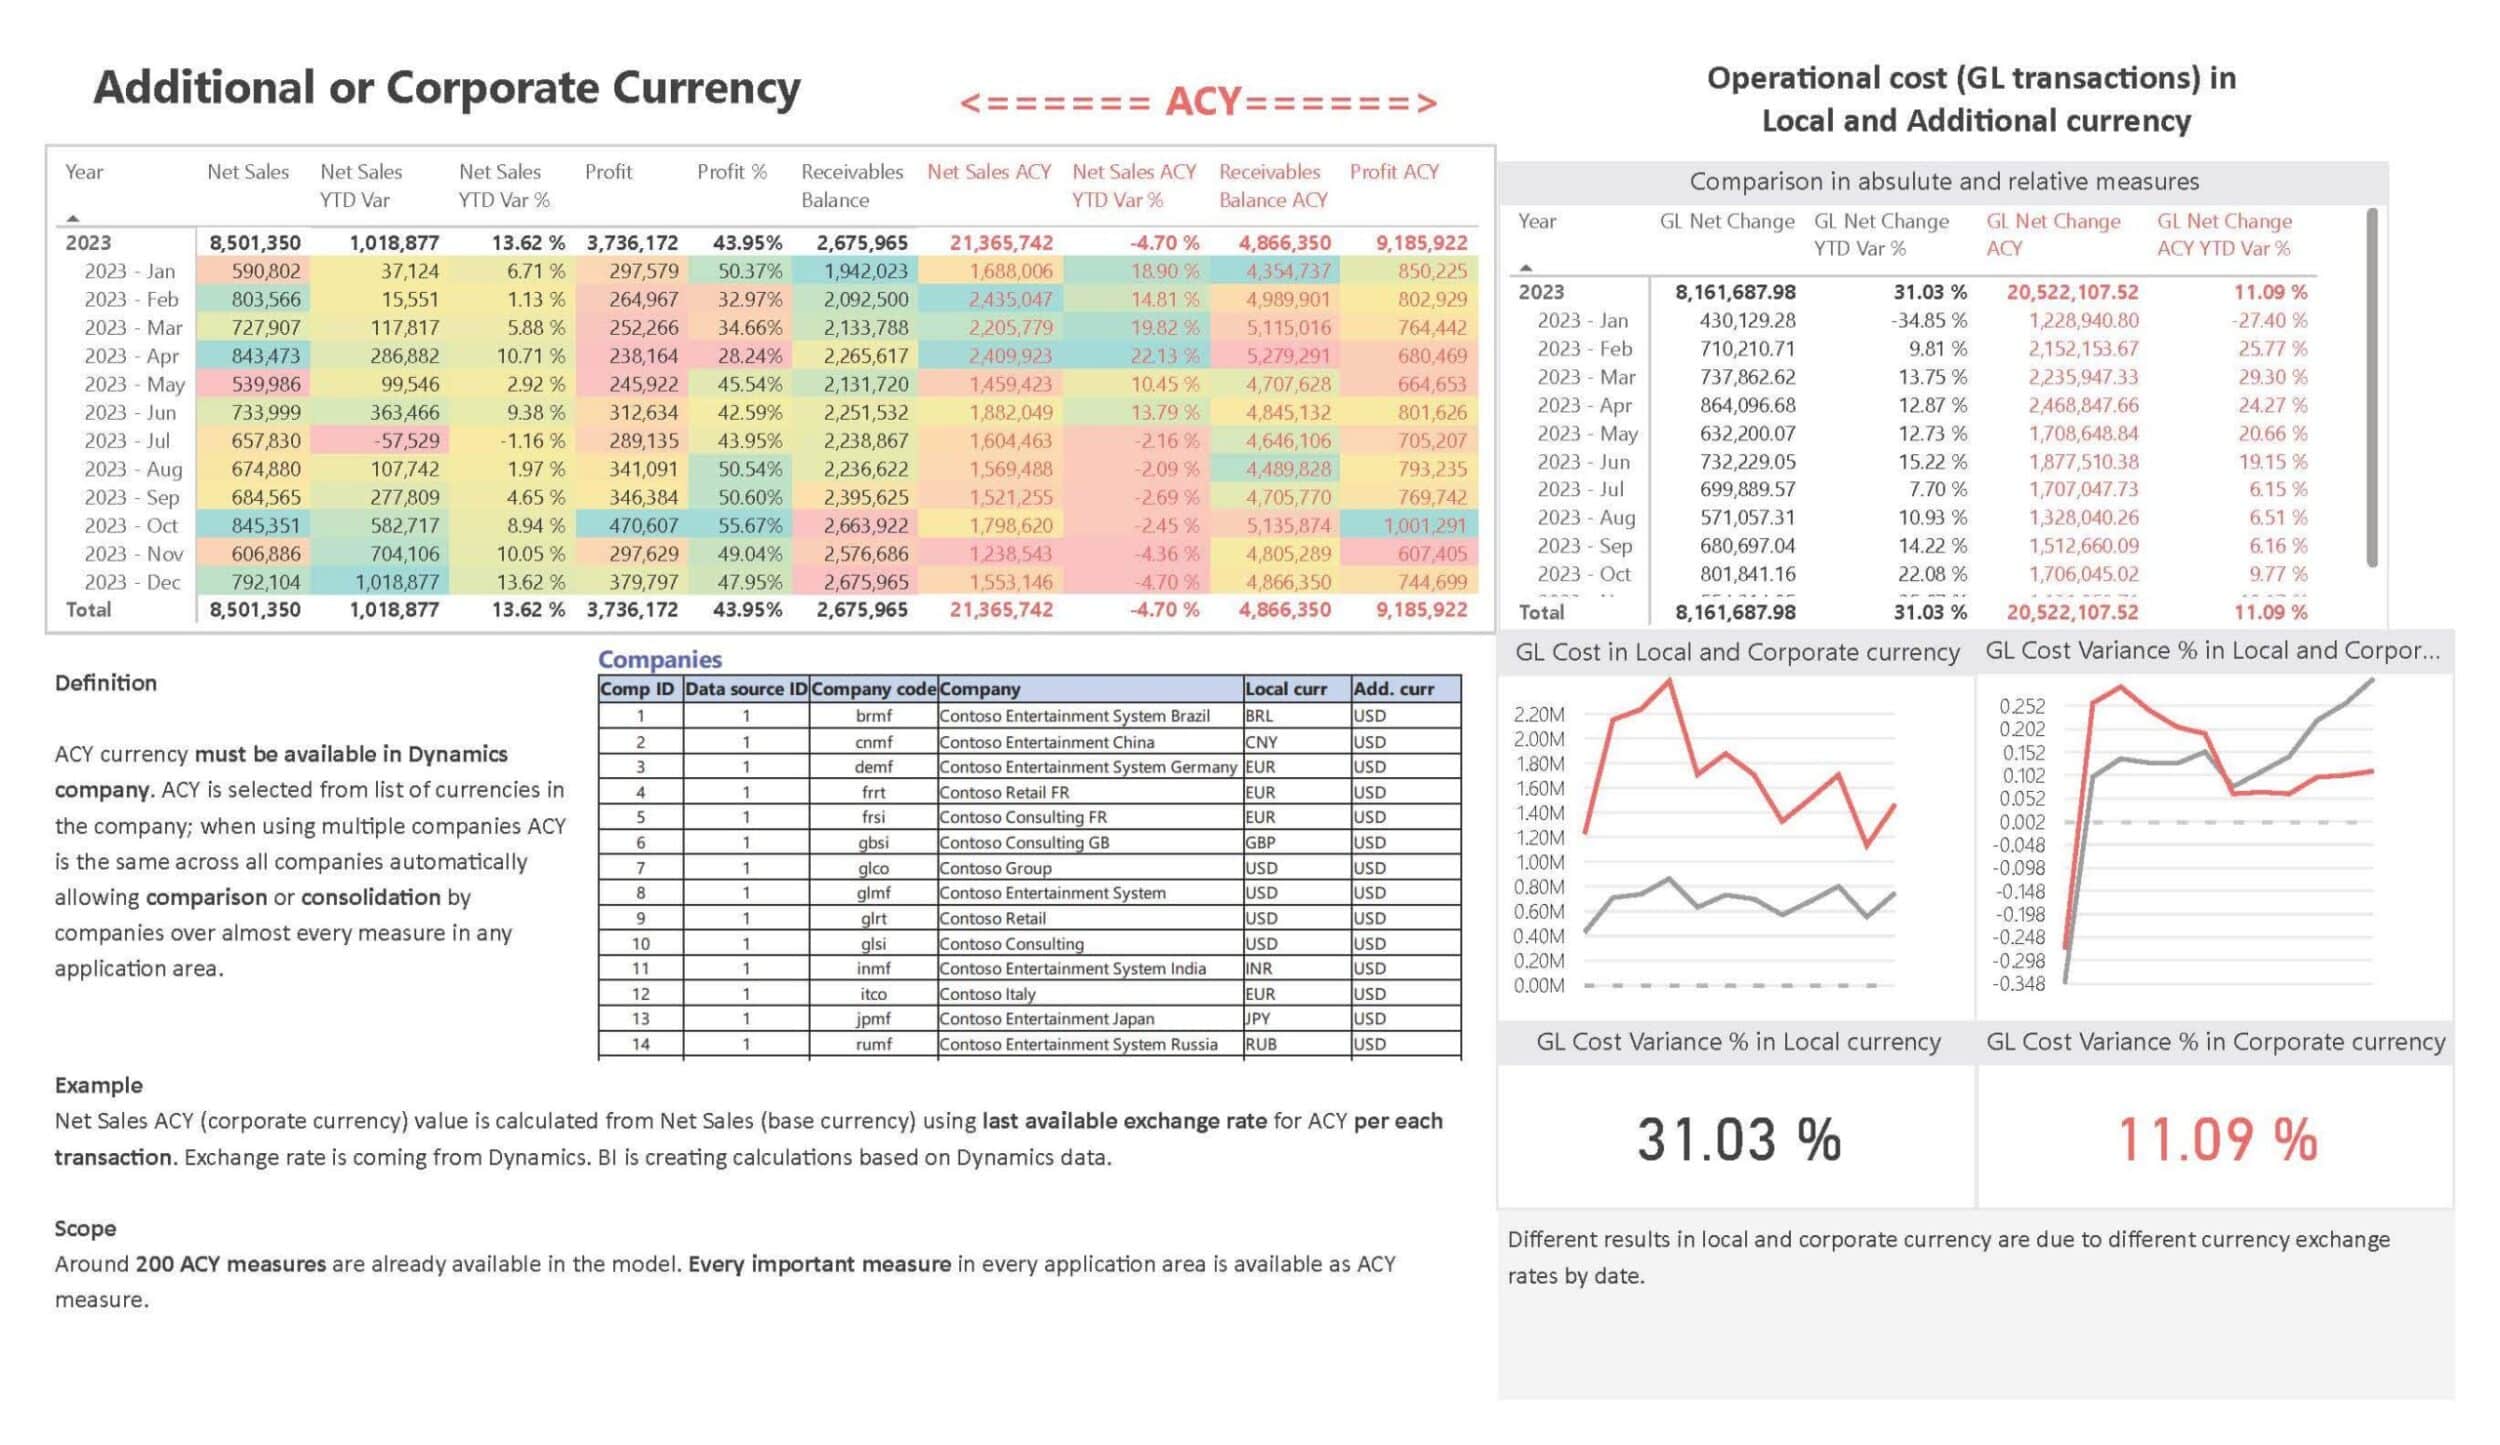
Support of local and corporate currency in the same application
It caters to the needs of global businesses, providing the ability to consolidate data across all legal entities and financial dimensions available in Dynamics. Whether it’s calendar date or fiscal date, BI4Dynamics has got you covered.
Seamless Integration with Power BI
Combine the flexibility of Power BI with the scalability of SQL, tailored to your specific needs.
Bring Any Dynamics Field Faster Than Ever Without Coding
Customize and integrate external data sources in just a few clicks, simplifying complex tasks and focusing on valuable insights for informed decision-making.
Secure Cloud-Based BI Solutions
Leveraging the Microsoft Azure platform for cloud security and scalability, our solution ensures your data is protected and complies with global standards.
Learn more about how Azure guarantees security for BI and ERP systems by visiting Azure Cloud Security.
Measure the ROI of Your BI Investment
For organizations assessing BI investments, Forrester’s Total Economic Impact (TEI) Studies provide insights into ROI from BI solutions.
Explore Forrester TEI Studies to see how BI4Dynamics can drive financial benefits.
Elevate Your BI Maturity
Organizations that are early in their BI journey can benefit from understanding the stages of BI maturity. Our BI4Dynamics solution helps companies progress through these stages by offering a scalable, robust solution.
Learn more about BI maturity models to assess your organization’s BI readiness.
Harness the Power of Business Intelligence for Dynamics 365 F&O
BI4Dynamics integrates seamlessly with Microsoft Dynamics 365 for Finance and Operations, enabling real-time insights. With Power BI, your team can visualize and analyze data effectively.
Learn more about Power BI best practices to enhance your reporting.