Skip to content
 Retail Dashboard
for Microsoft Dynamics
Our Retail Dashboard provides comprehensive analytics to help you understand your sales performance, optimize operations, and enhance the customer experience.
Gain Full Control of Your Retail
Real-Time Sales Insights: Monitor sales performance across stores, time periods, and product categories.
Optimized Store Operations: Identify top-performing locations and staff to streamline operations.
Enhanced Inventory Management: Understand product trends to optimize stock levels and reduce costs.
Improved Customer Experience: Analyze purchasing patterns to tailor promotions and increase satisfaction.
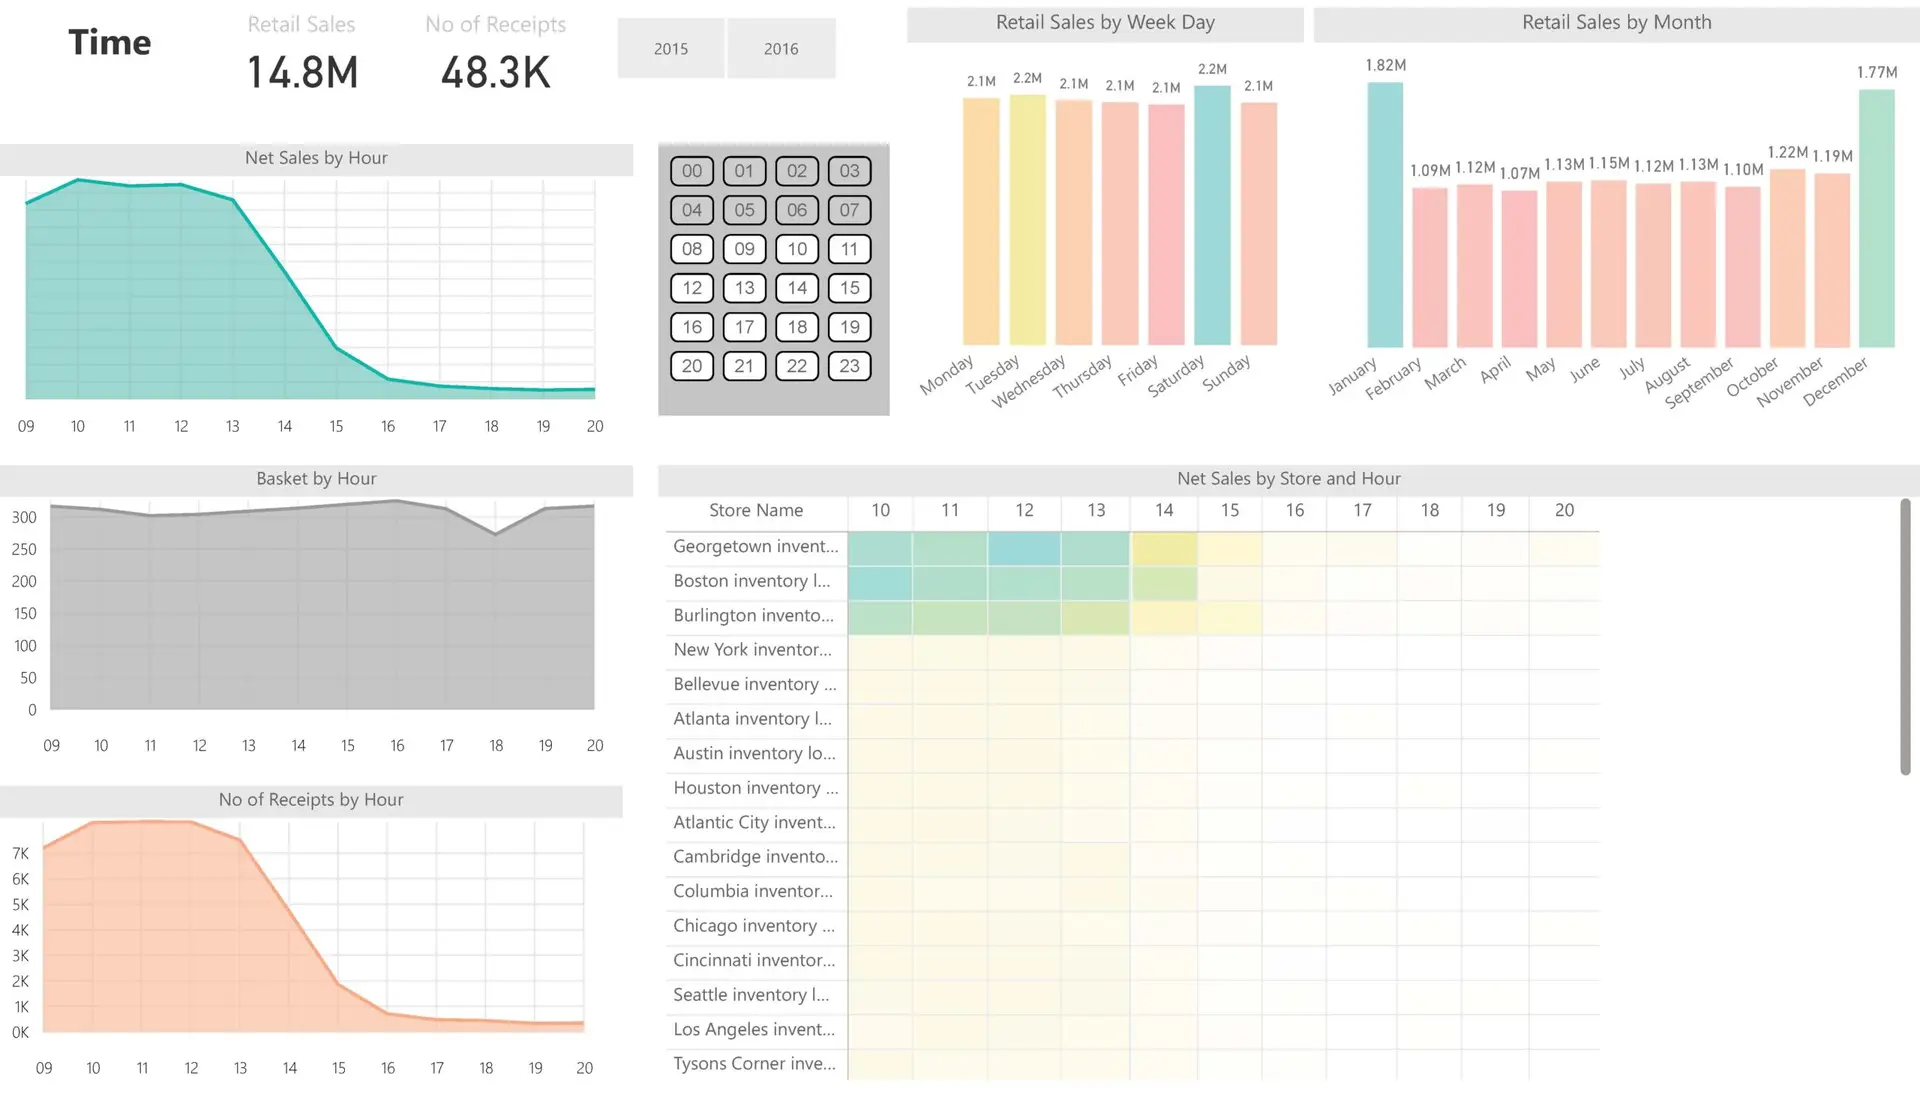
Sales Performance Over Time
Understand Peak Sales Periods
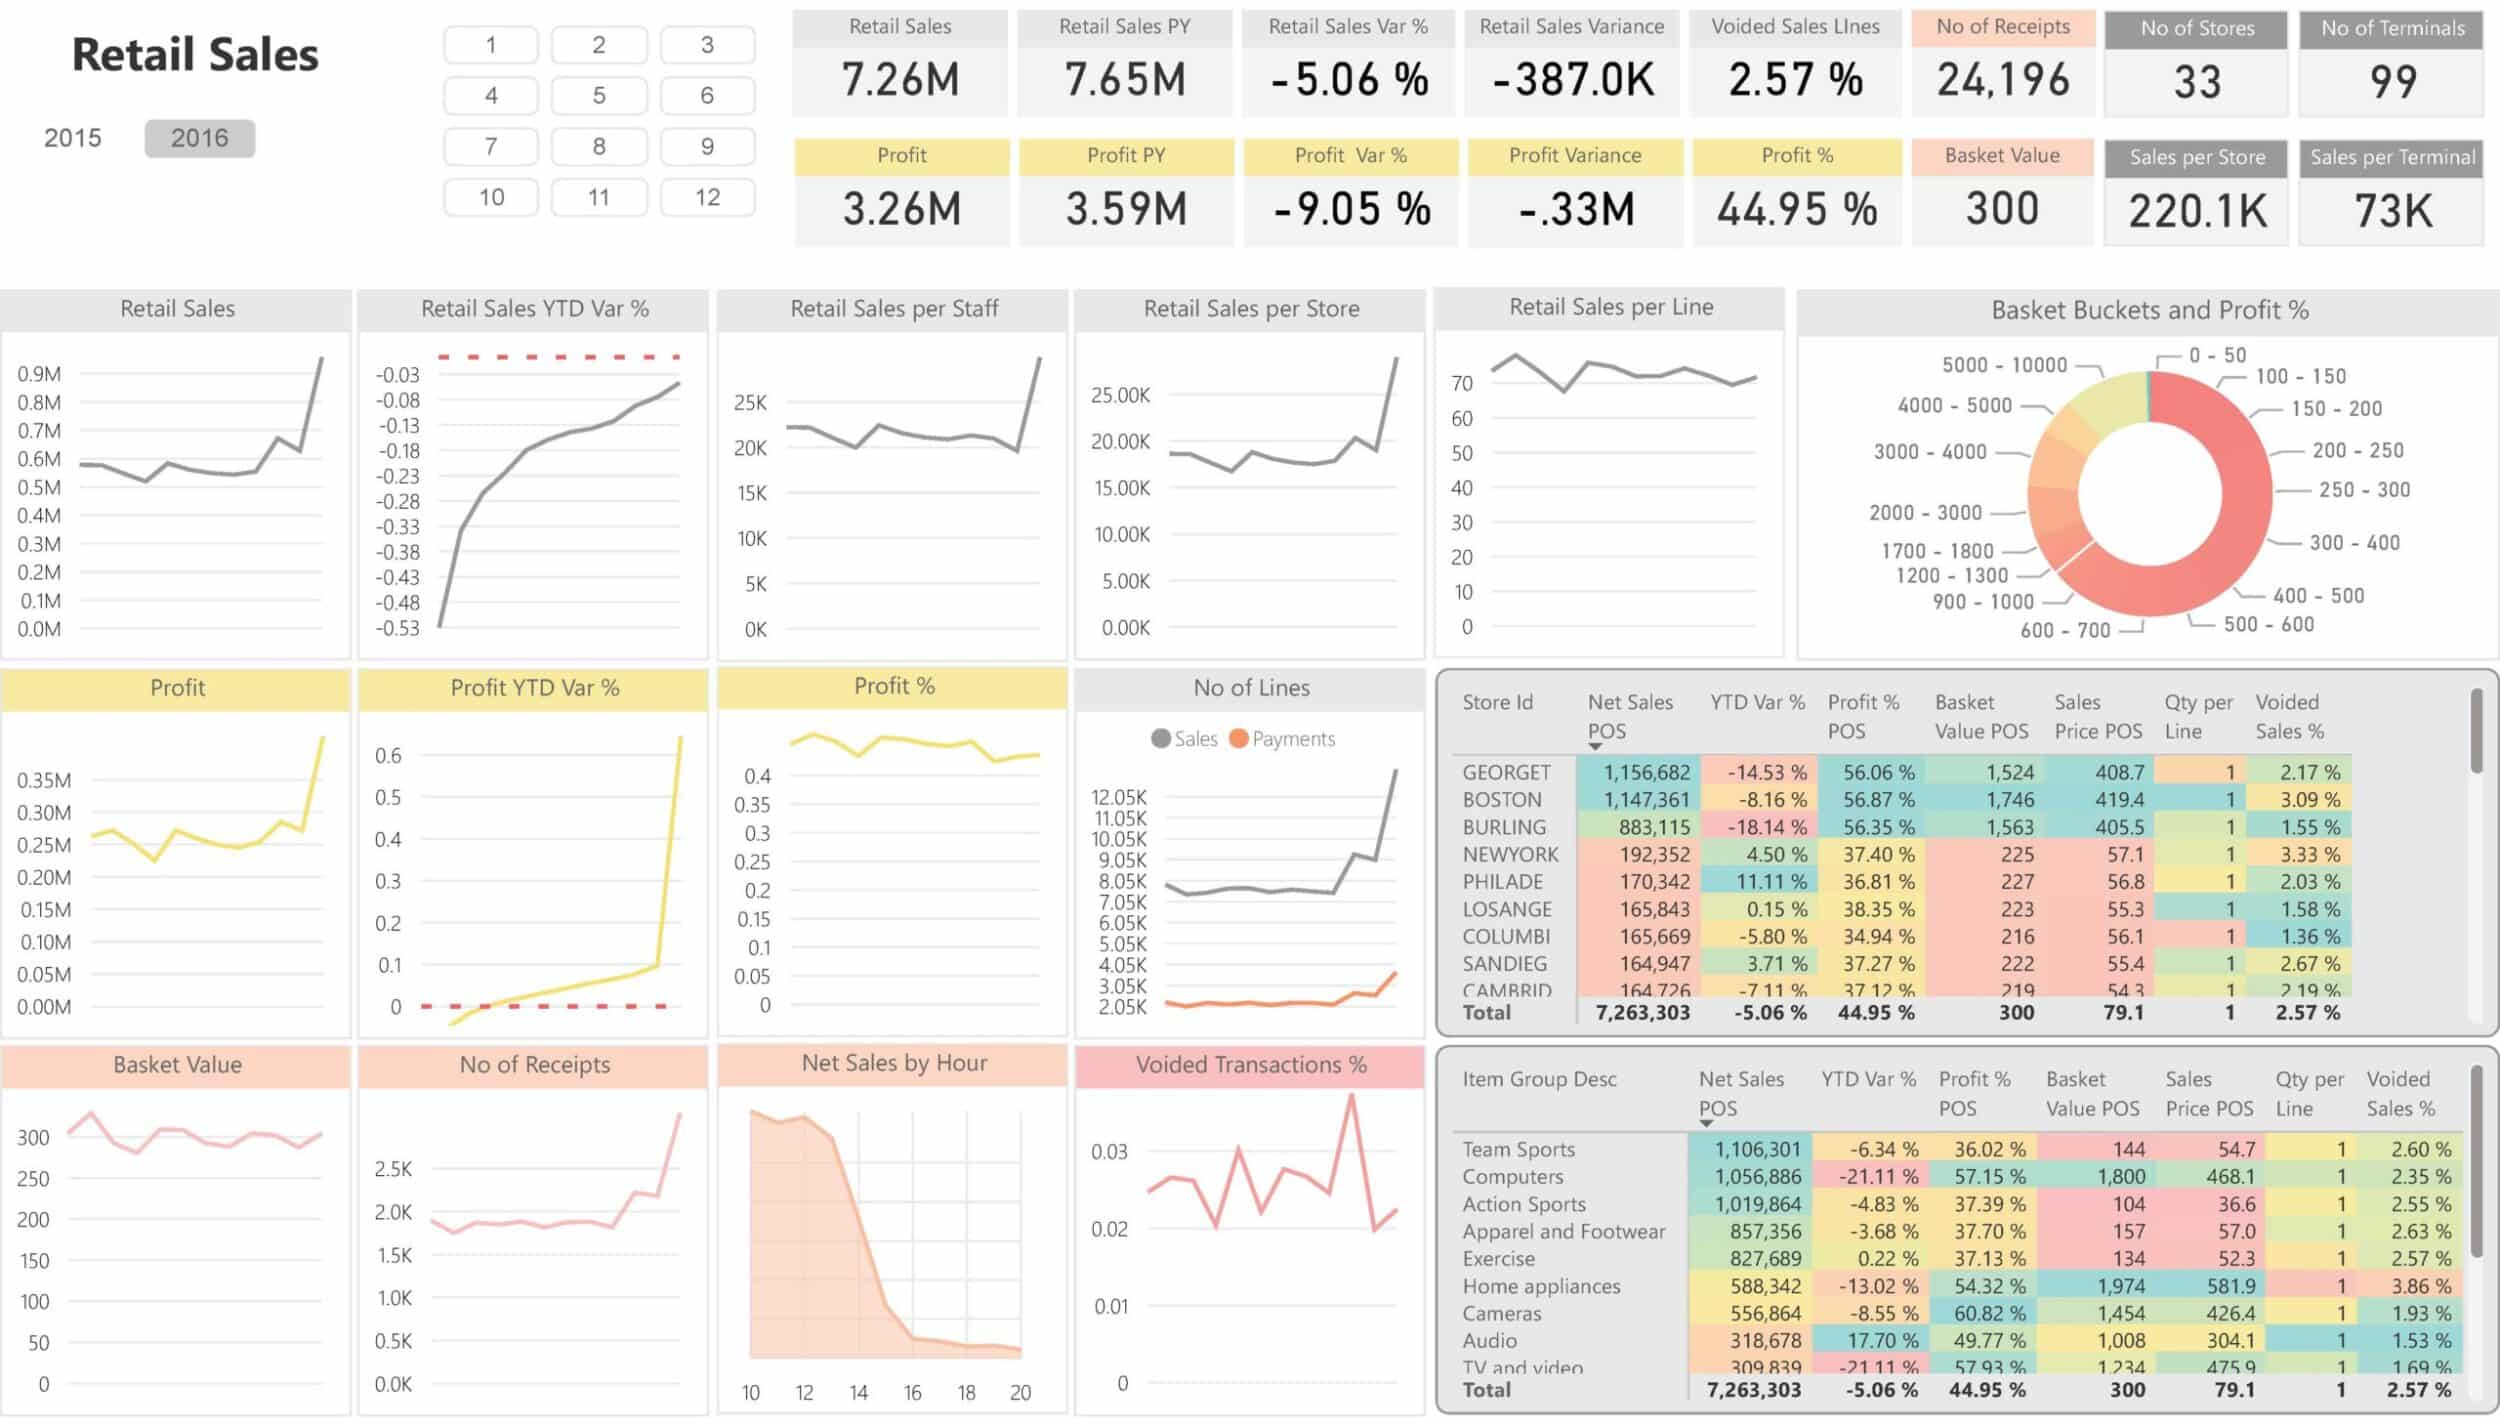
- Hourly Sales Distribution: Identify peak sales hours to optimize staffing and operations. Most sales occur between 10 AM and 3 PM, with slightly higher sales on Sundays.
Monitor Daily Performance
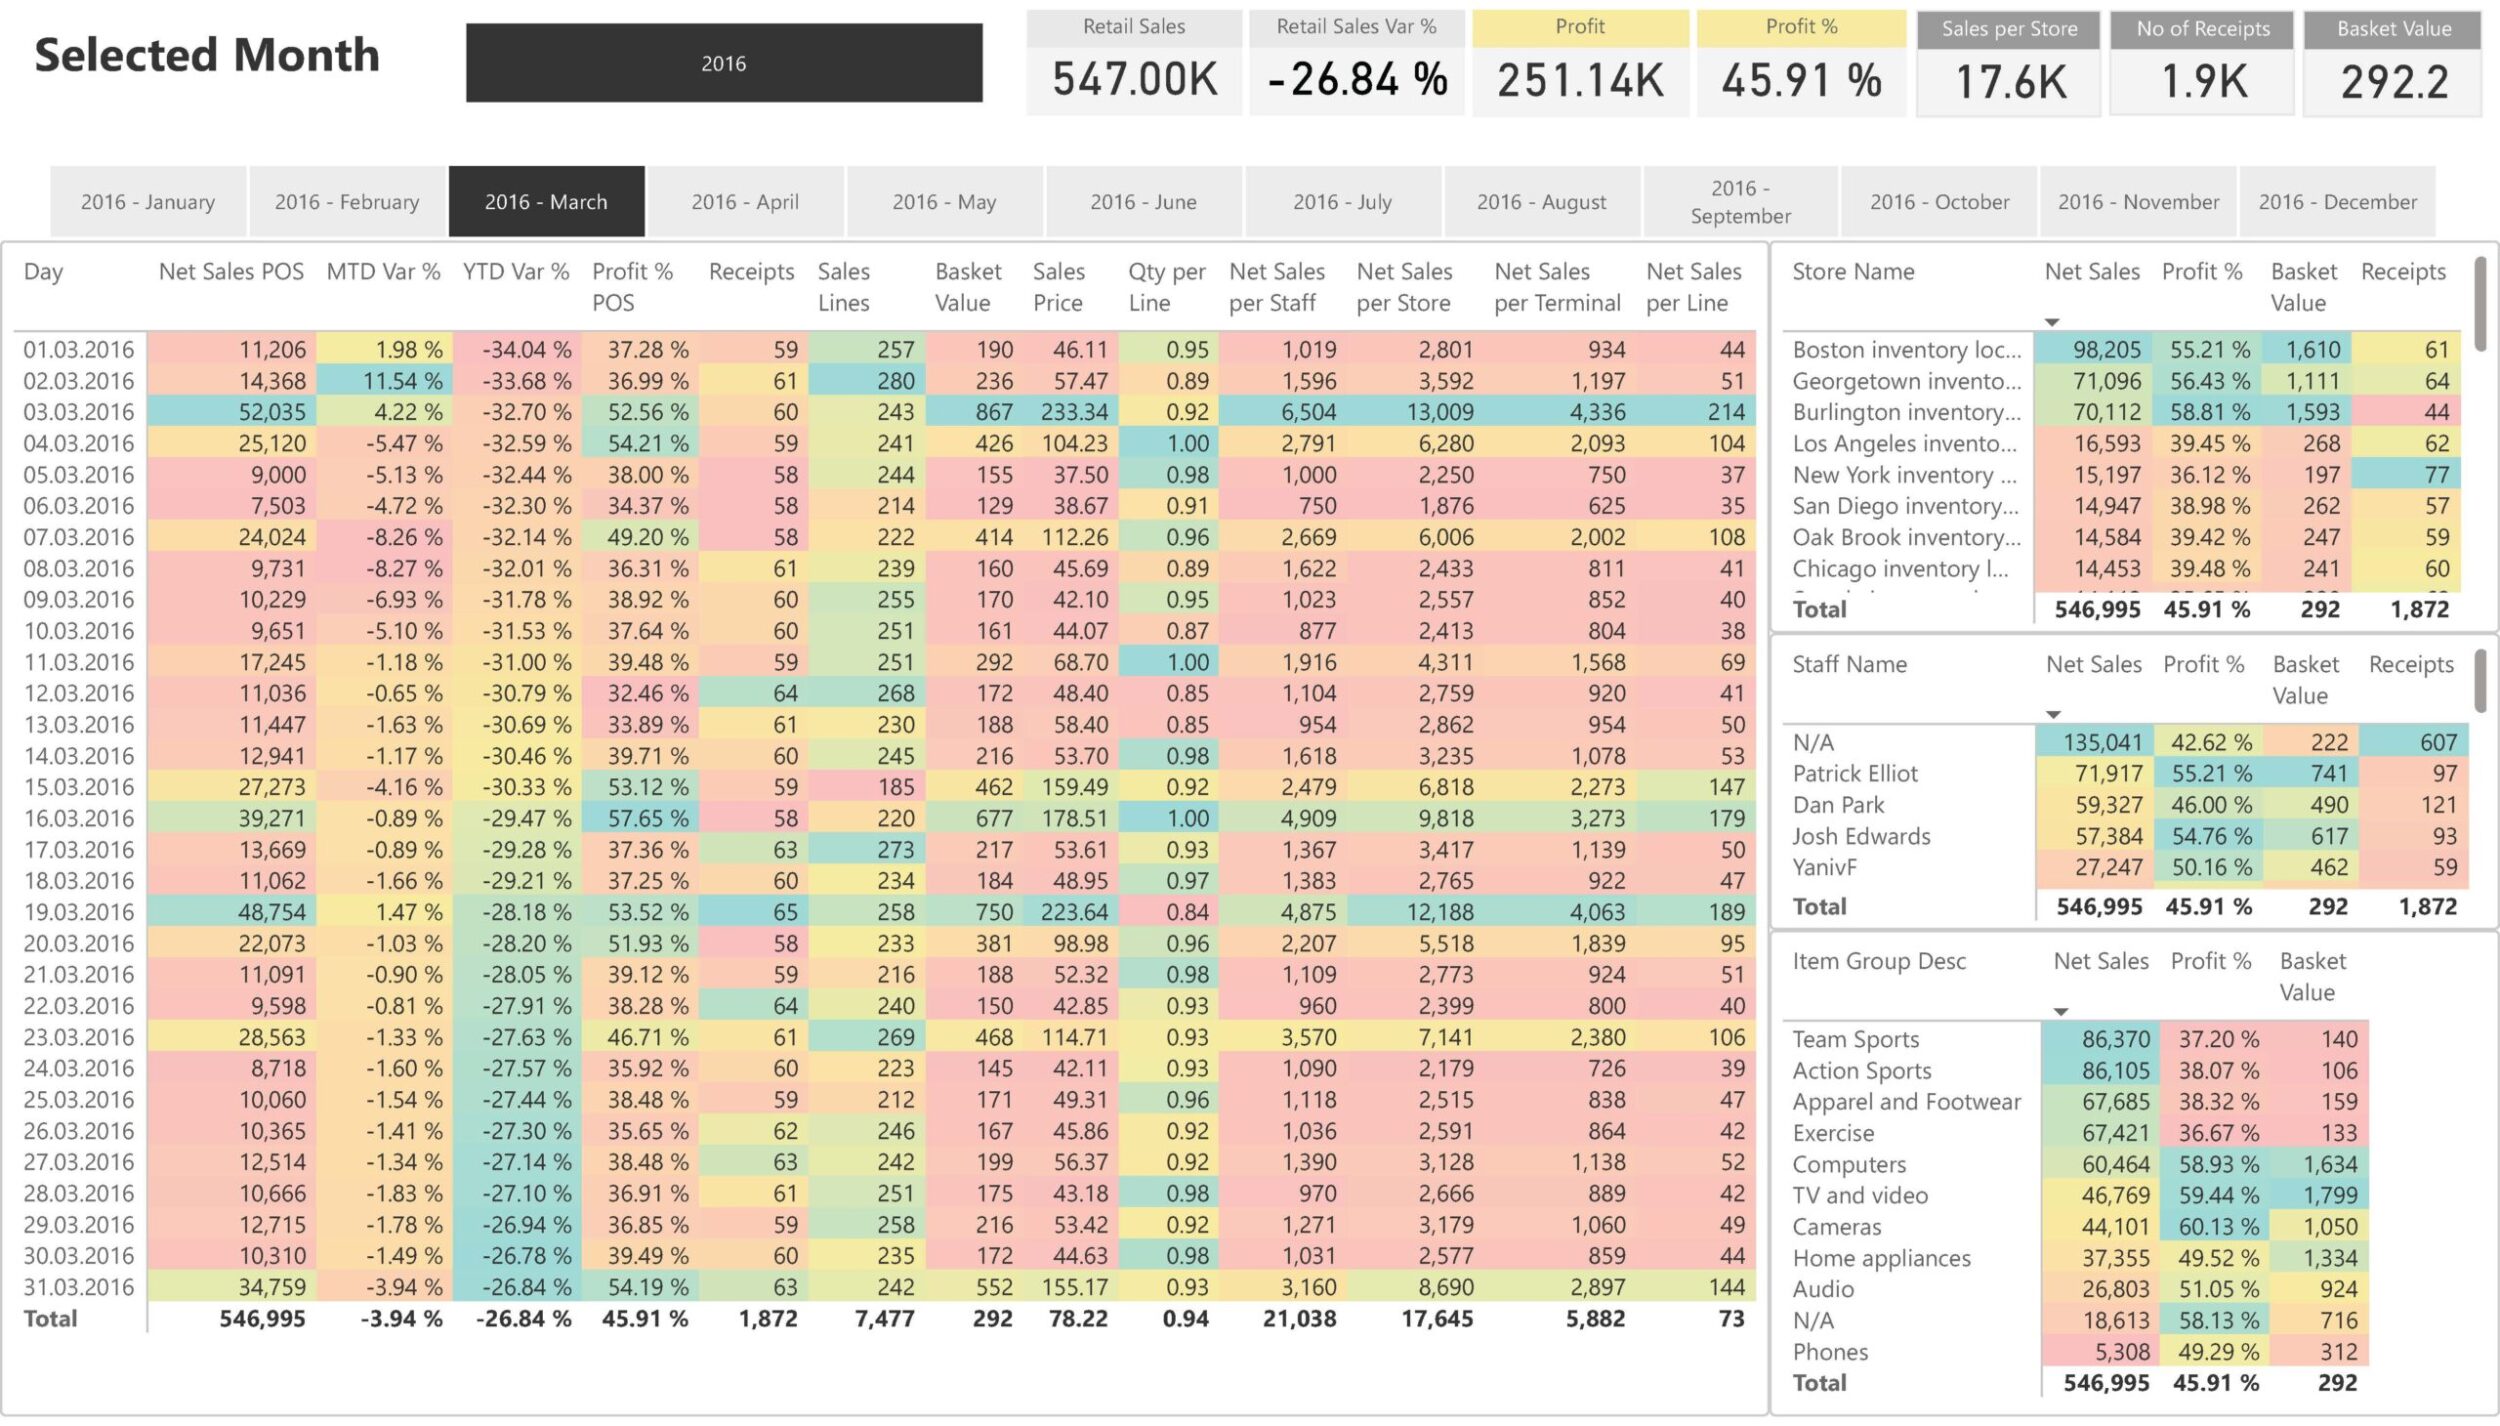
- Daily Sales Performance Detail: Track daily net sales, profit percentages, number of receipts, and basket values. Analyze variances to understand daily fluctuations and trends.
Comprehensive Monthly Overview
- Current Month Analysis: Gain a complete view of the current month’s sales, including total sales, profit margins, basket values, and key KPIs. Compare year-to-date (YTD) sales to assess performance trends.
Benefits:
- Optimize staffing schedules based on peak hours.
- Quickly identify and address daily sales trends.
- Make informed decisions with up-to-date monthly data.
- Image: Hourly Sales Distribution Dashboard
Store and Staff Performance
Evaluate Store Performance
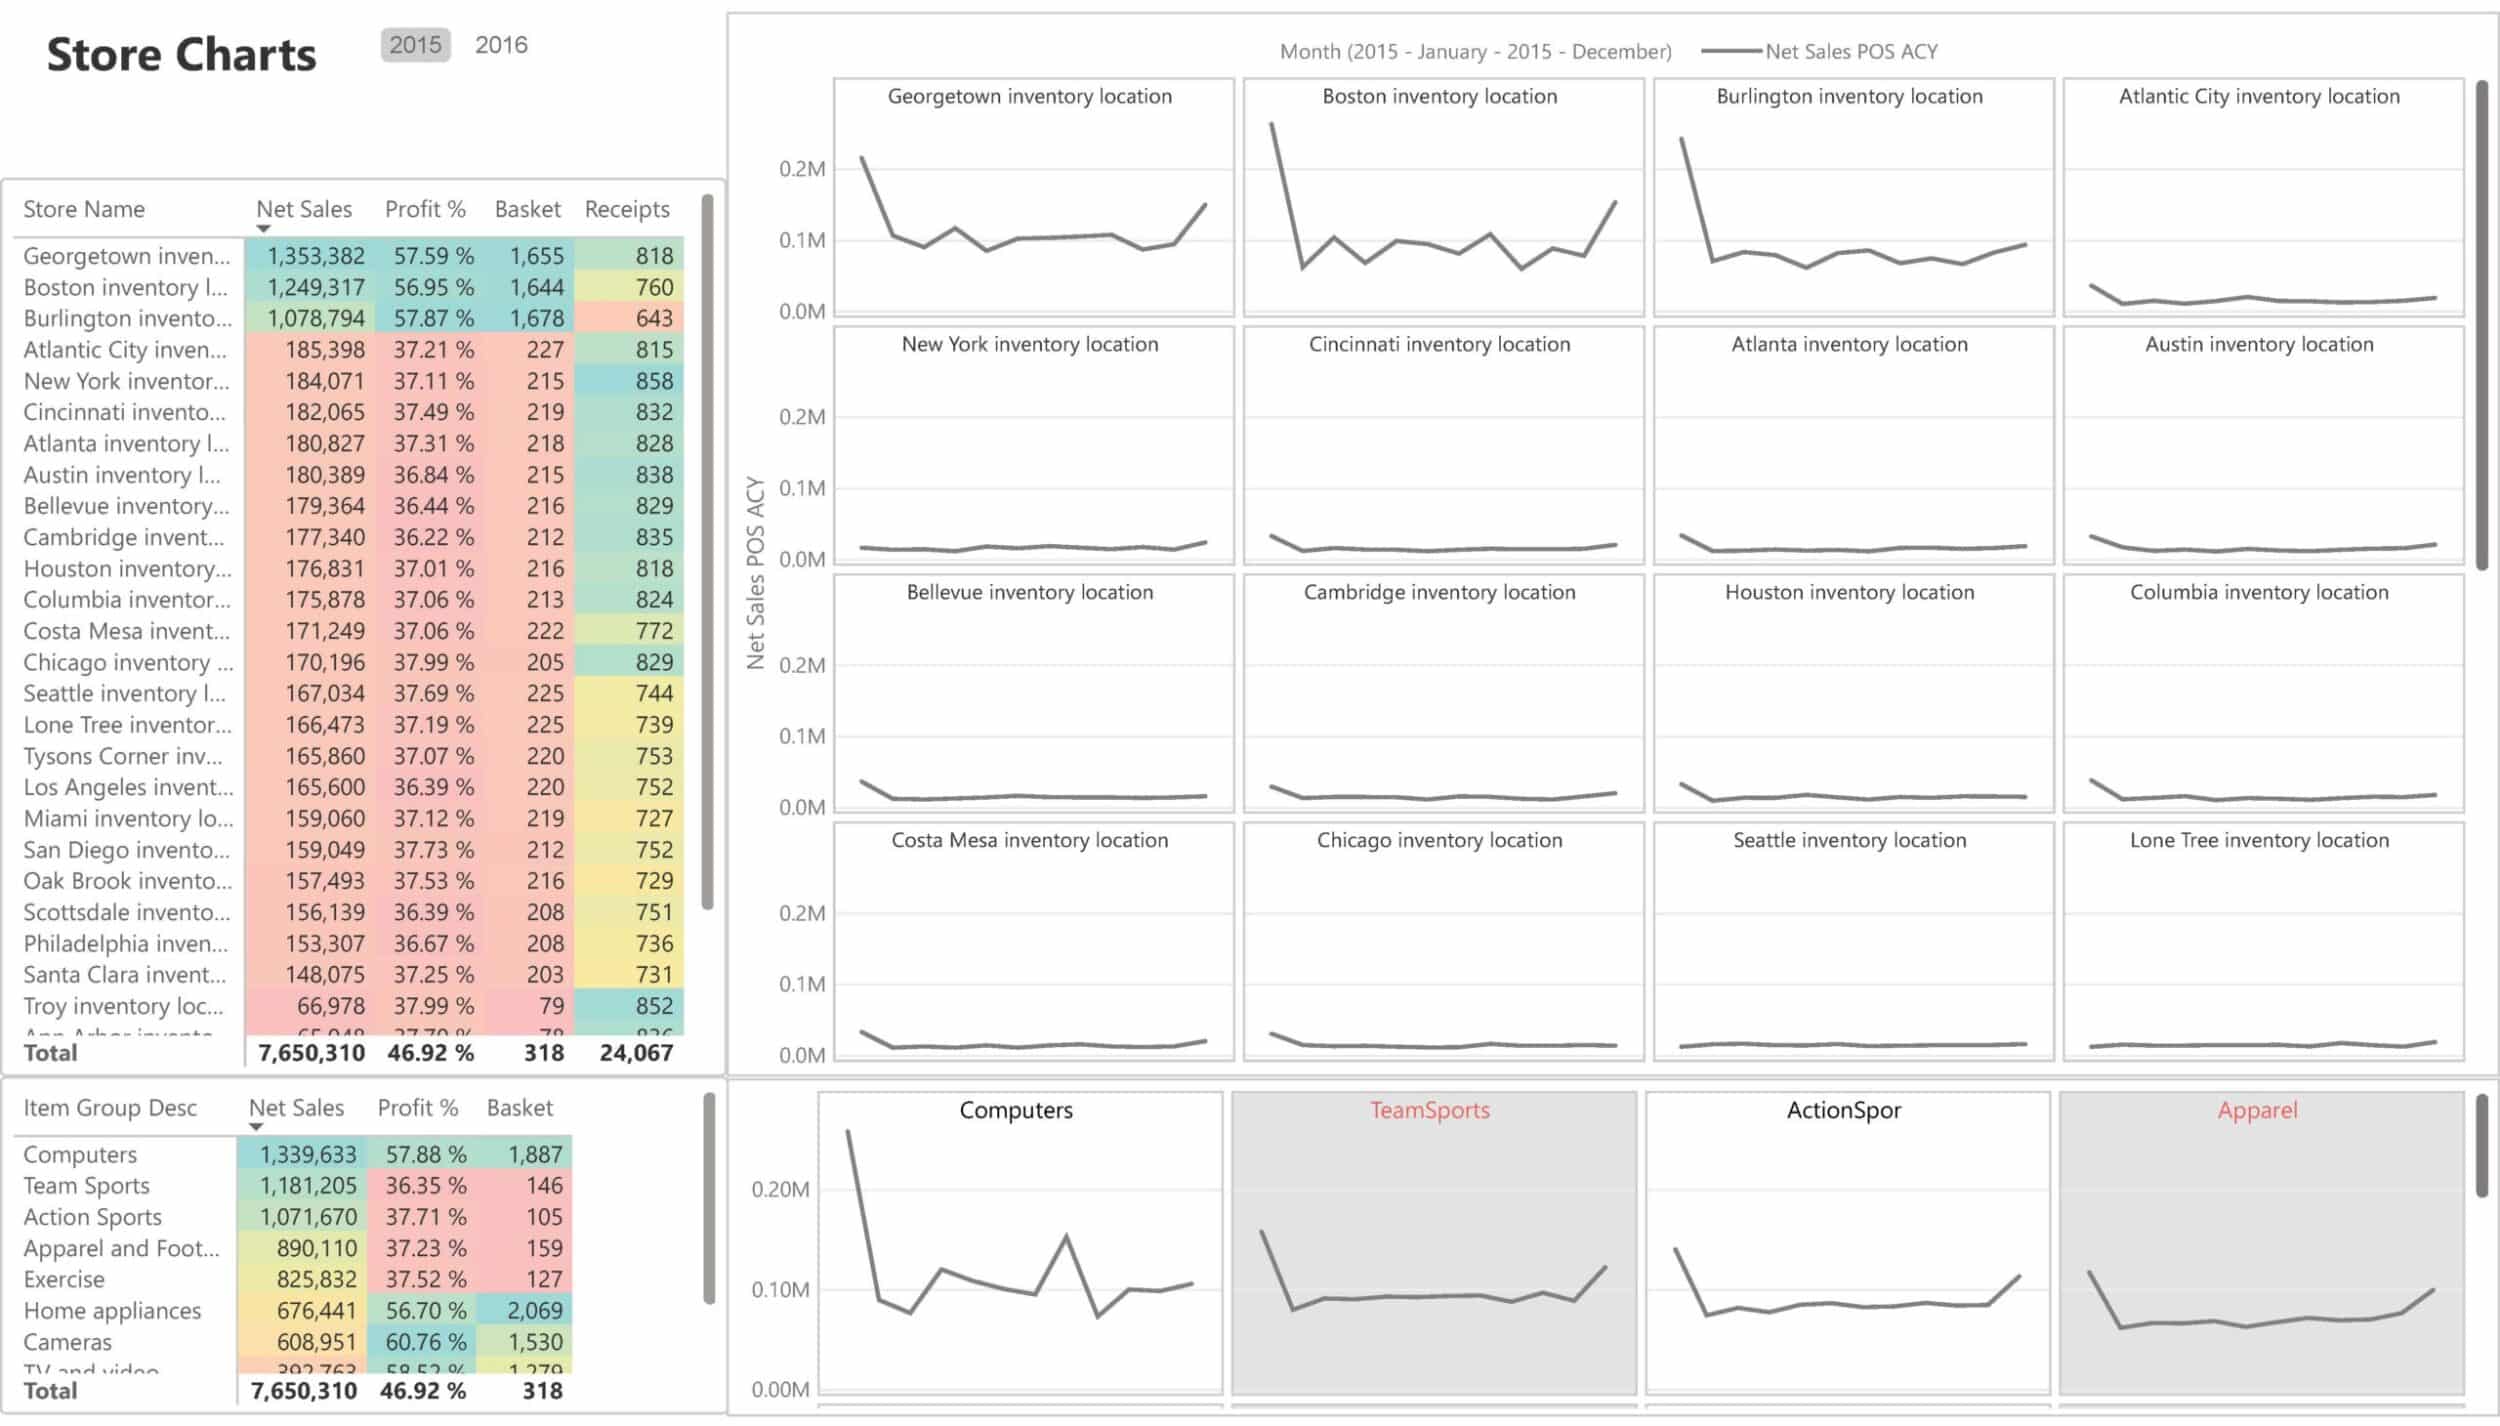
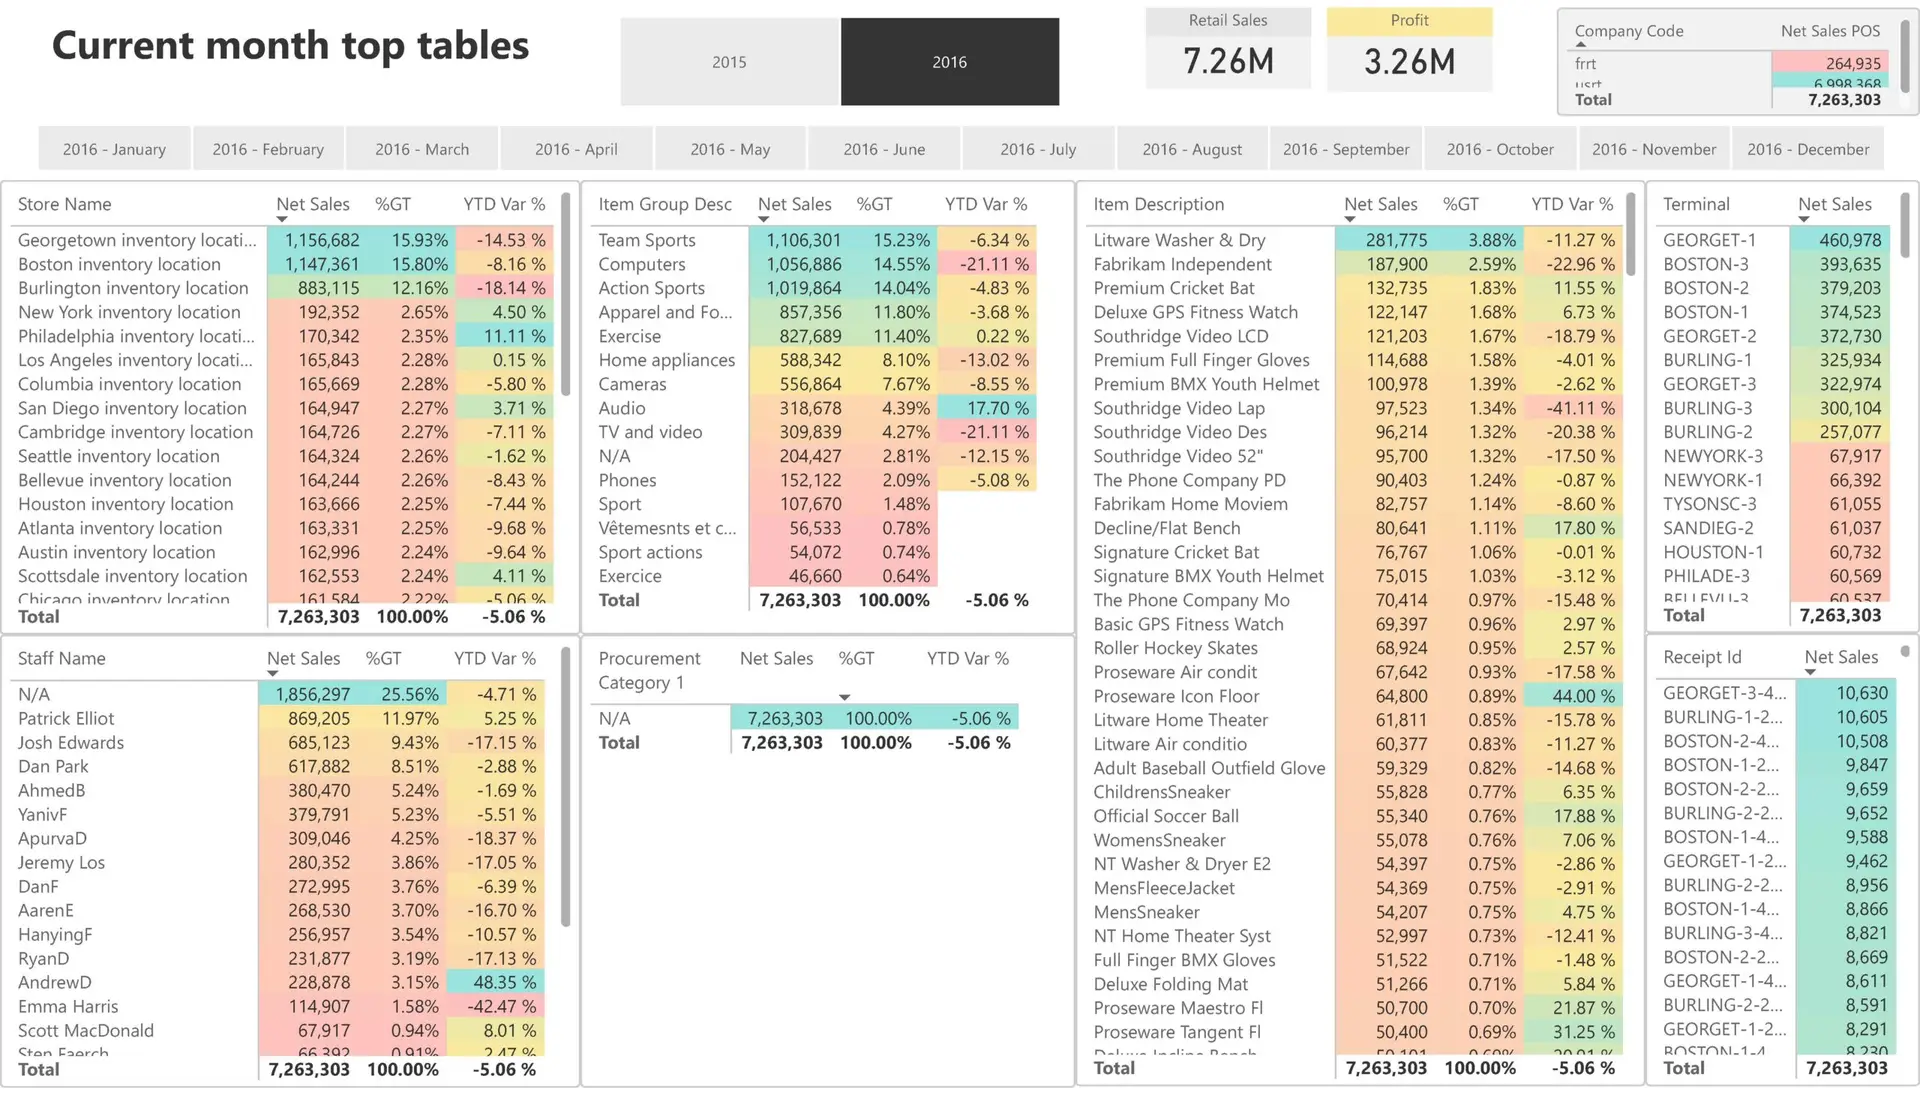
- Store-wise Performance Overview: Analyze net sales, profit margins, basket sizes, and receipts by store location. Identify top-performing stores and areas needing improvement.
Assess Staff Contributions
- Monthly Top Performers: Review sales per staff member to understand individual contributions. Recognize and reward high-performing employees to boost morale and productivity.
Product Category Insights
- Item Group Performance: Identify which product categories drive sales and profit, such as computers, sports equipment, and apparel.
Benefits:
- Optimize operations by focusing on high-performing stores and staff.
- Improve employee performance through targeted training and incentives.
- Align inventory and promotions with top-selling product categories.
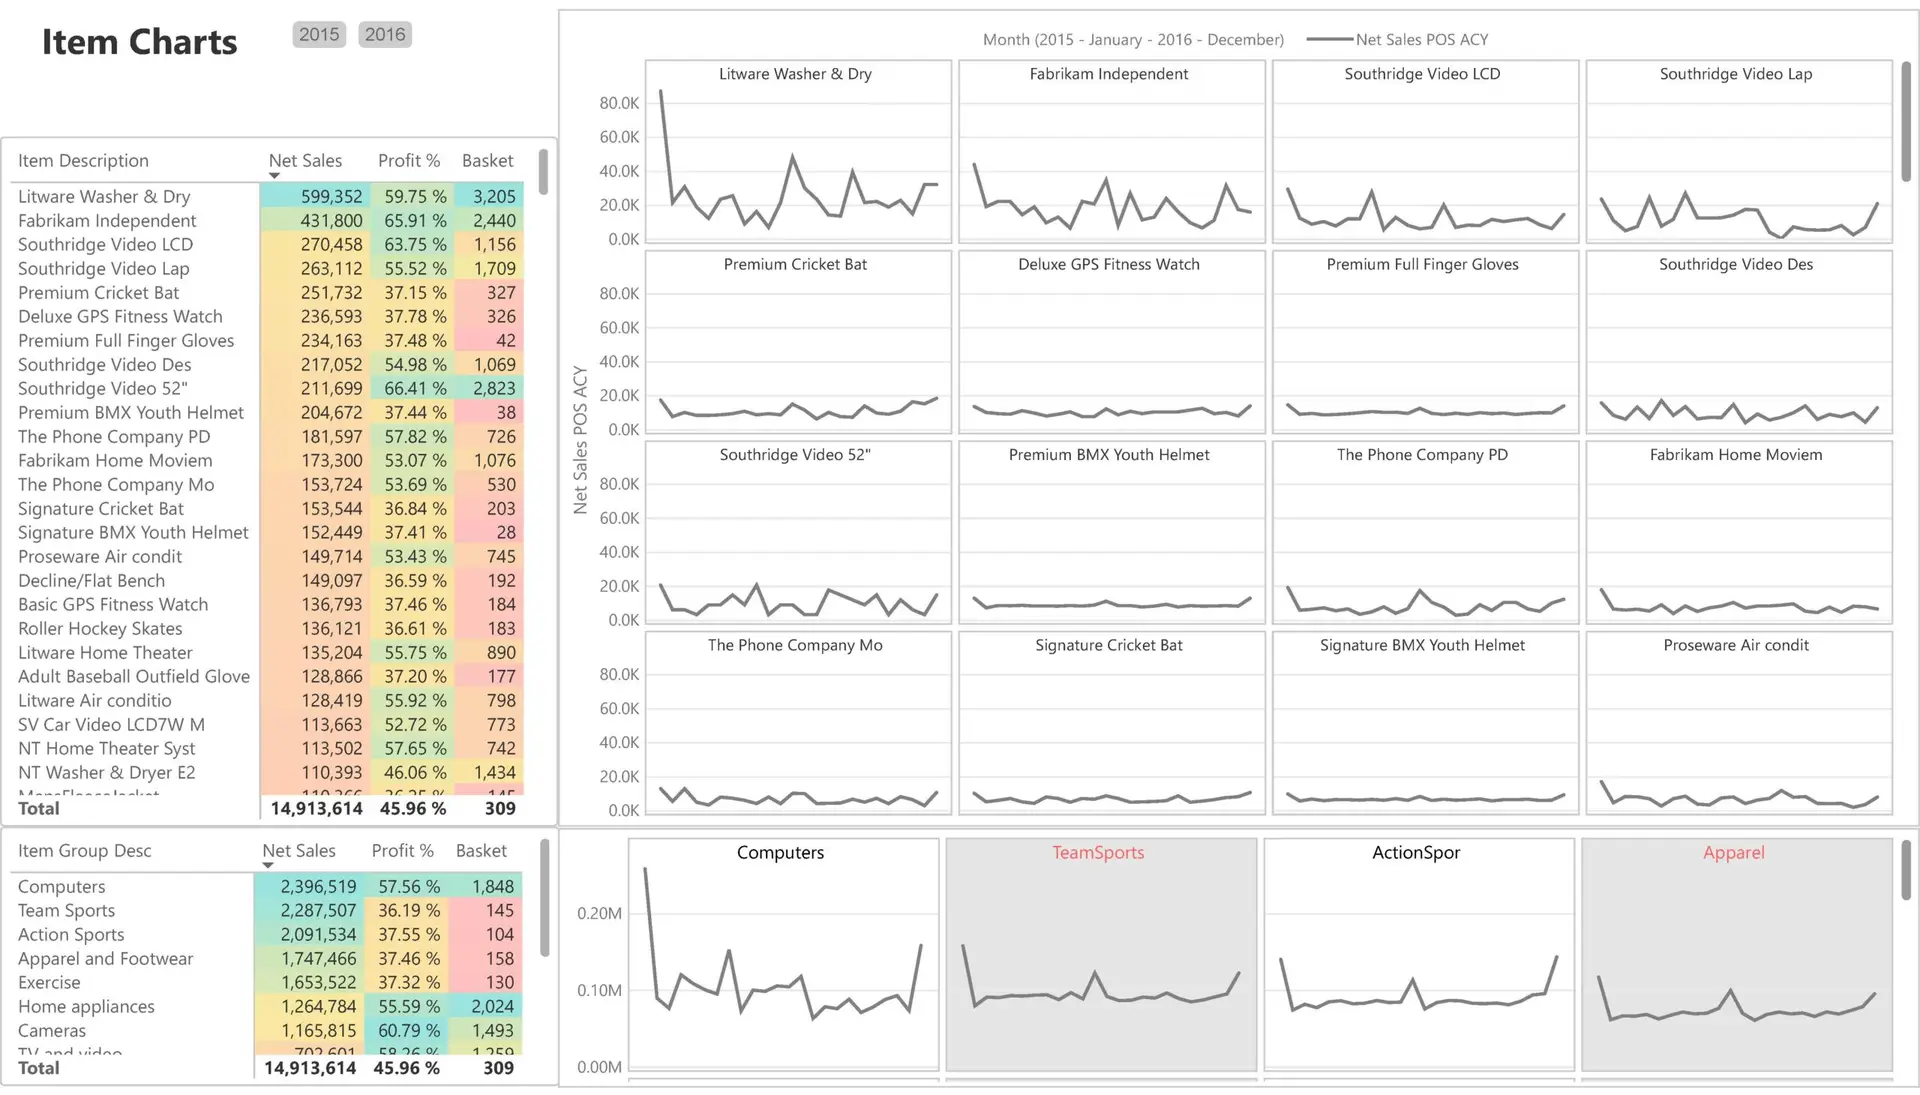
Product Performance Analysis
Insights:
-
Track Product Trends
- Yearly Performance by Item Category: Analyze sales performance over the year for different product categories. Identify seasonality and trends to plan inventory and promotions effectively.
-
Optimize Inventory Management
- Understand monthly trends of individual items to prevent stockouts or overstocking, ensuring popular items are always available.
Benefits:
- Make data-driven decisions on product ordering and merchandising.
- Enhance customer satisfaction by maintaining optimal stock levels.
Comprehensive Retail Analytics Features
POS Sales Analysis
- Detailed Metrics: Gross/Net Sales per line, item, staff, store, and terminal.
- Basket Value & Store Size: Evaluate average transaction values and store performance.
- Time Intelligence: Analyze daily, weekly, monthly sales with YTD, MTD, WTD, YoY, and PoP variances.
POS Payments Insights
- Payment Habits: Analyze net amounts and average payments by tender type and card.
- Customer Preferences: Understand preferred payment methods to tailor services.
POS Batch Analysis
- Operational Efficiency: Monitor POS events such as durations, logons, returns, voids, and transactions.
- Process Improvement: Identify areas to streamline POS operations.
Voided Transactions Analysis
- Quality Control: Analyze voided payments and sales to uncover potential issues.
- Loss Prevention: Implement strategies to reduce voided transactions and improve accuracy.
Stay Ahead with BI4Dynamics
In today's dynamic business environment, having real-time access to accurate and comprehensive financial data is essential. The BI4Dynamics Account Receivables Power BI Dashboard equips you with the tools needed to:
Gain Insights
Enhance Strategic Planning
Improve Operational Efficiency
Get Started Today
Revolutionize your reporting and analysis with BI4Dynamics
1.
Request a Personalized Demo
Explore how BI4Dynamics meets your specific needs.
Consult with our experts to learn how to maximize the solution’s benefits.
2.
Connect your data securely
We will open an unrestricted license, containing all business modules and our customization wizard.
No worries: It will be securely installed on your infrastructure, without interfering with your ERP.
3.
Implement and Empower
Deploy the solution and enhance your team’s capabilities.
Test it FREE 30 Days Free.