Skip to content
 Power BI Sales Dashboard
for Microsoft Dynamics
Daily KPIs, drill-downs to document level, and no-code setup on your Dynamics data warehouse.
See it in action: Explore our Power BI dashboards for all application areas with realistic, simulated data.
About BI4Dynamics Sales Module
Sales teams using Dynamics 365 need fast, reliable performance insights. BI4Dynamics Sales Analytics delivers daily KPIs, margin and discount tracking, and document-level visibility. It helps sales leaders, finance, and management align around one set of numbers drawn directly from Dynamics. Reports open fast, data refreshes automatically, and every figure can be traced back to the original invoice.
This solution is part of BI4Dynamics for Dynamics 365 but focused entirely on the sales domain, giving you detailed visibility into revenue, profitability, and customer behavior.
BI4Dynamics also covers Finance, Inventory, Purchasing, and other areas, all built on the same governed data warehouse and Power BI model.
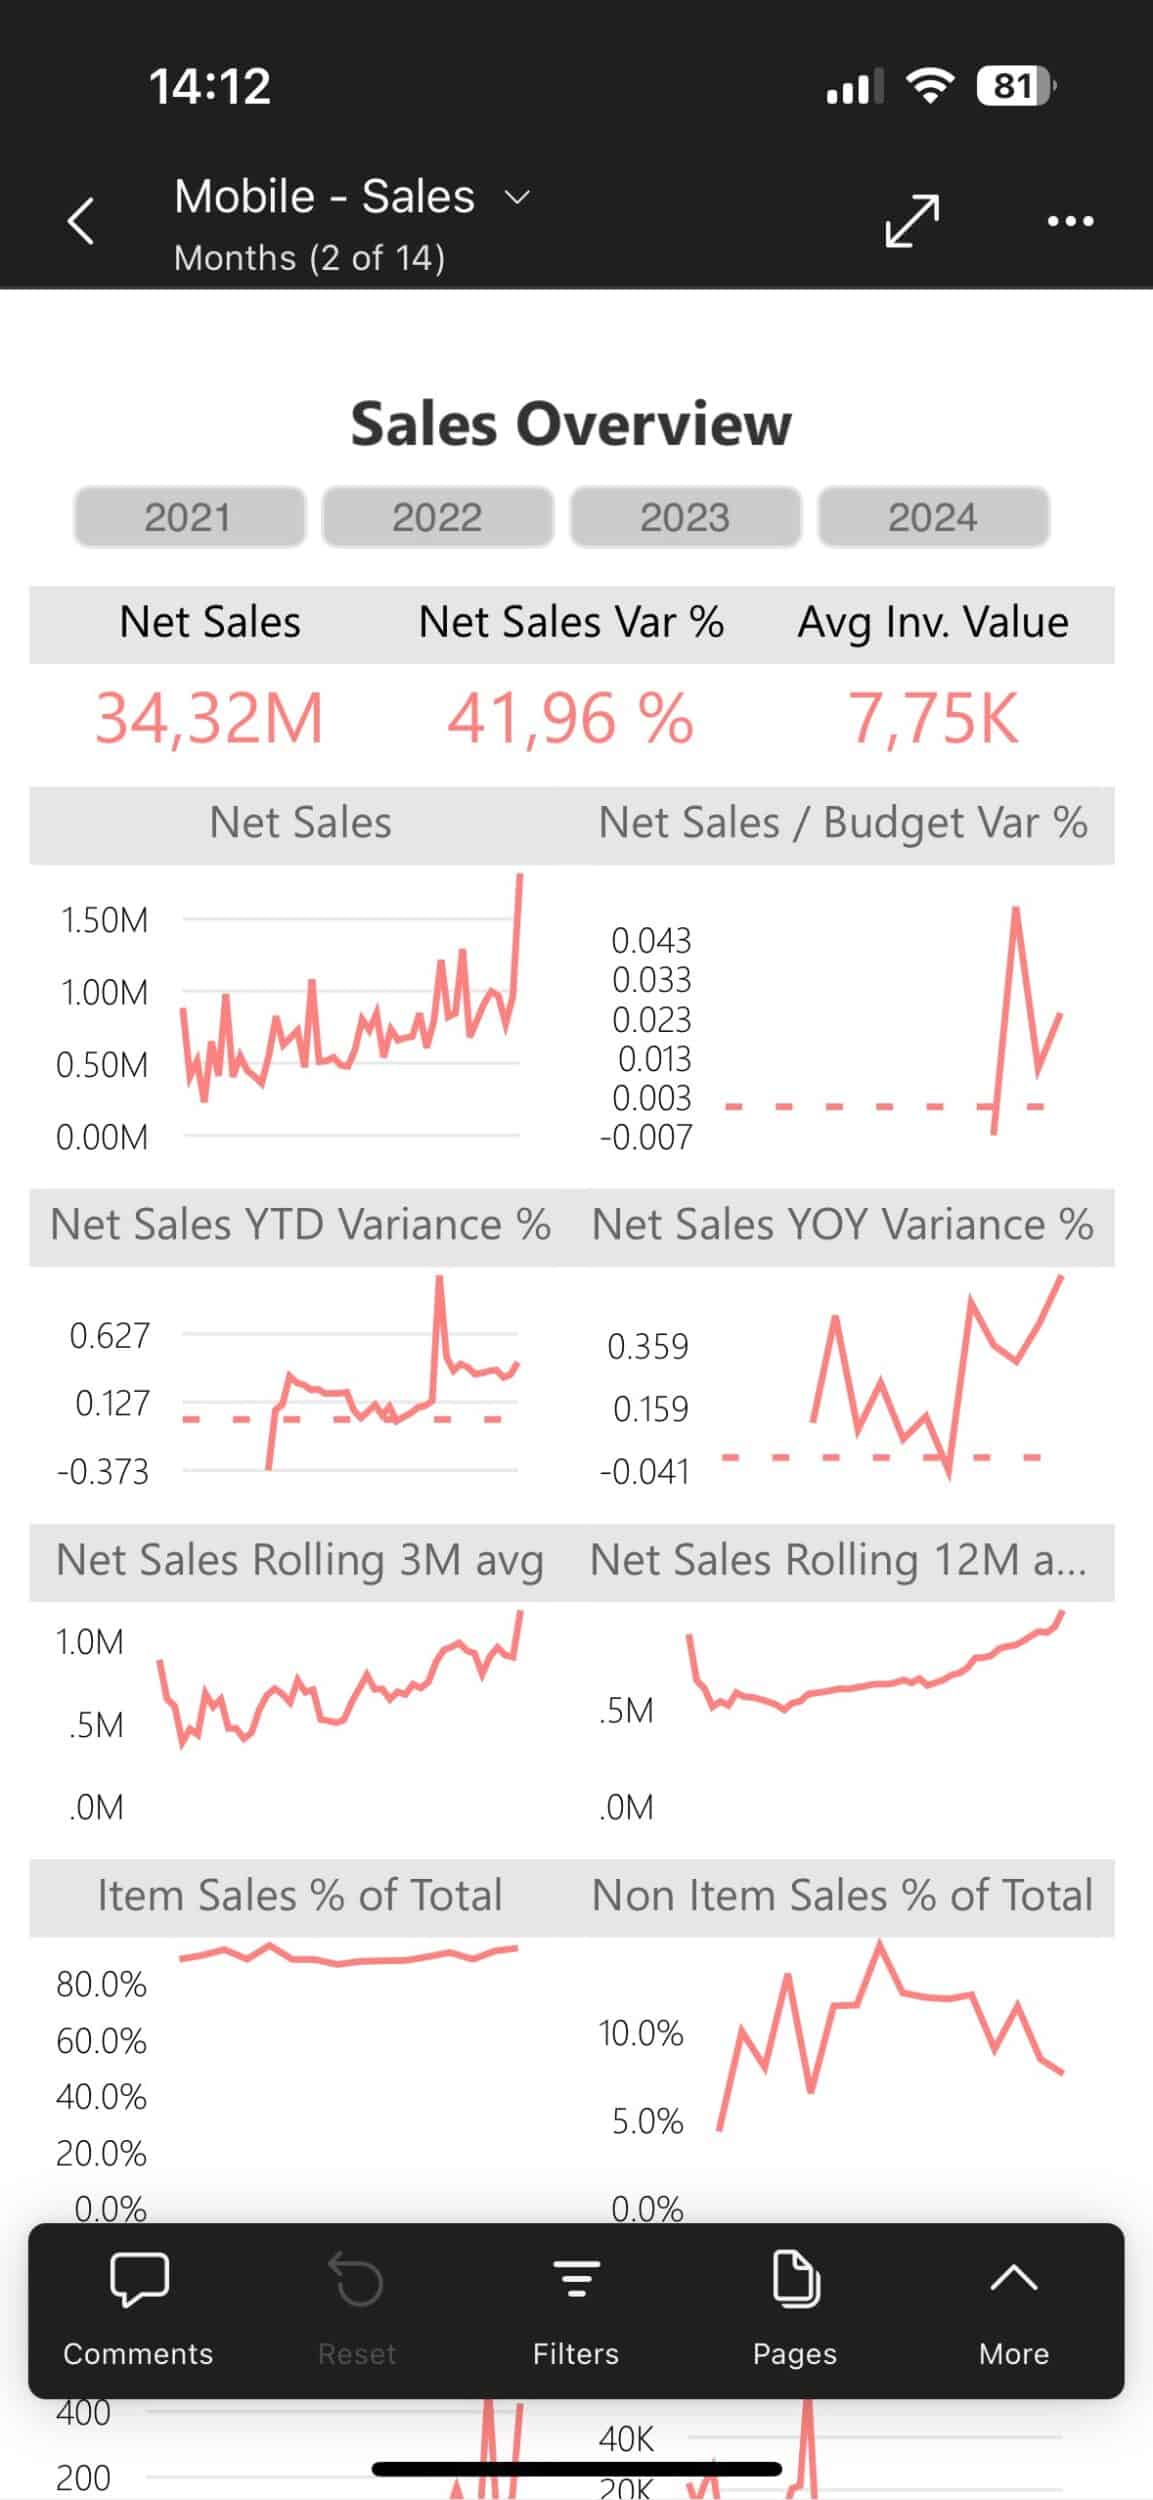
Interactive Power BI Sales Dashboard
The Sales dashboard combines pipeline, margin, account profitability, and product performance in one Power BI view. Each visual connects directly to Dynamics 365, allowing full drill-down to the original transaction for faster and more accurate forecasting.
Accelerate Sales Data Insights with BI4Dynamics: Your Fast-Track to Comprehensive Analytics.
Analyze sales and profit (Gross / Net Sales, Costs, Discounts, Profits, Invoiced Quantities, Charges, Average Sales/Cost/Profit) with receivables, inventory, etc.
With strongly supported time intelligence (YTD, YoY, PoP, 12 Last months, Rolling 3/6/12) and Expected values.
Drastically reduce the time and money spent on creating & maintaining reports.
- Report on your Dynamics fields, KPIs and drill down into the document level.
- Enjoy lightning-fast reporting with over 150 out-of-the-box Power BI reports developed by business leaders.
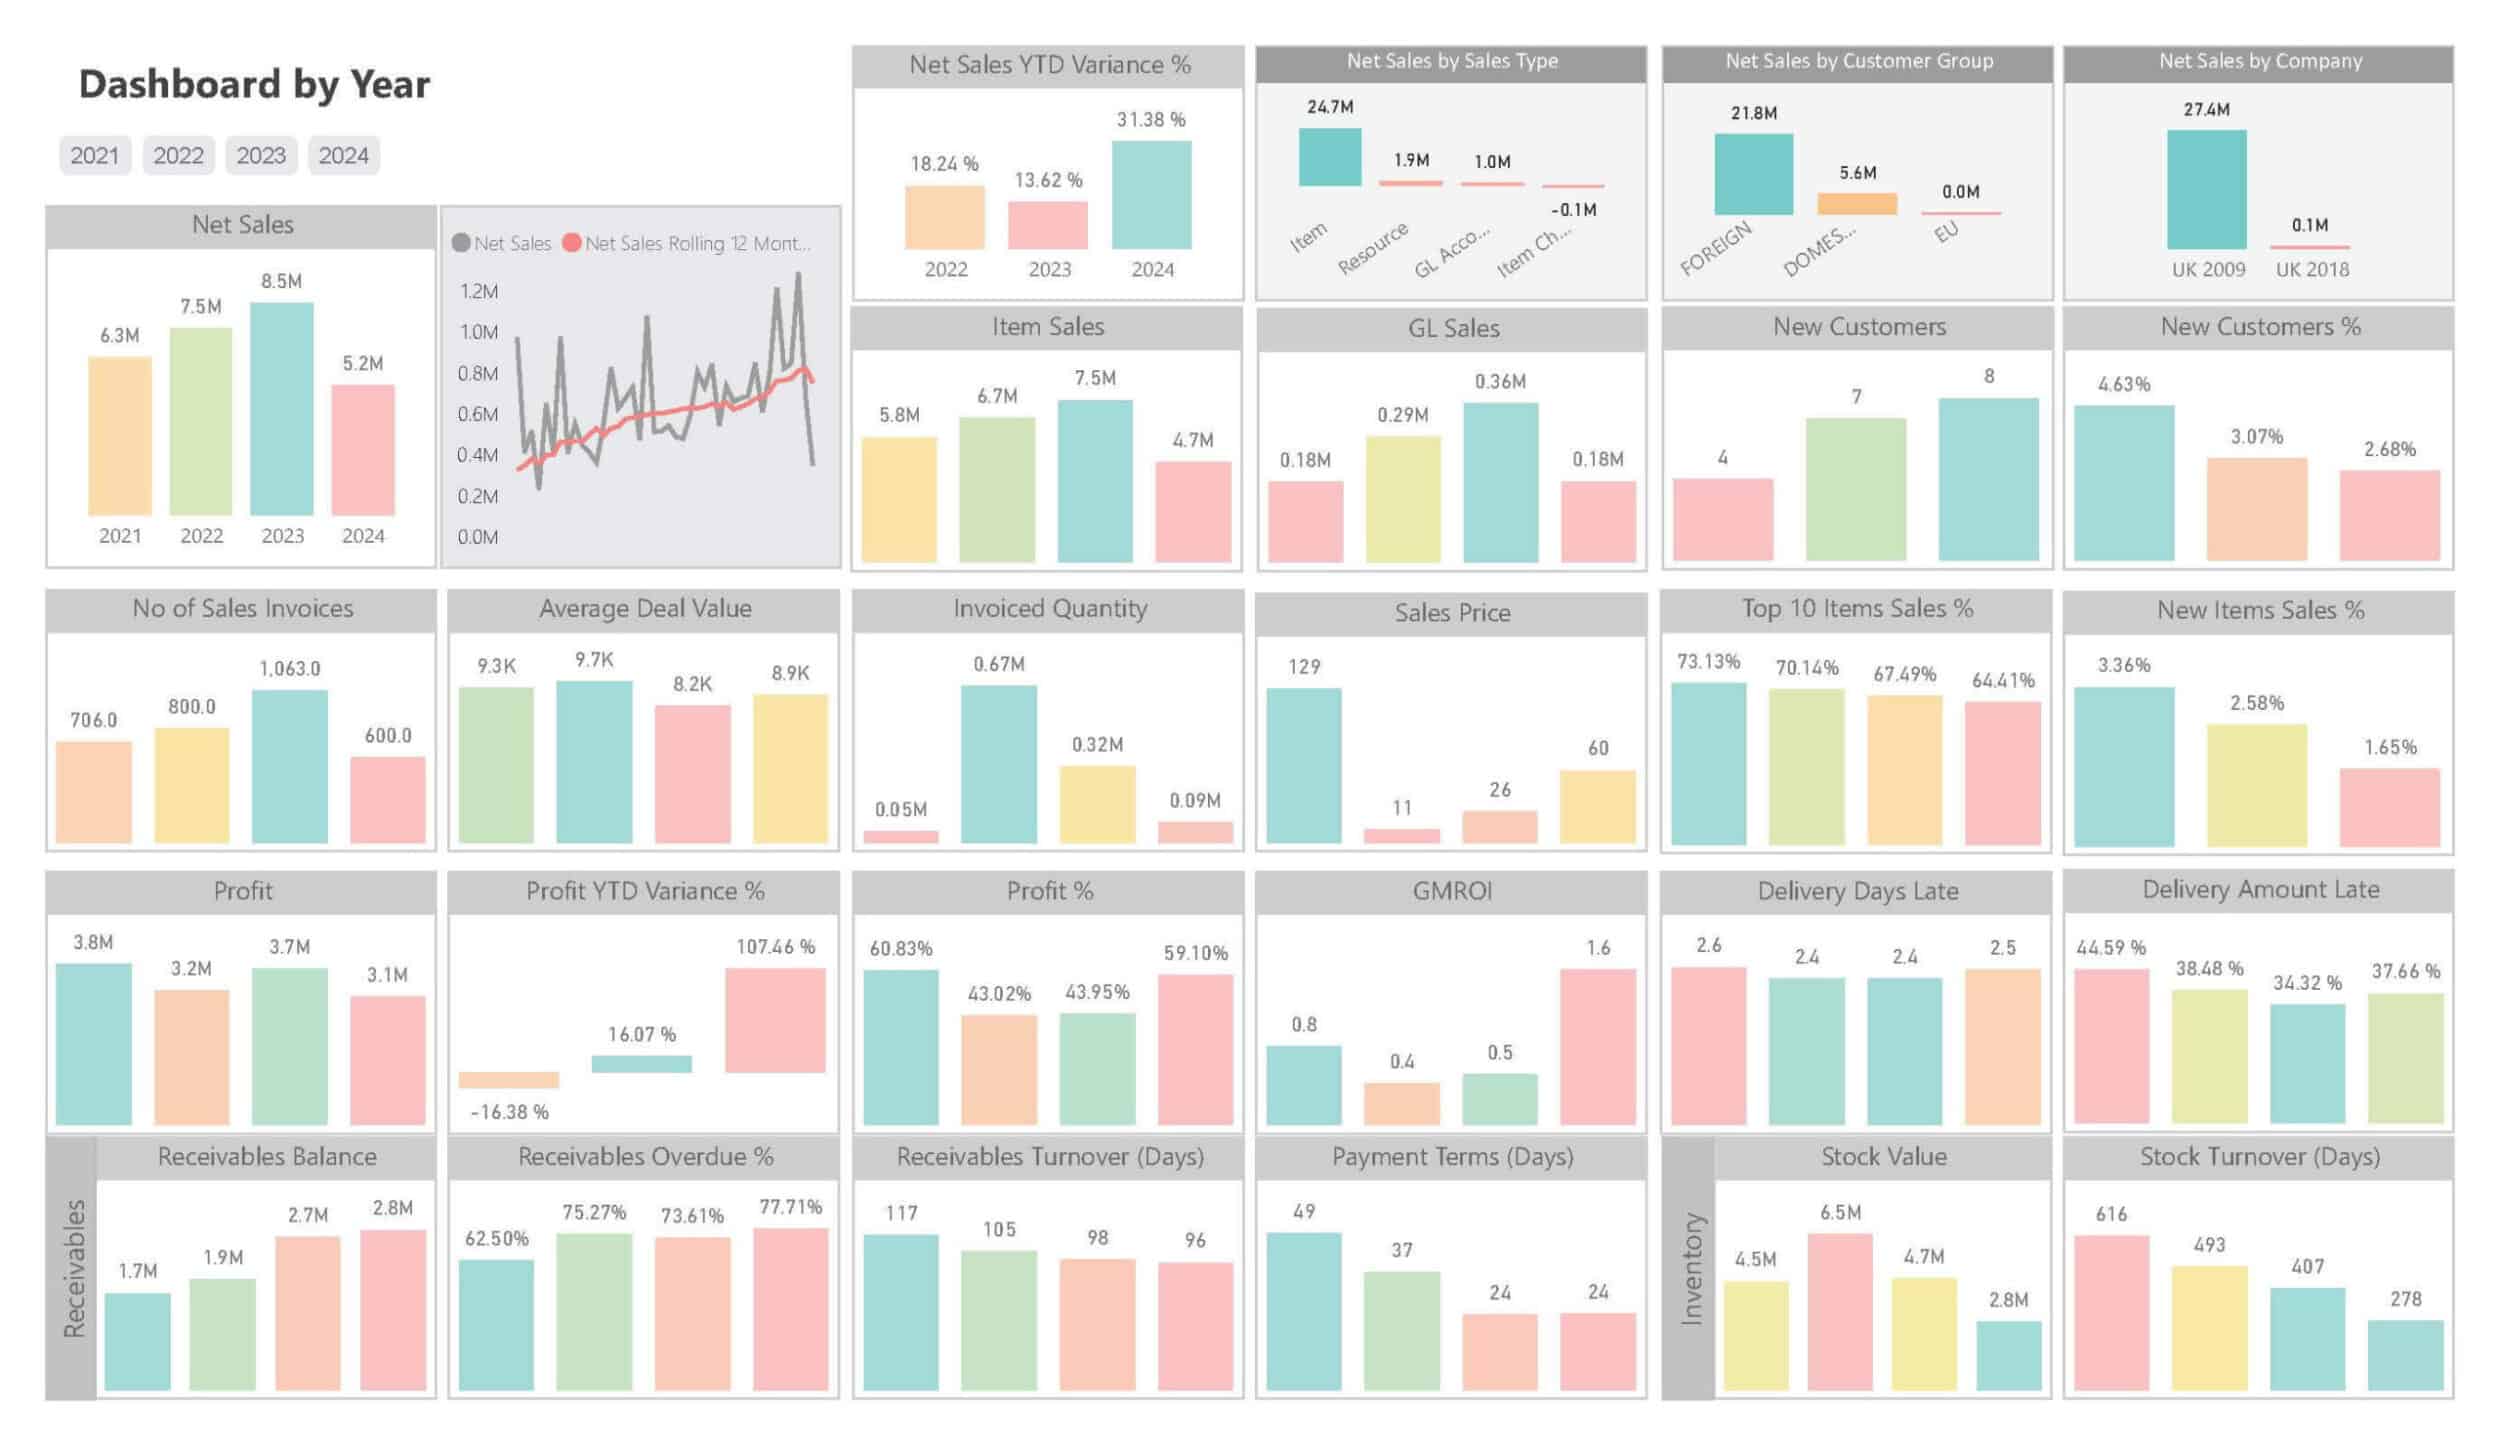
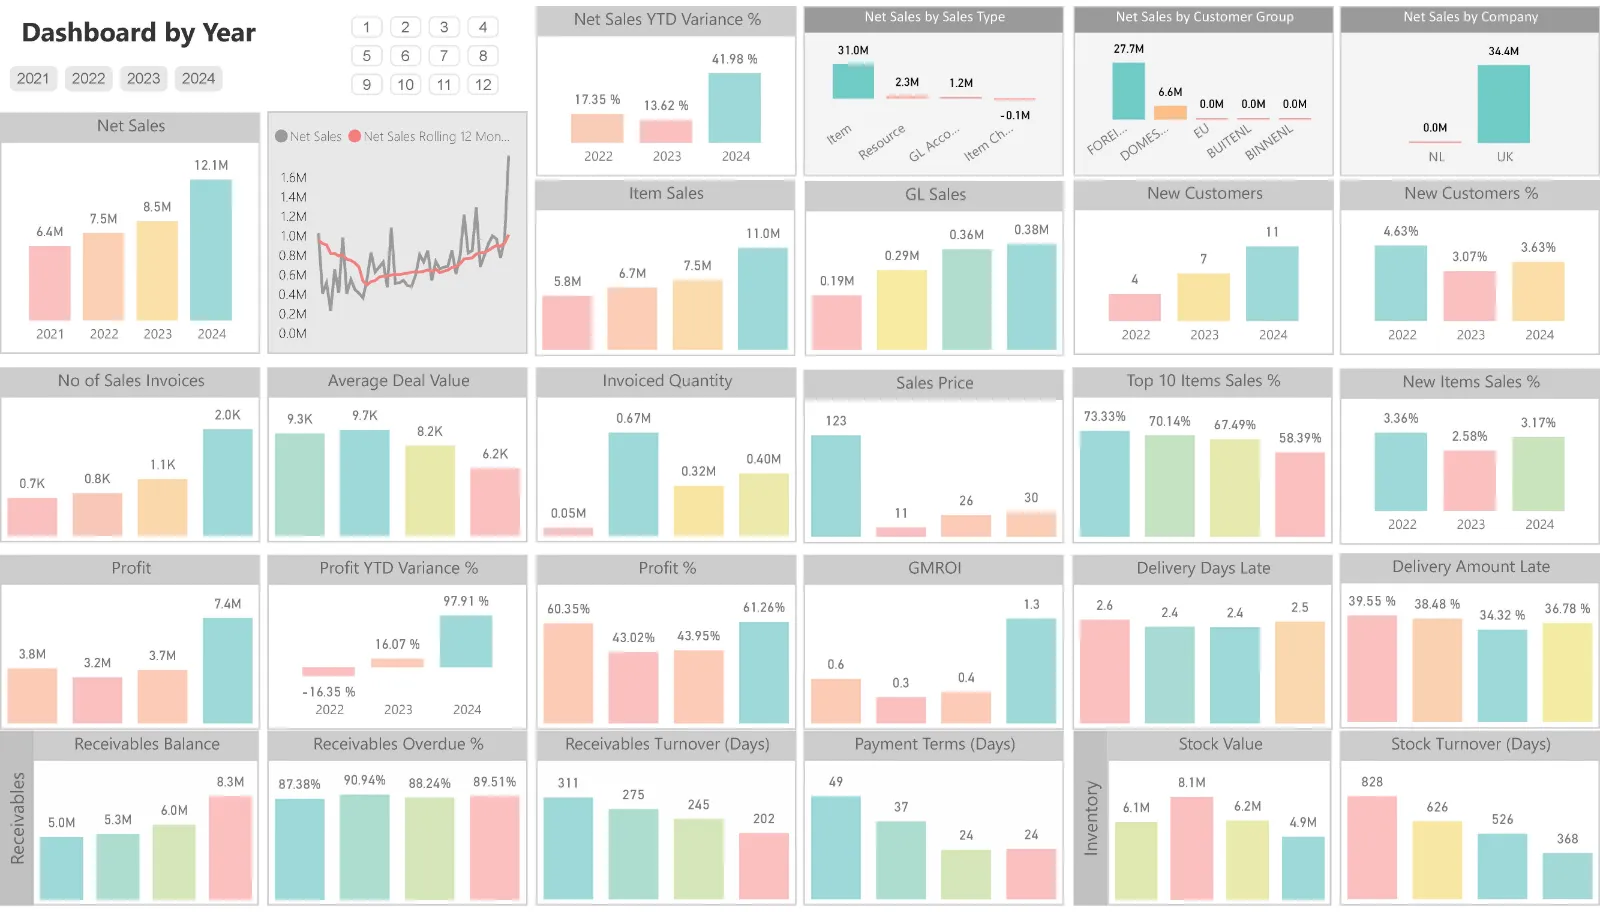
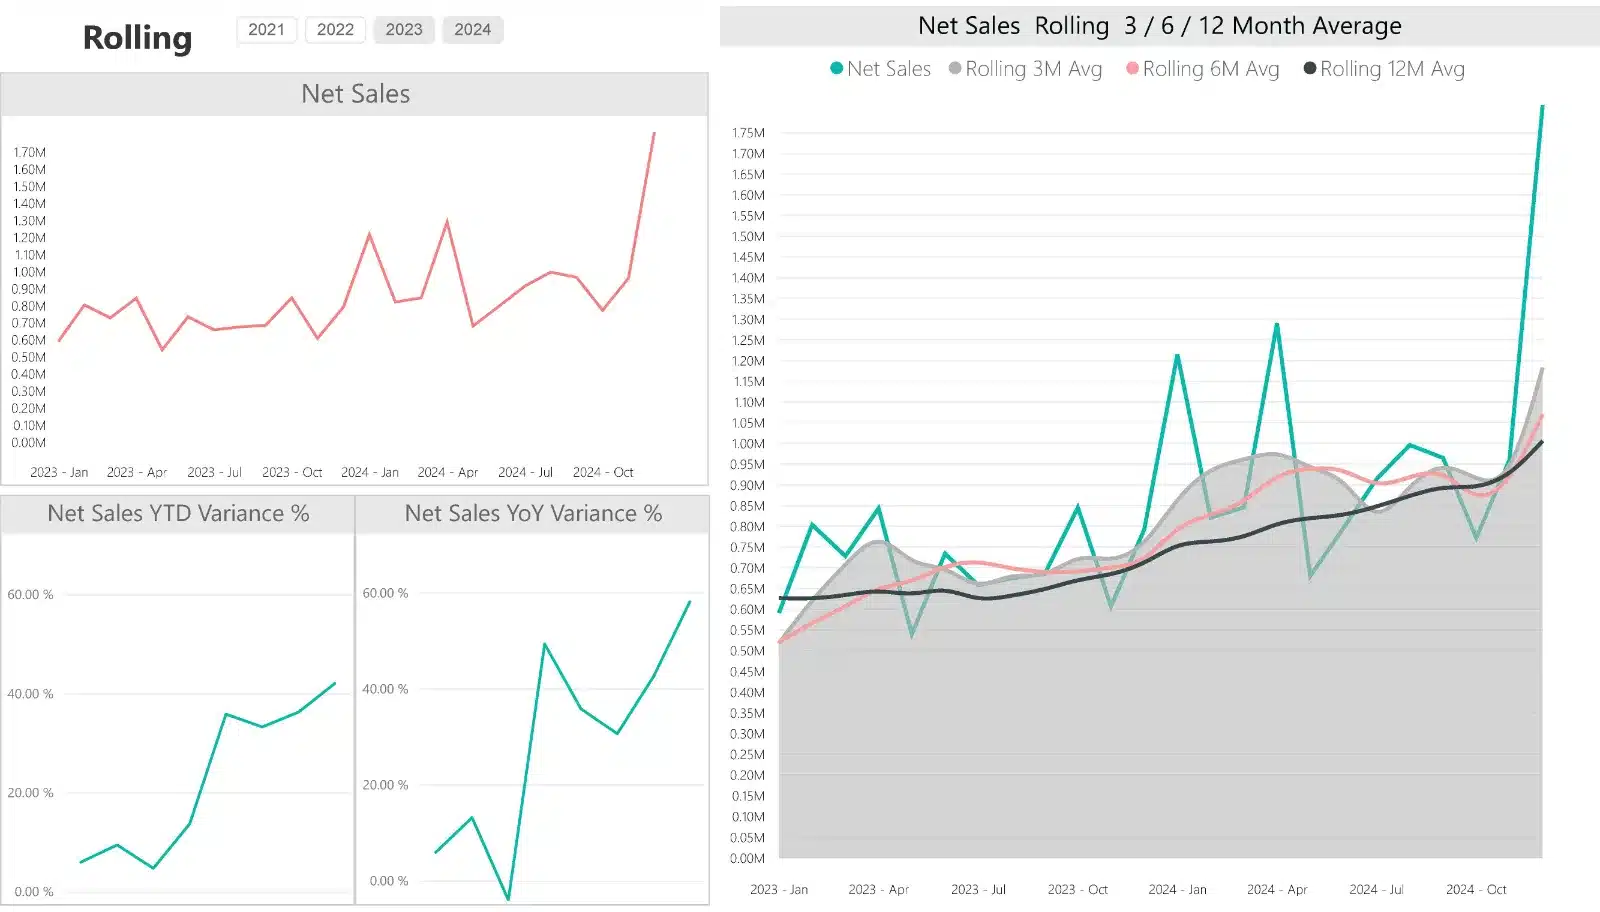
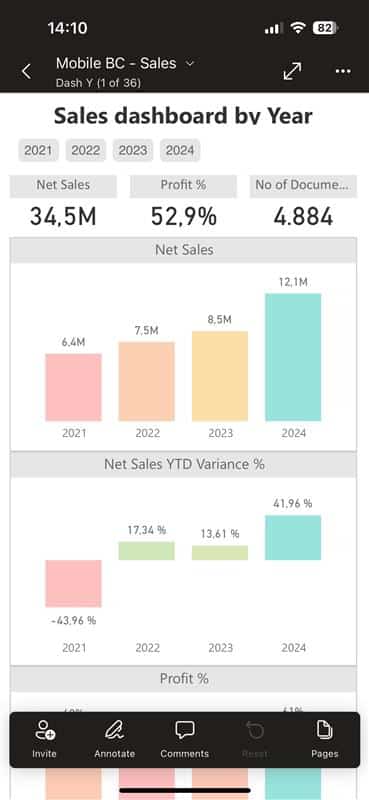
Annual Sales Dashboard for Yearly Performance Analysis in Microsoft Dynamics Power BI
This dashboard presents year-over-year sales performance, highlighting KPIs like net sales, profit, invoices, and receivables. It helps track yearly growth and evaluate the effectiveness of sales strategies over time.
What It Does/Offers:
- Shows net sales trends from 2021 to 2024, allowing for a year-by-year performance comparison.
- Net Sales YTD Variance % to measure the sales progress compared to the previous year.
- Tracks number of sales invoices and average deal value, highlighting business activity and profitability per transaction.
- Provides insights into profit trends, including profit YTD variance and profit percentage, supporting financial planning.
- Analyzes receivables turnover and payment terms, ensuring effective receivables management.
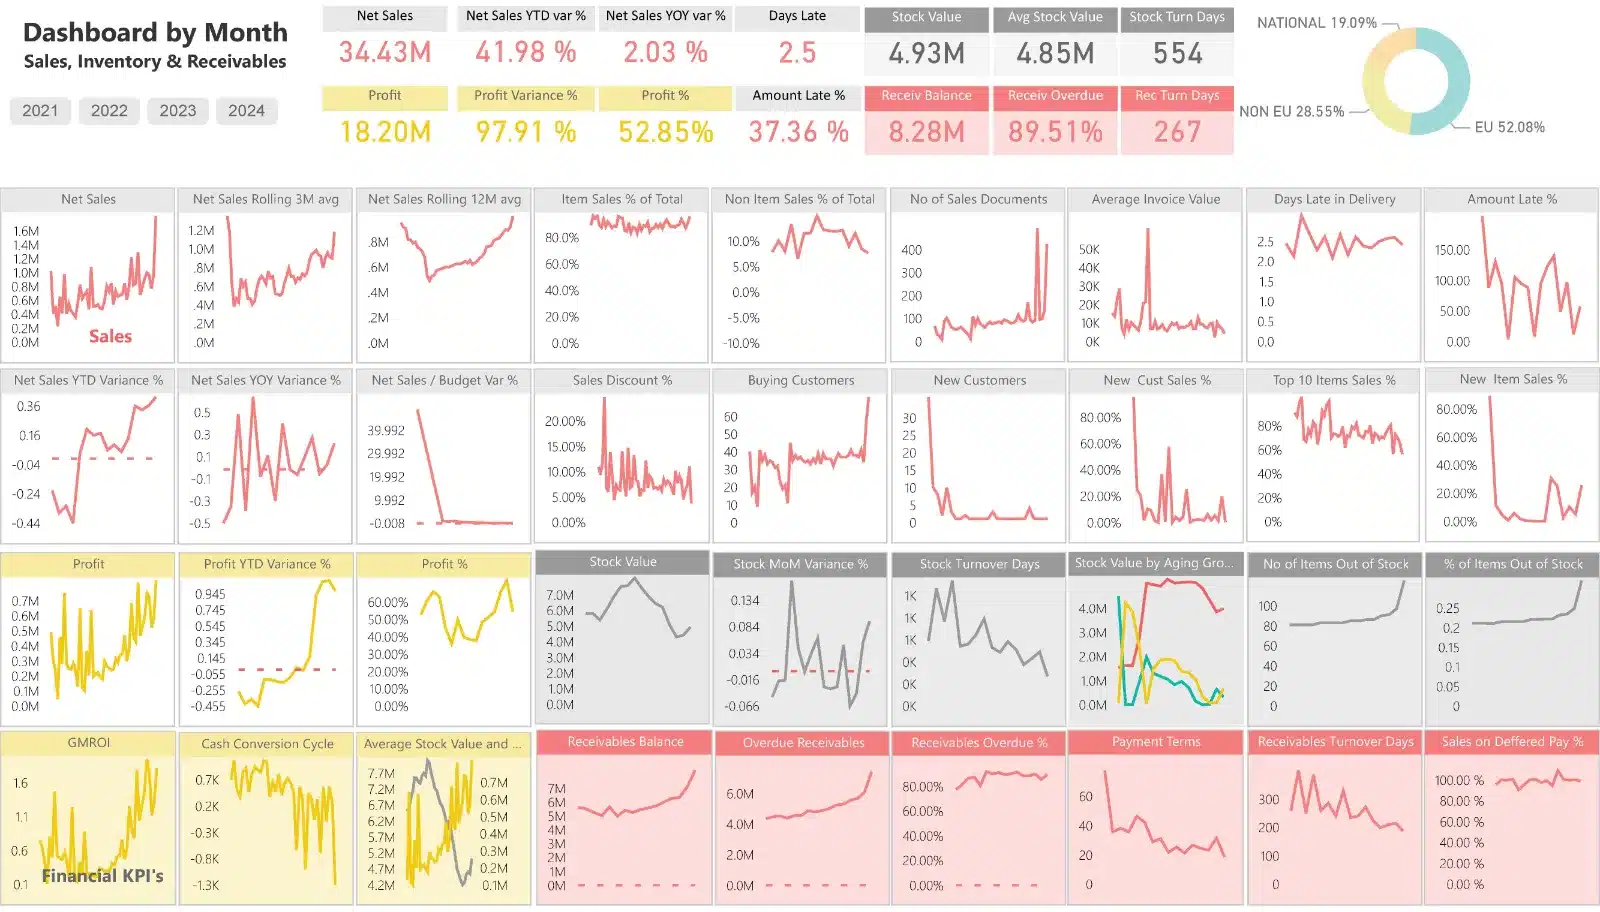
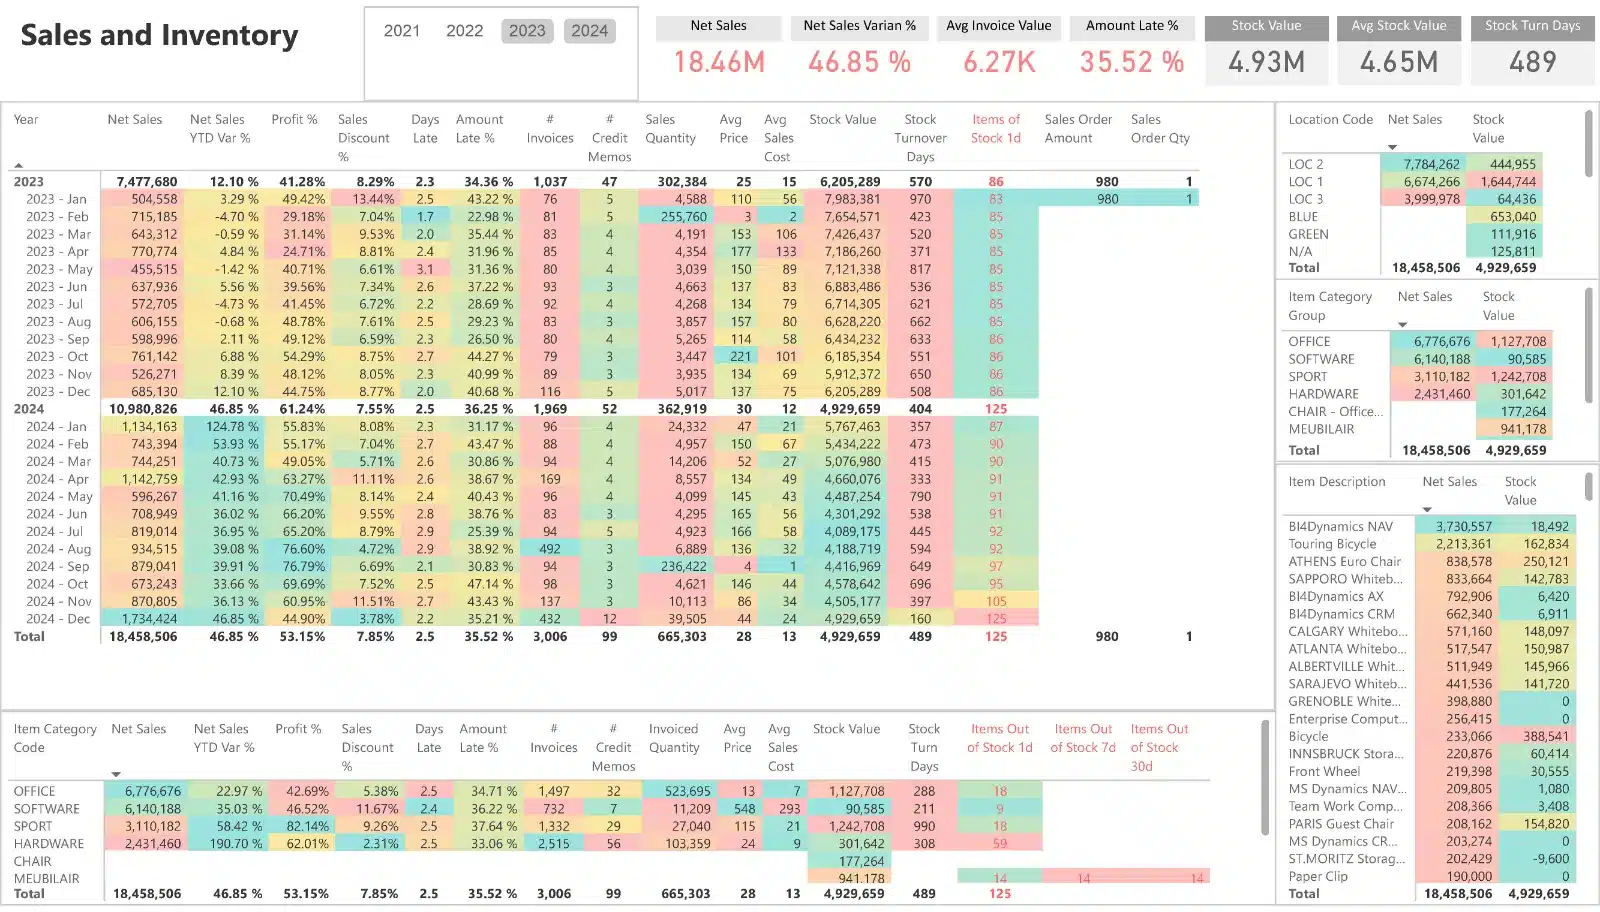
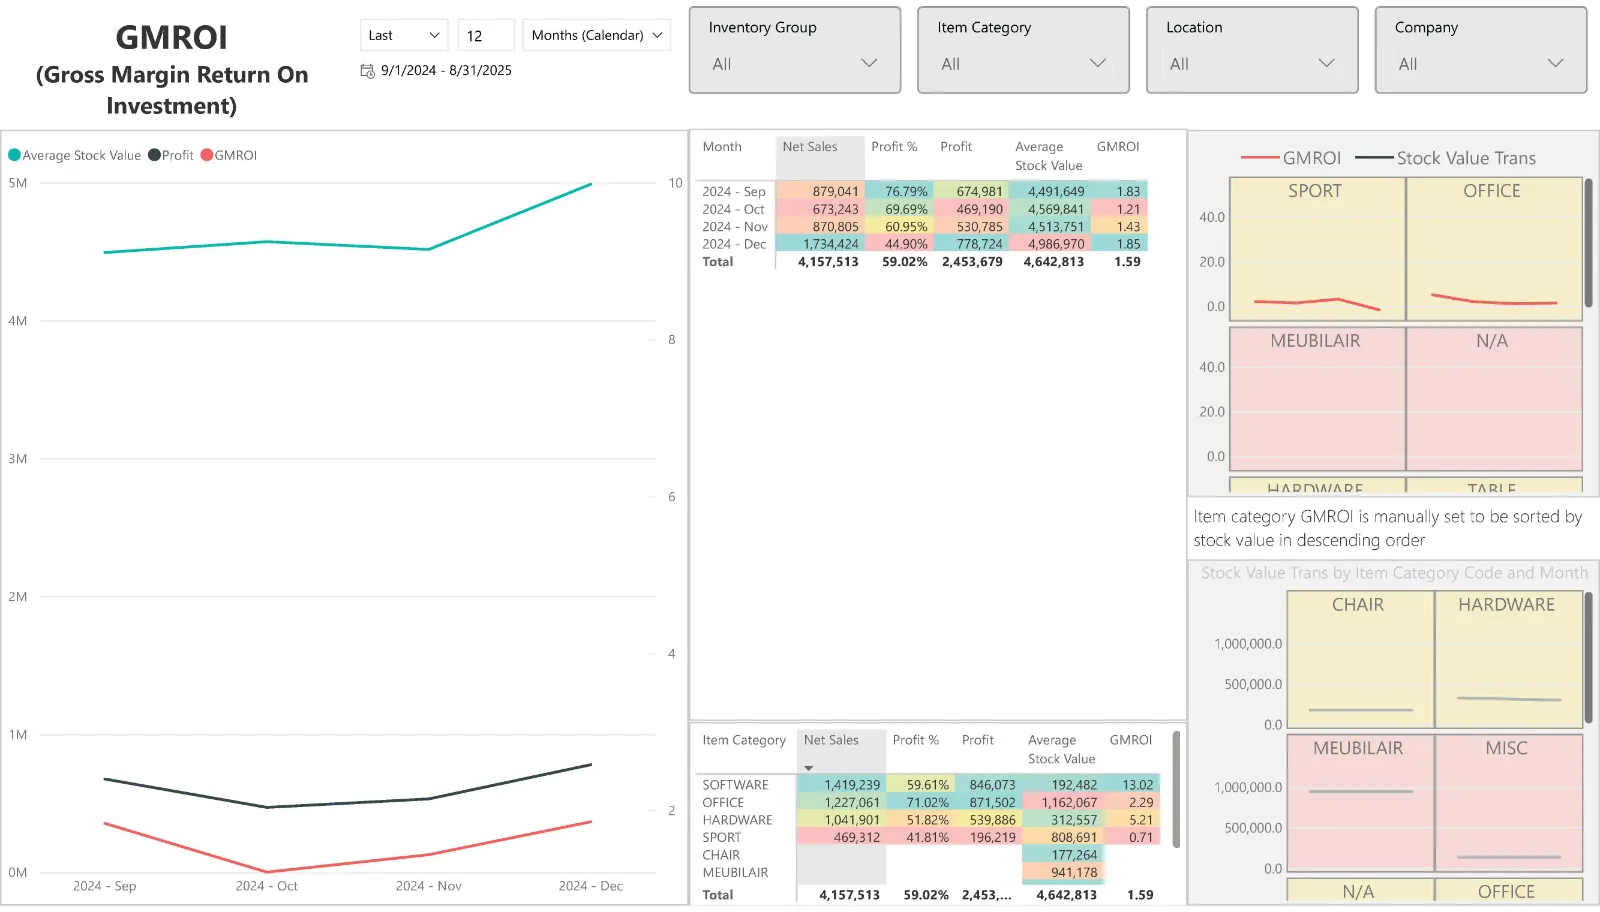
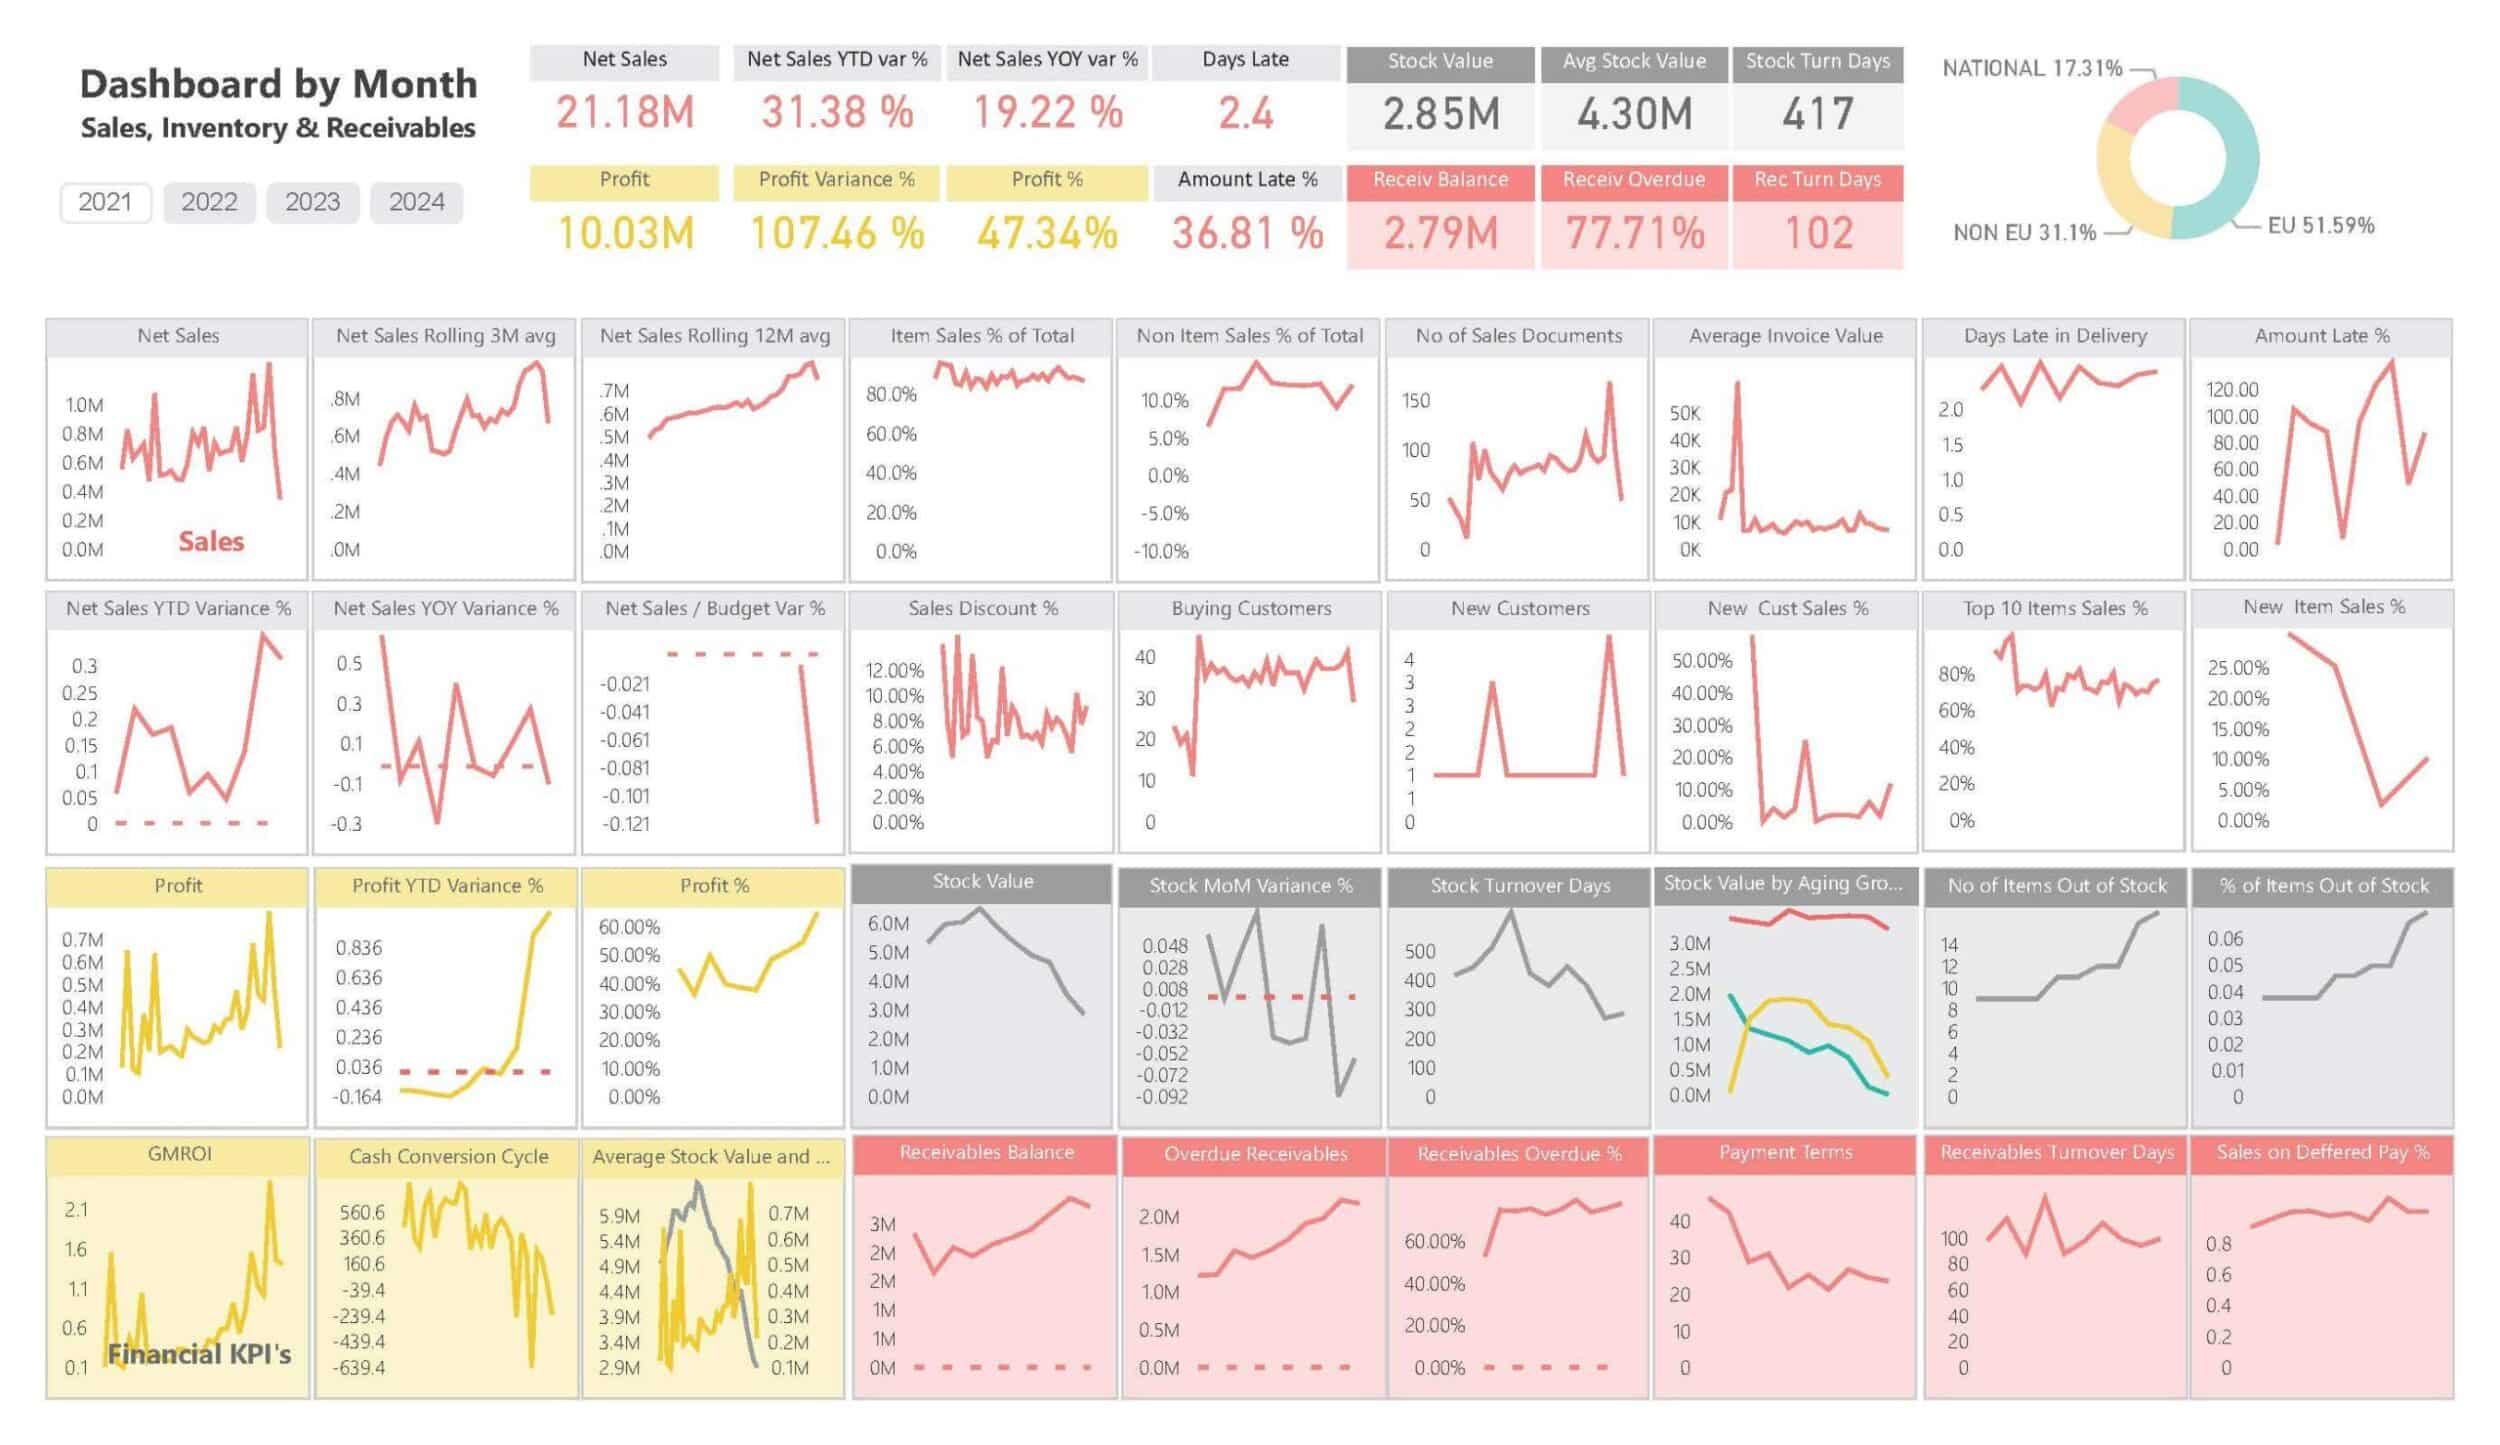
Monthly Sales, Inventory & Receivables Dashboard for Microsoft Dynamics Power BI
This Power BI dashboard offers a monthly breakdown of sales, inventory, and receivables, helping businesses stay on top of short-term sales performance and cash flow health.
What It Does/Offers:
- Tracks monthly net sales and profit, giving a snapshot of ongoing sales activities and performance.
- Displays sales variance metrics like net sales YTD and year-over-year variance to identify growth patterns.
- Evaluates stock value and stock turnover days, ensuring optimal inventory levels and reducing stockouts.
- Receivables balance and overdue metrics to monitor cash flow and improve collection strategies.
- Provides financial KPIs such as GMROI, profit margin, and receivables turnover, guiding financial health monitoring.
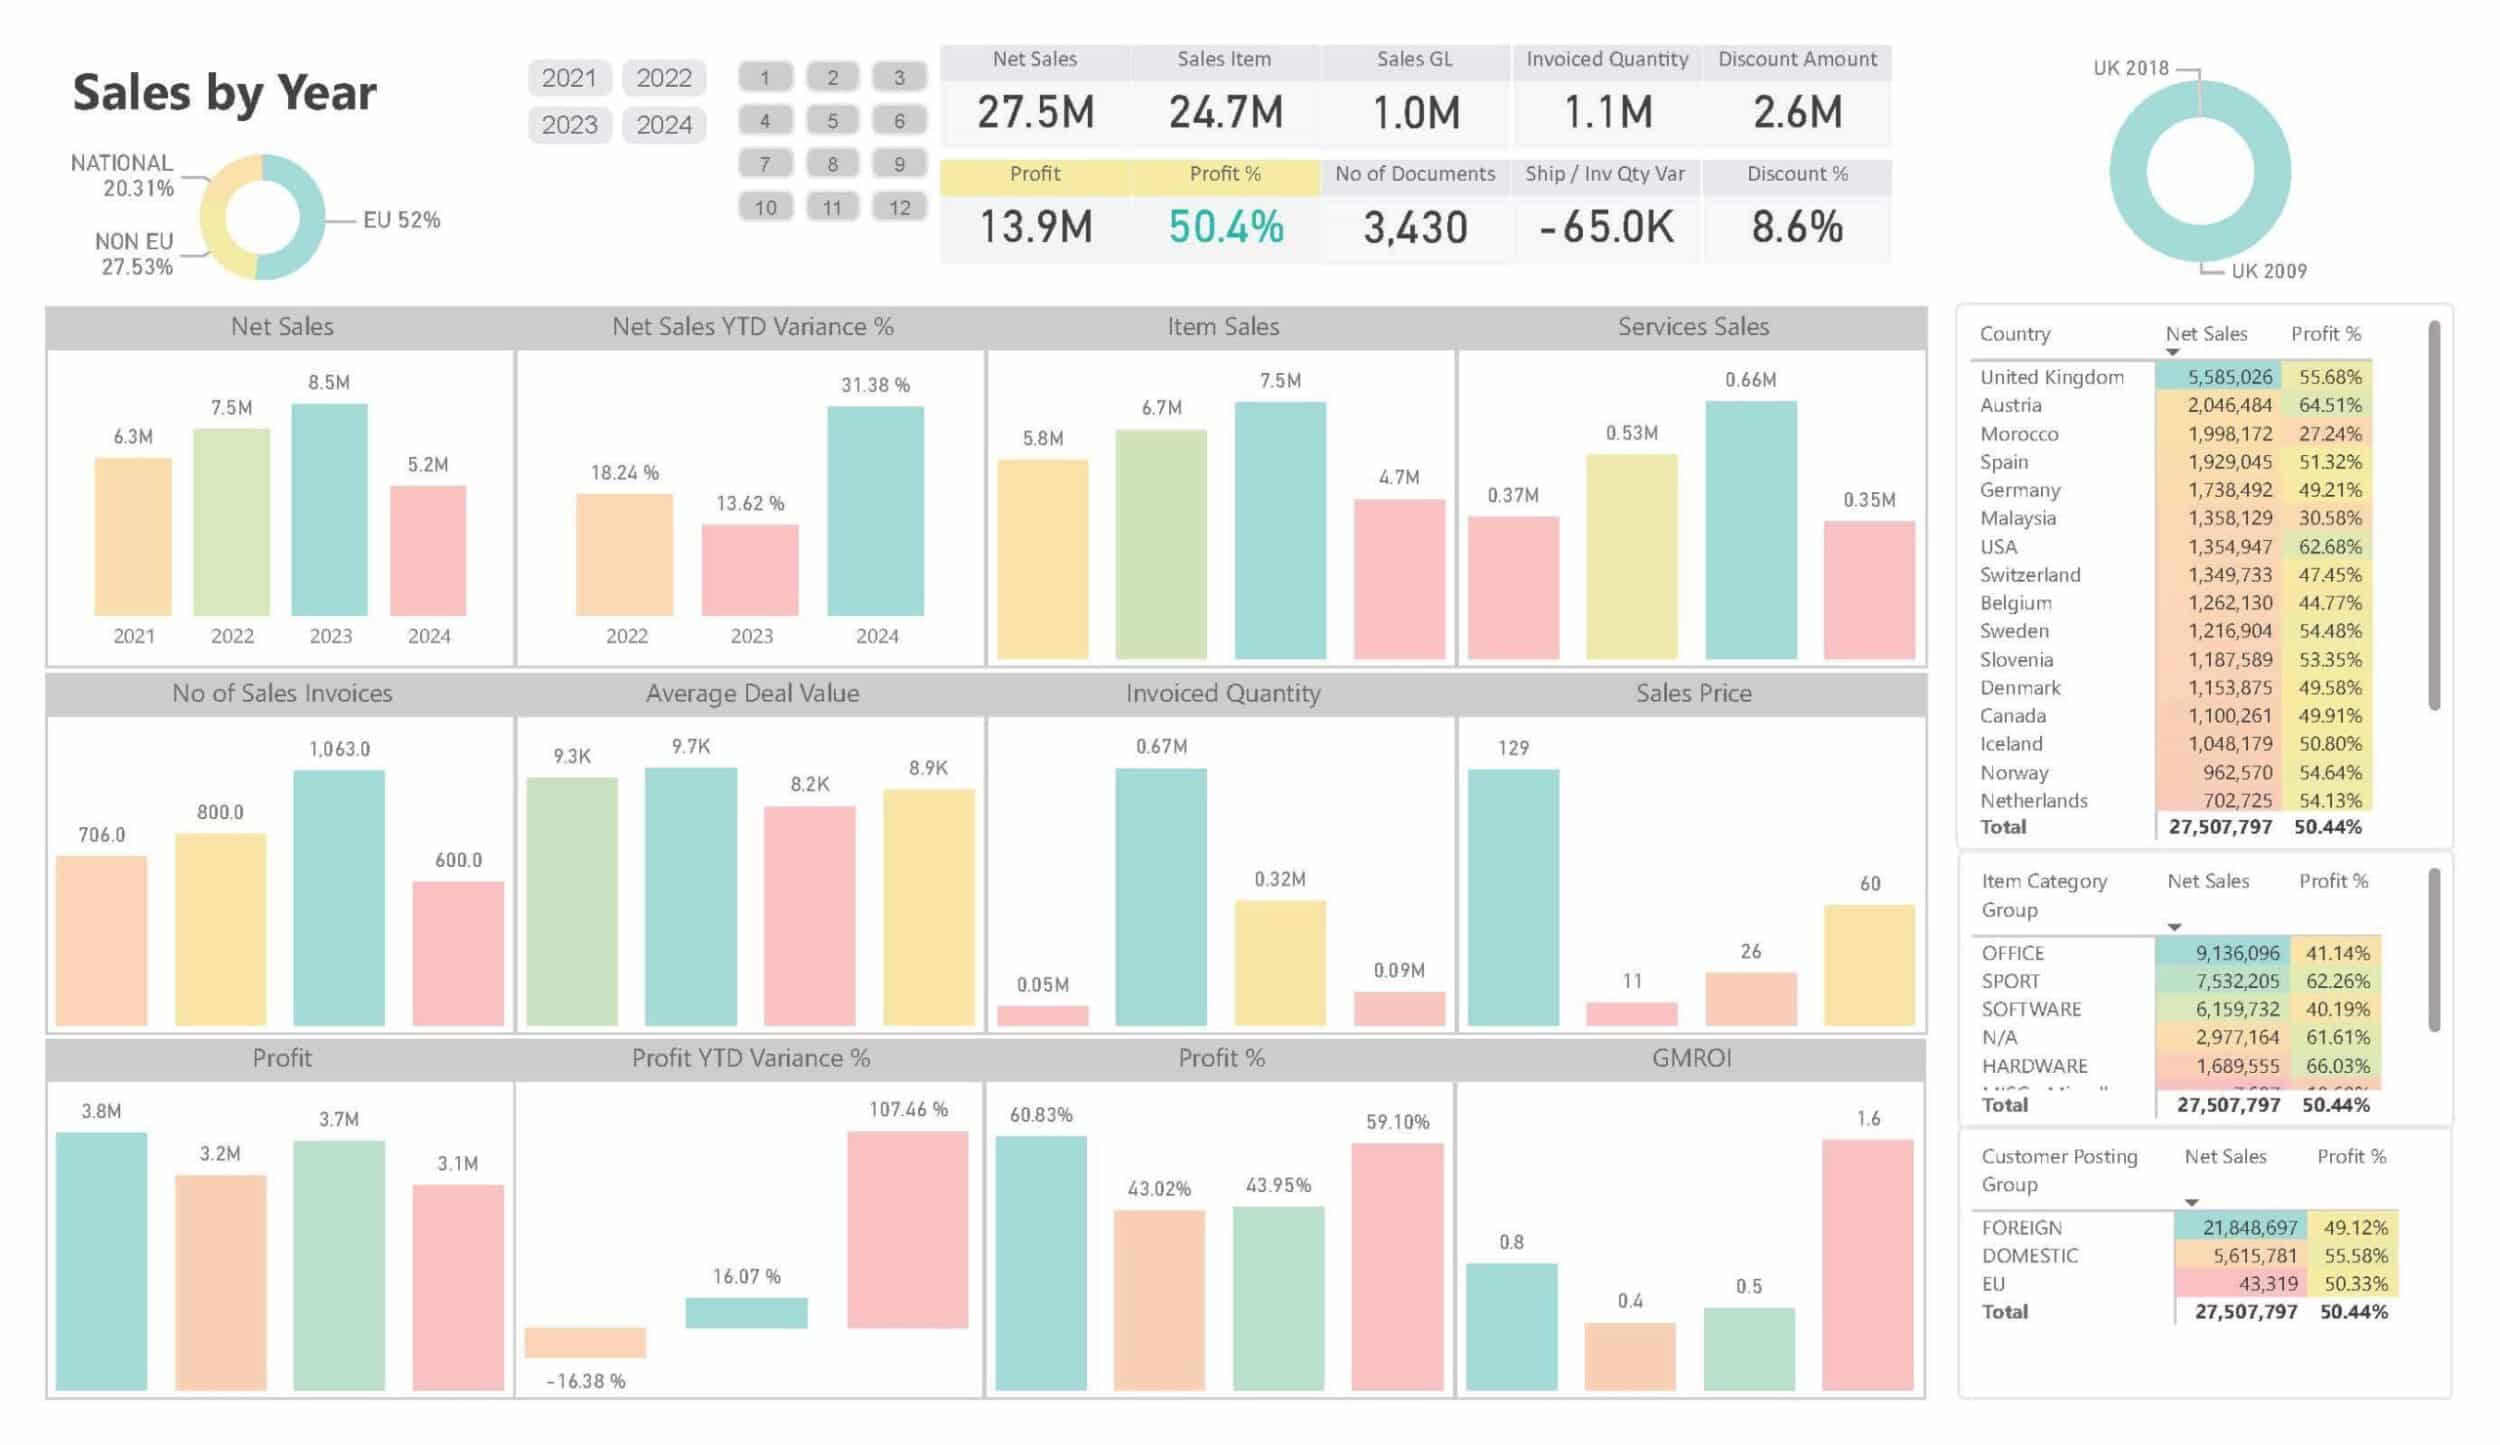
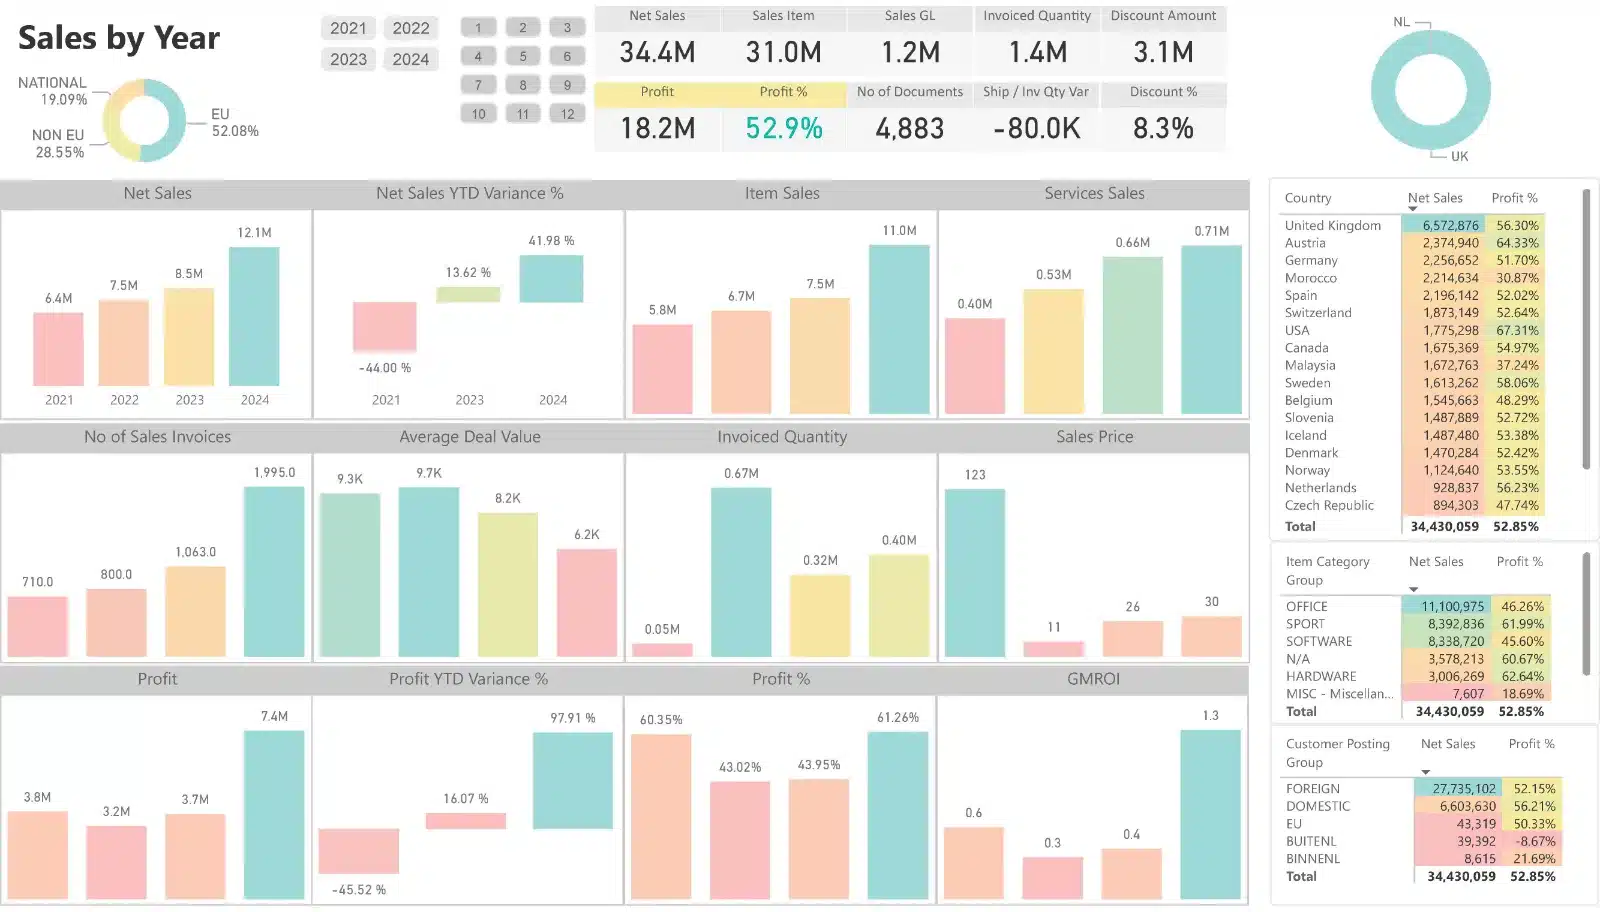
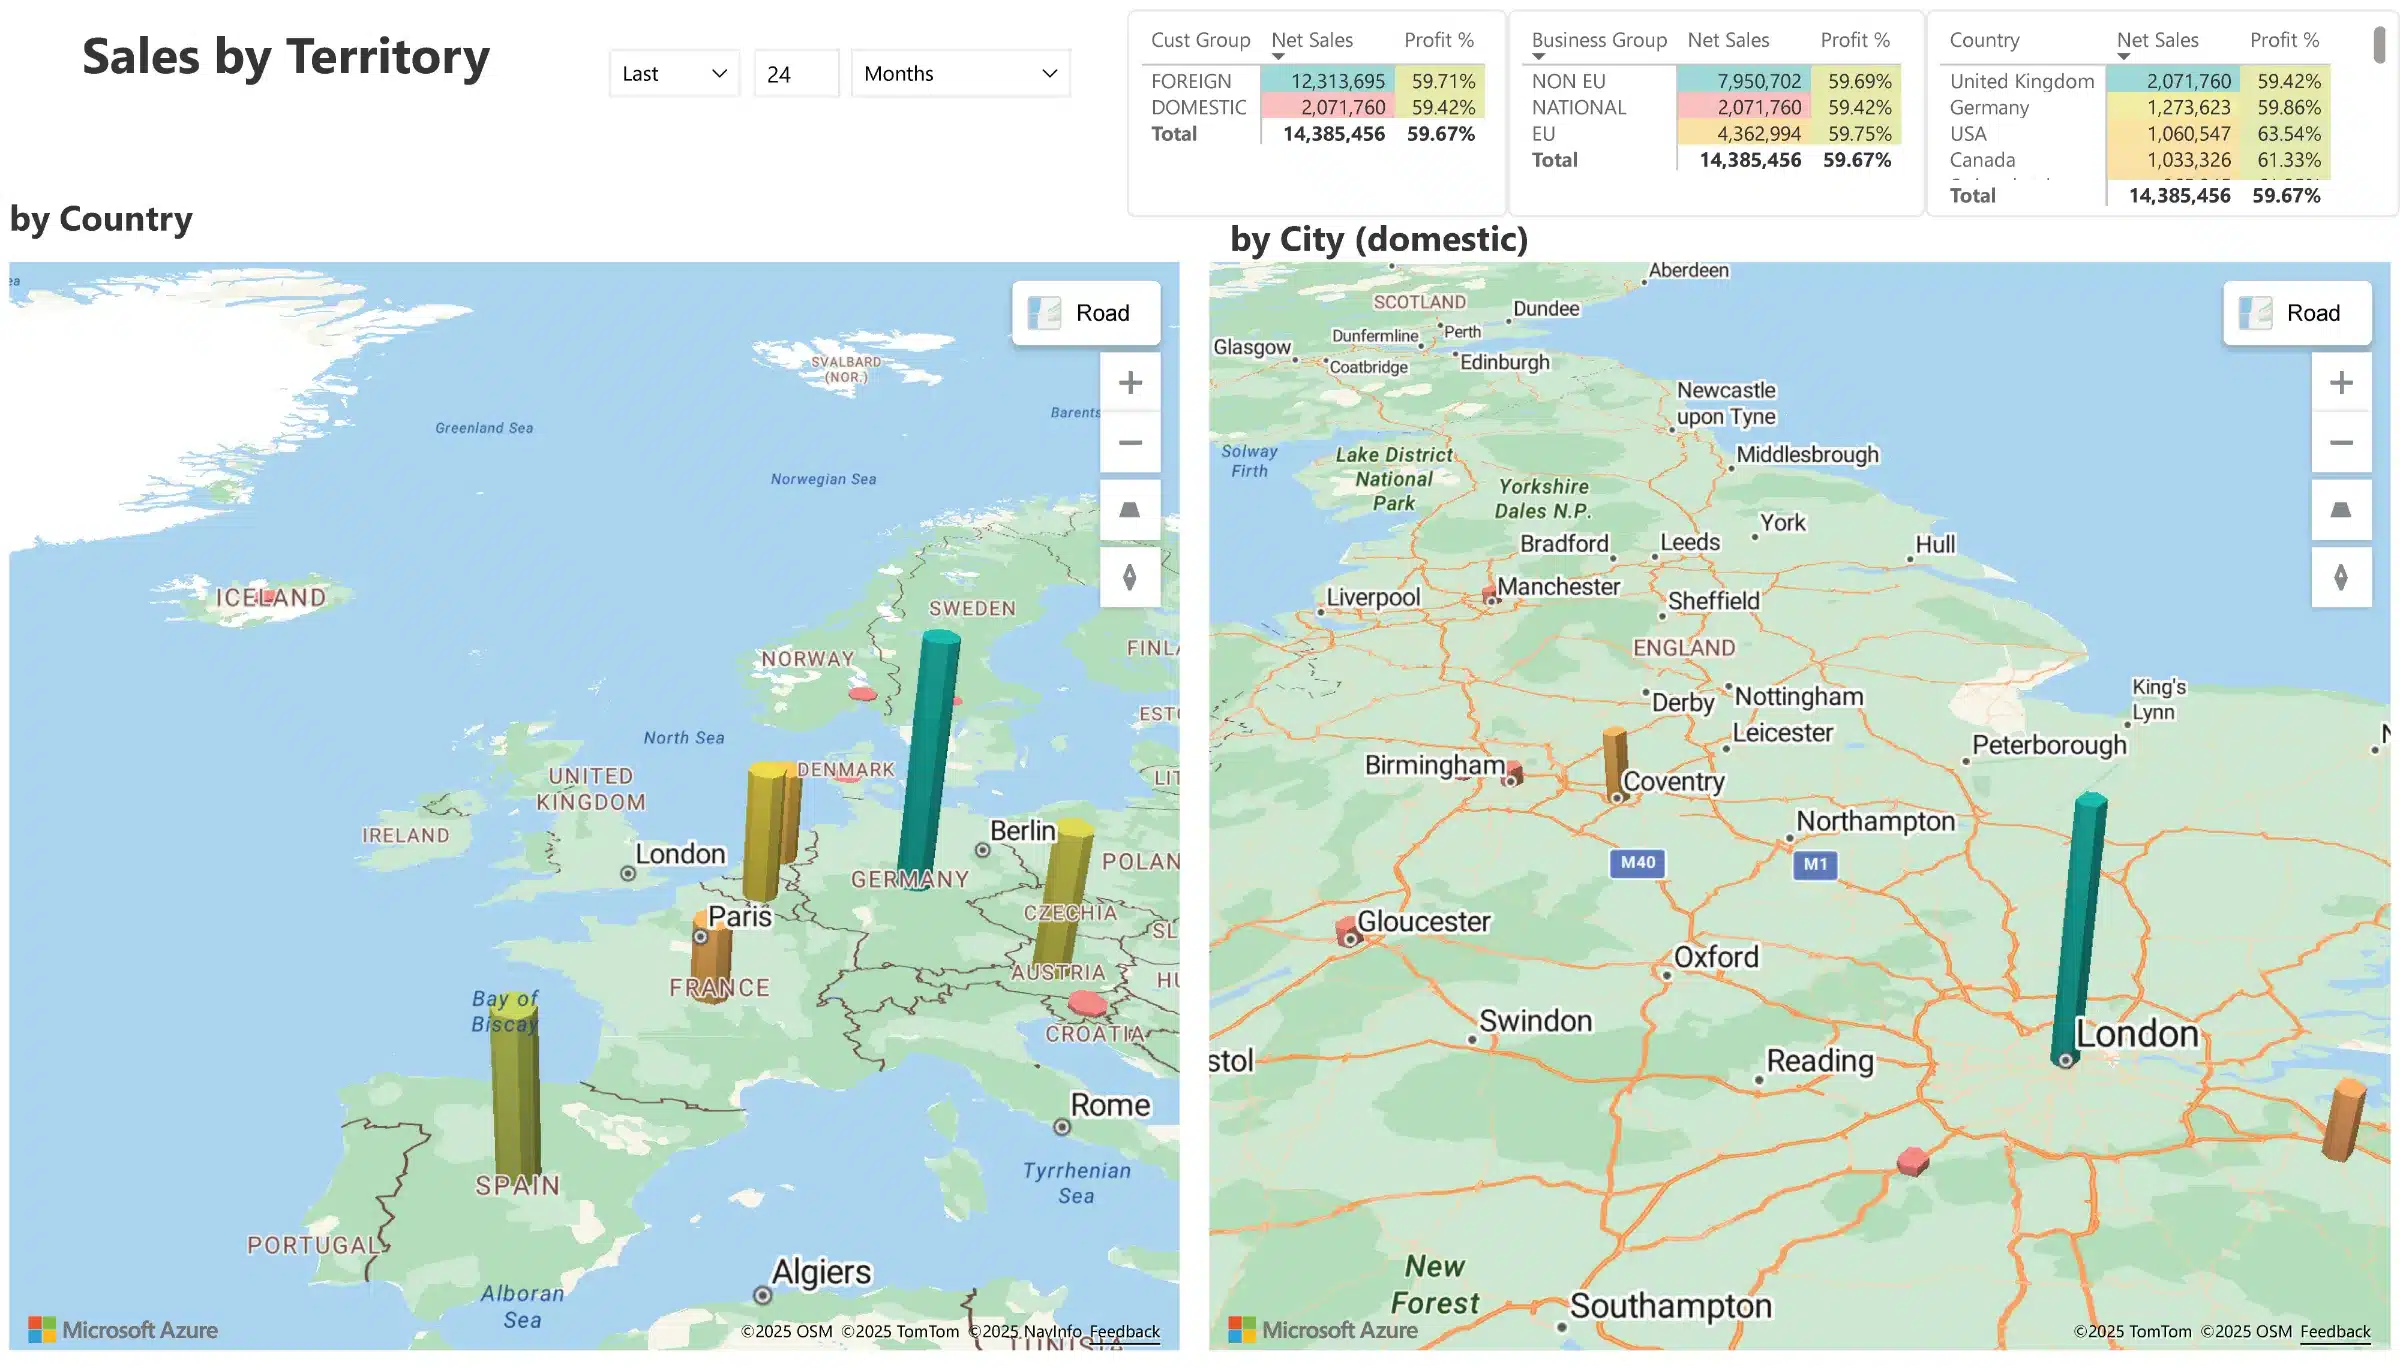
Yearly Sales Performance and Profit Analysis by Country for Microsoft Dynamics Power BI
This Power BI dashboard breaks down sales and profit by country, offering valuable insights into geographic performance, helping optimize sales strategies across regions.
What It Does/Offers:
- Net sales by year and profit percentage metrics, offering insights into annual business growth.
- Tracks net sales by customer posting group (e.g., EU, National, Export), providing a regional sales performance breakdown.
- Shows profit variance by year and country, helping identify the most profitable regions.
- Breakdown by item category group to analyze which categories are driving the most sales and profit across different regions.
- Useful for country-level performance evaluation, supporting targeted sales efforts and strategy improvements.
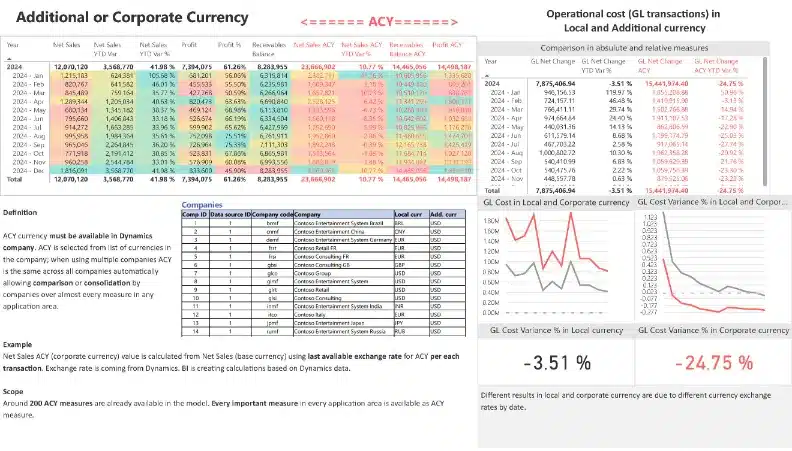
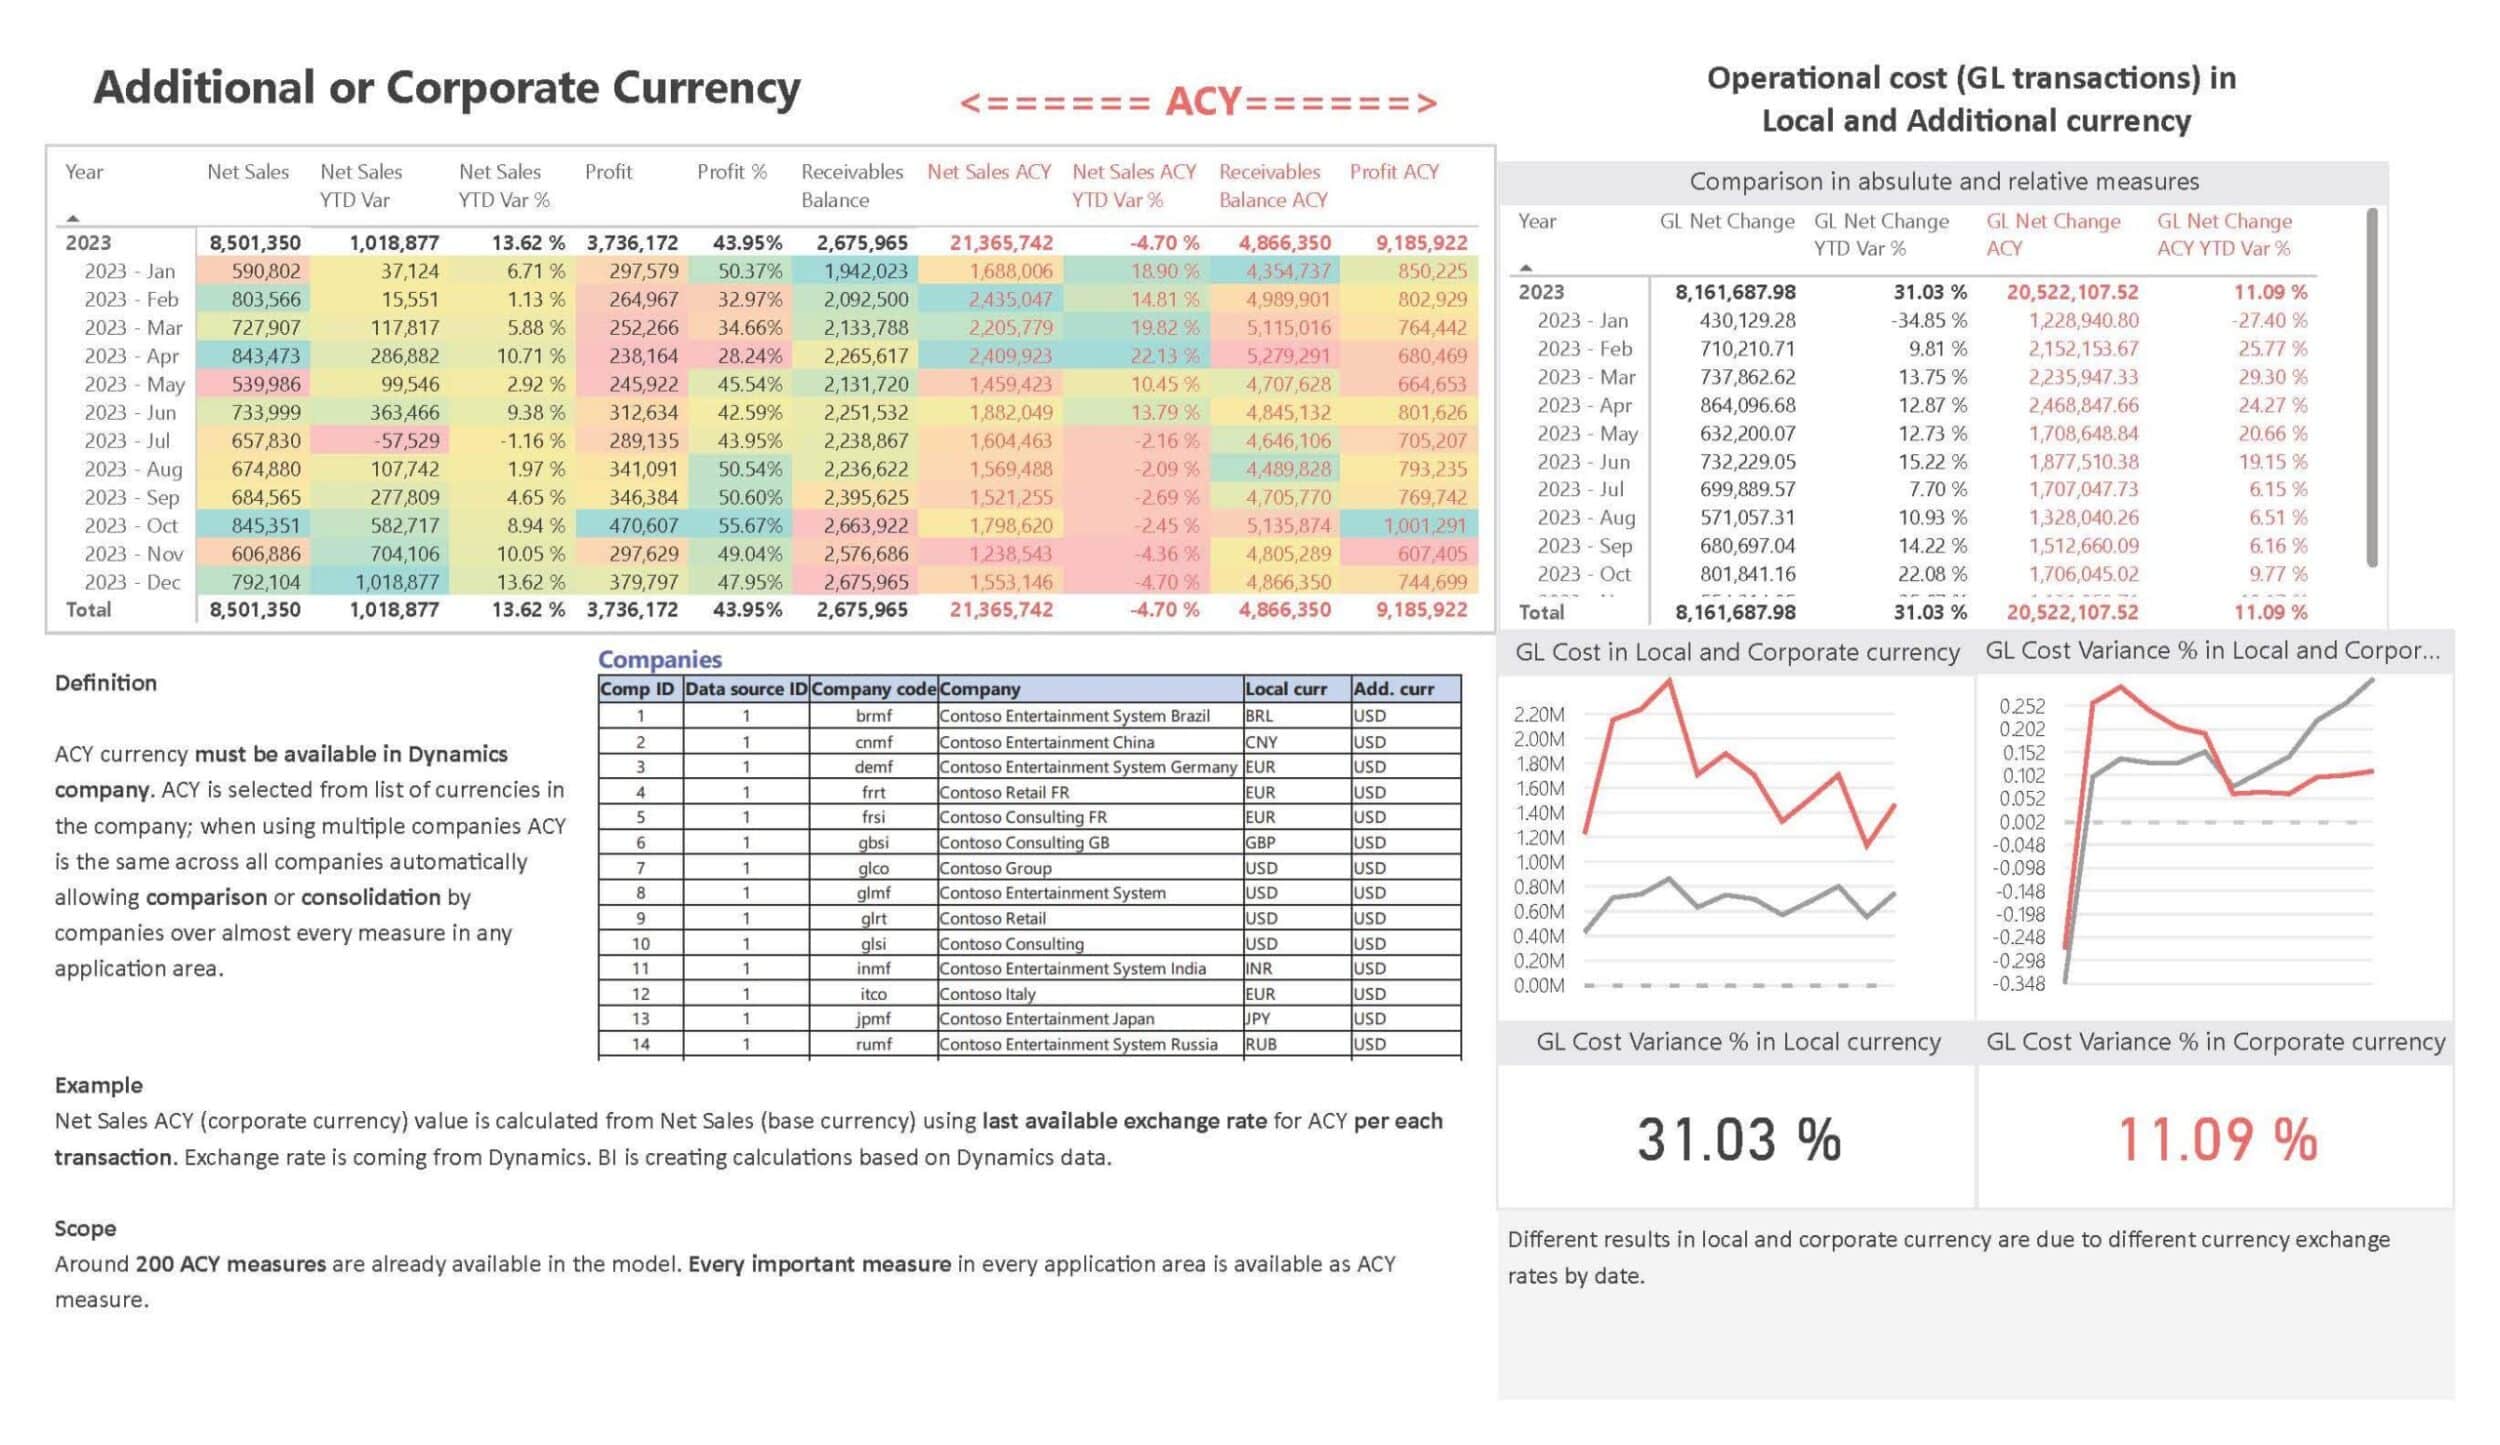
Additional or Corporate Currency GL Transactions Dashboard for Microsoft Dynamic
This Power BI dashboard provides insights into operational costs in local and corporate currencies, offering comparisons to understand financial impact due to currency fluctuations.
What It Does/Offers:
- Compares net sales and profit in both local and corporate currency, showing the financial impact of exchange rates.
- Provides metrics like net sales variance in ACY (Additional Currency), allowing businesses to evaluate financial performance consistently across global branches.
- GL Cost Variance analysis to understand differences in local vs. corporate currency for effective cost control.
- Displays key operational metrics for multiple companies, highlighting cost and profit in additional currency to ensure accurate multi-currency financial consolidation.
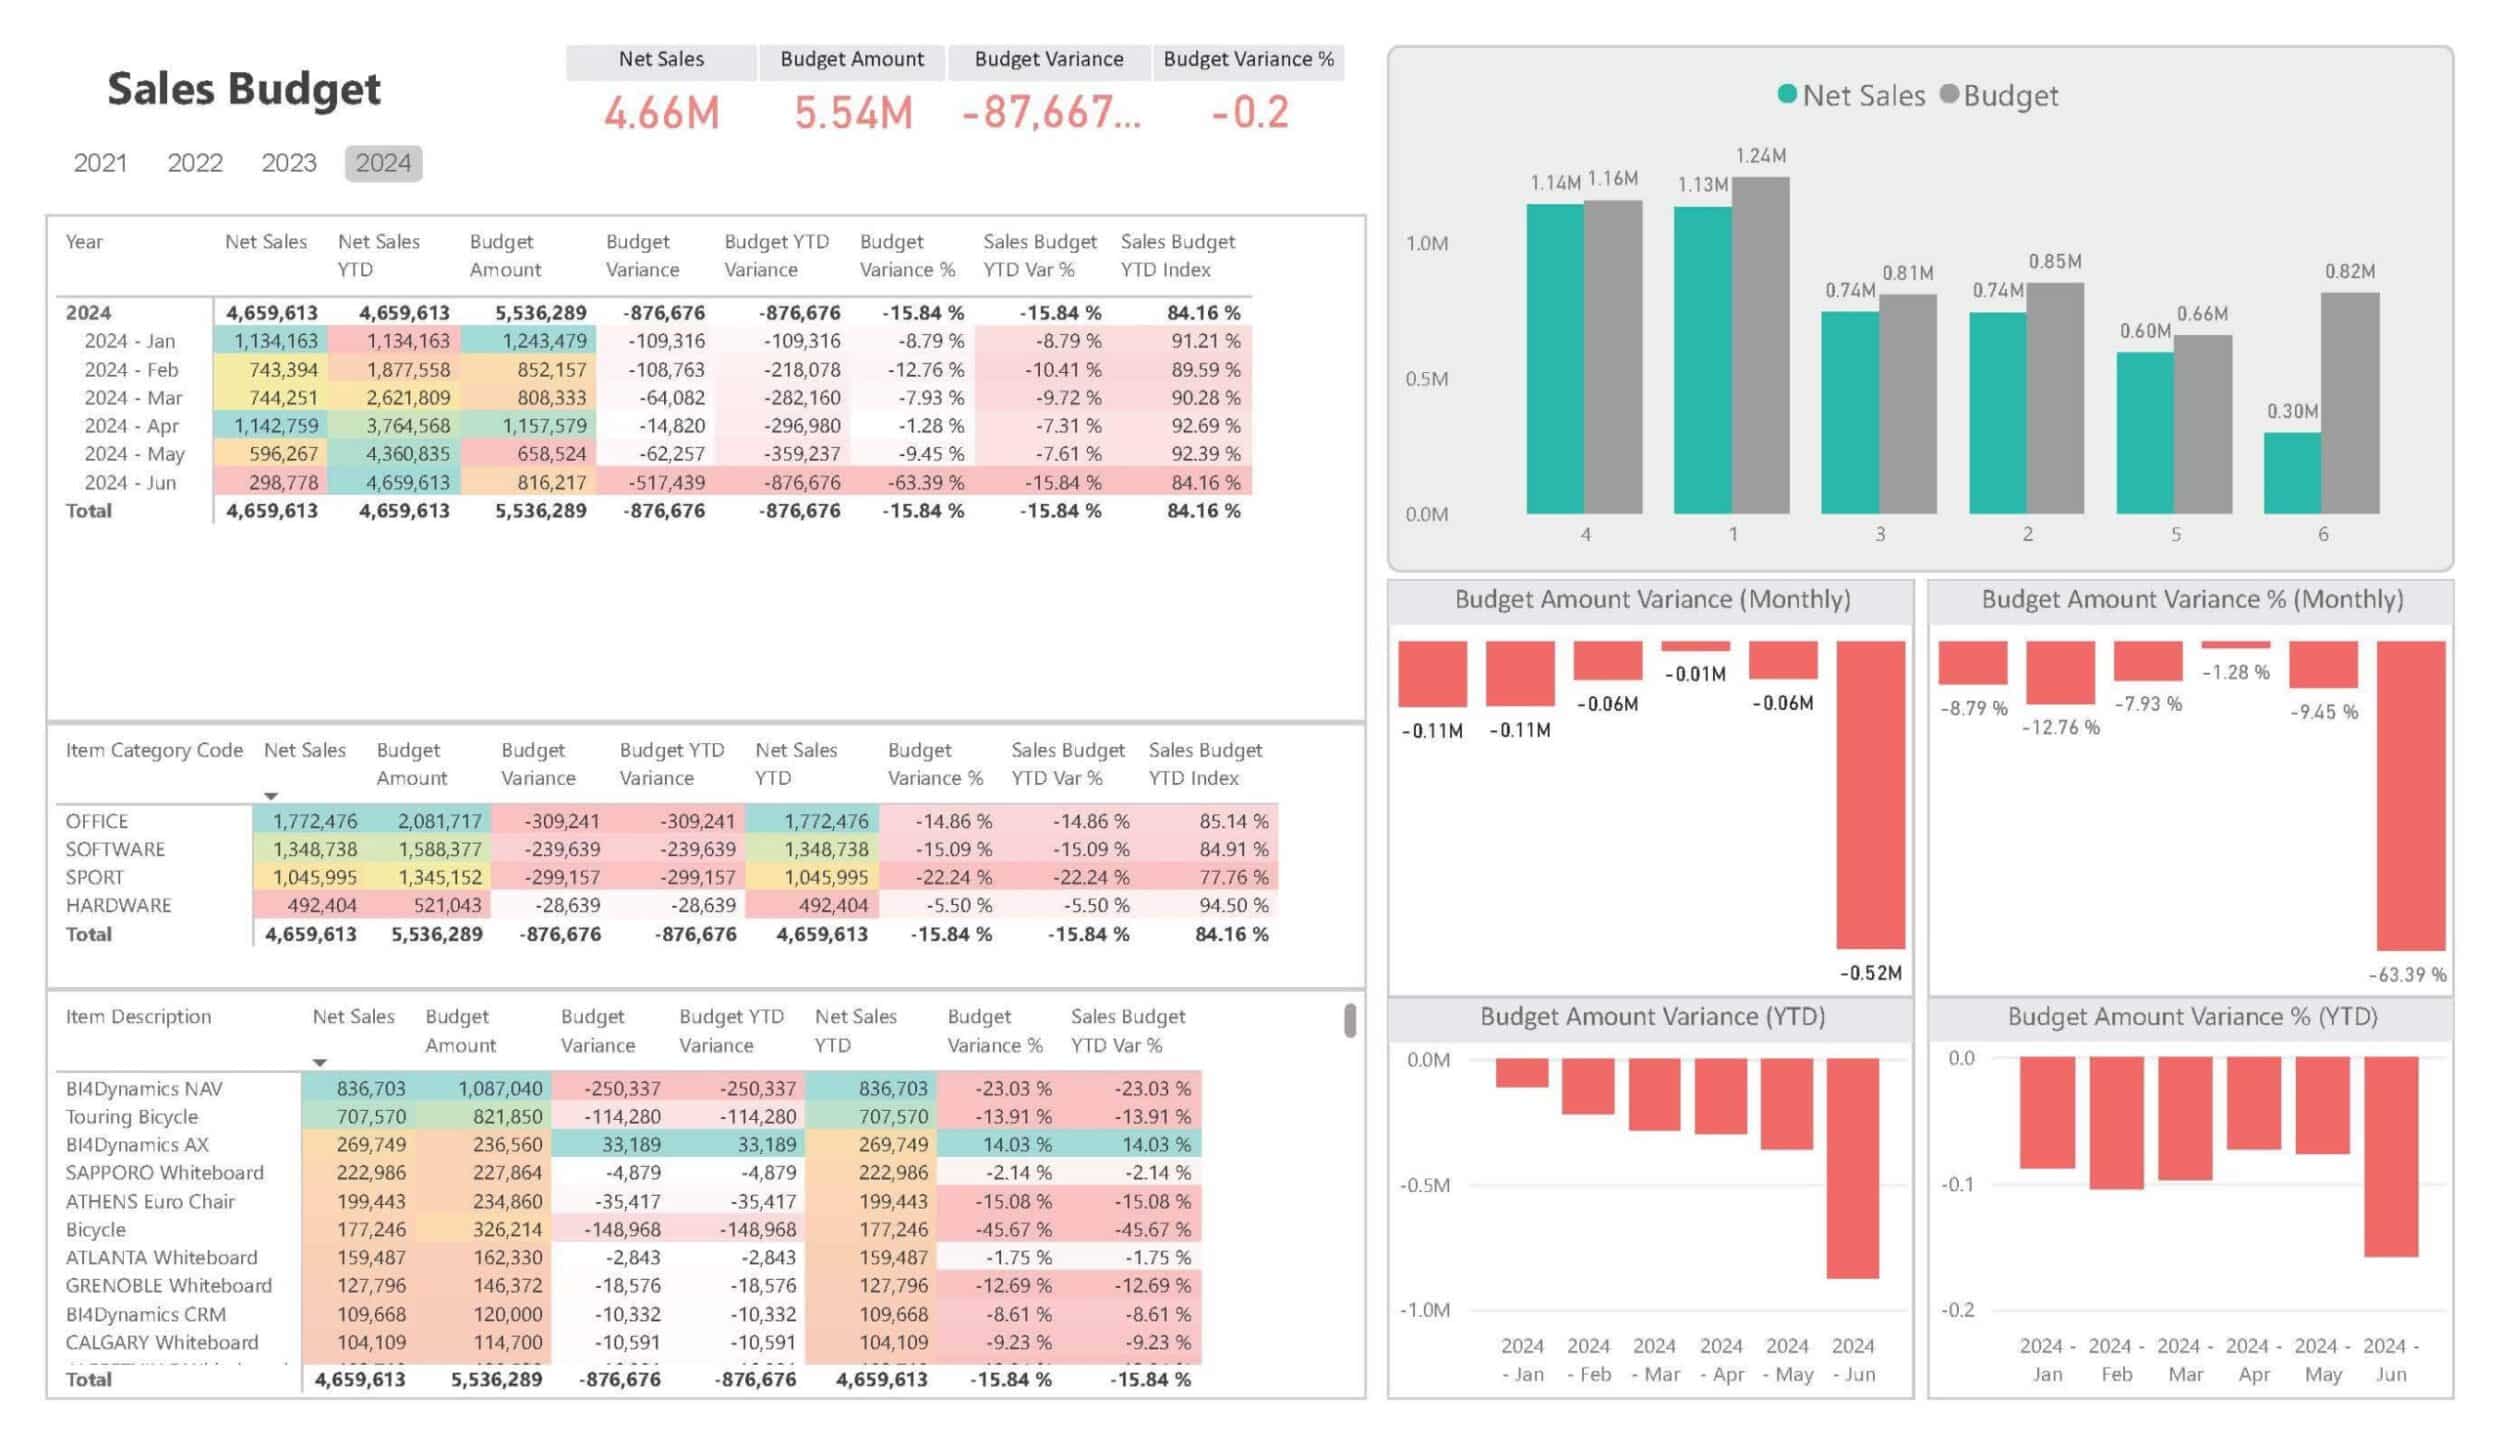
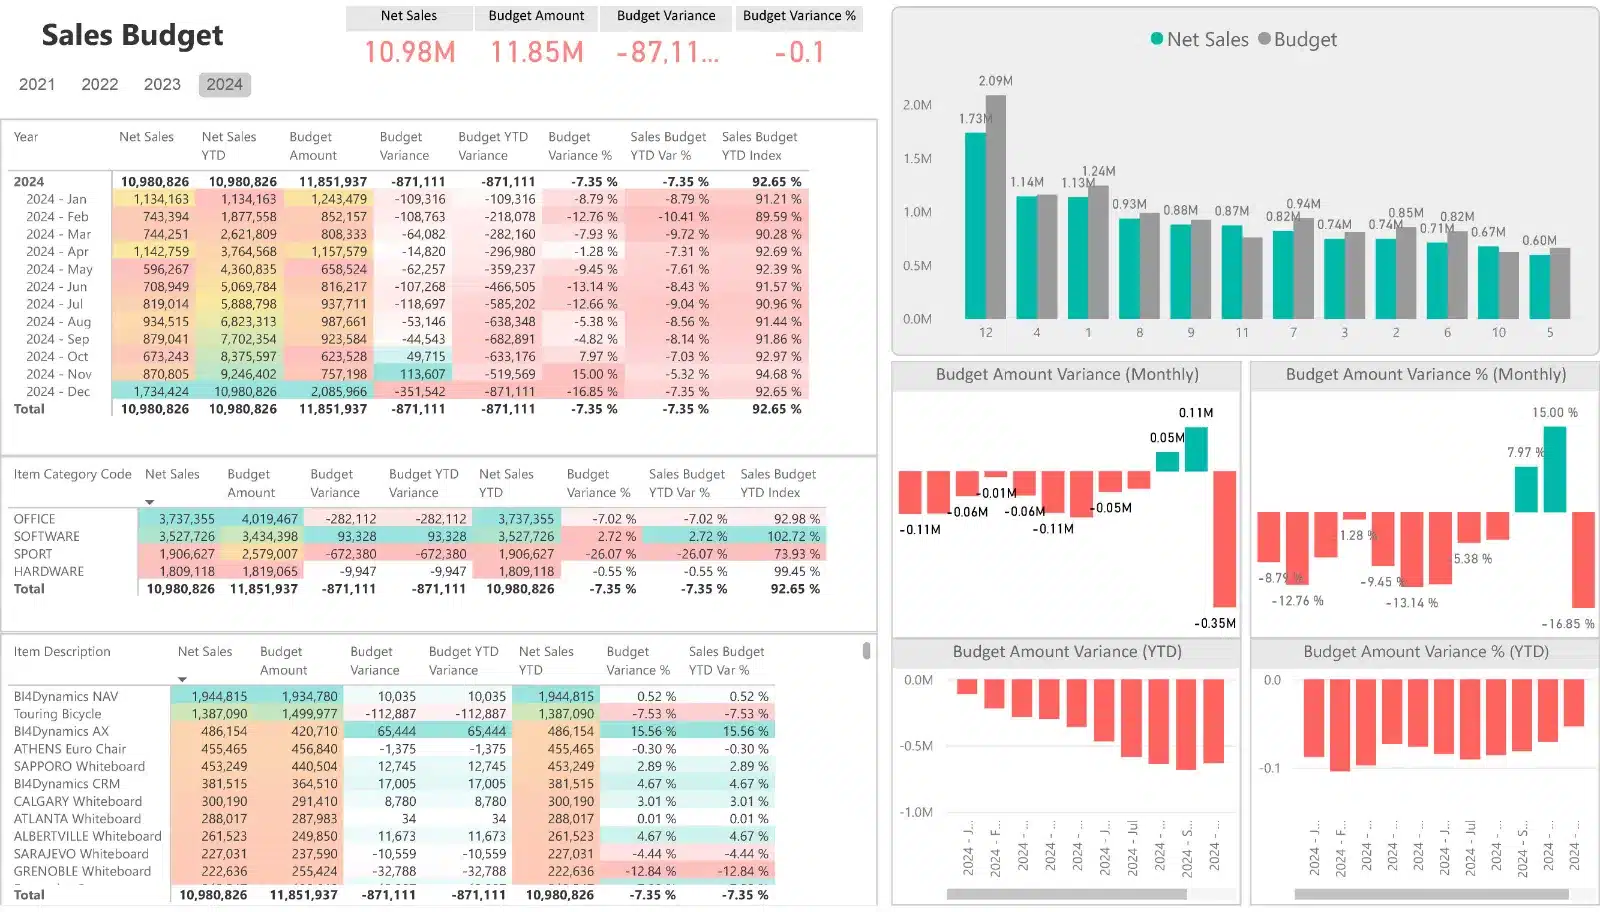
Sales Budget and Performance Analysis Dashboard for Microsoft Dynamics Power BI
This dashboard presents a comparison of budgeted vs. actual sales, allowing businesses to track performance against sales targets, evaluate variances, and optimize budgeting strategies.
What It Does/Offers:
- Shows net sales vs. budget amount with variance metrics, helping evaluate performance against sales targets.
- Tracks budget YTD variance and index, providing insights into how current sales compare with the projected budget.
- Budget variance metrics by item category and item description, allowing detailed analysis of which items are over- or under-performing against the budget.
- Visual breakdown of budget amount variance (monthly and YTD) to identify trends and address budget discrepancies.
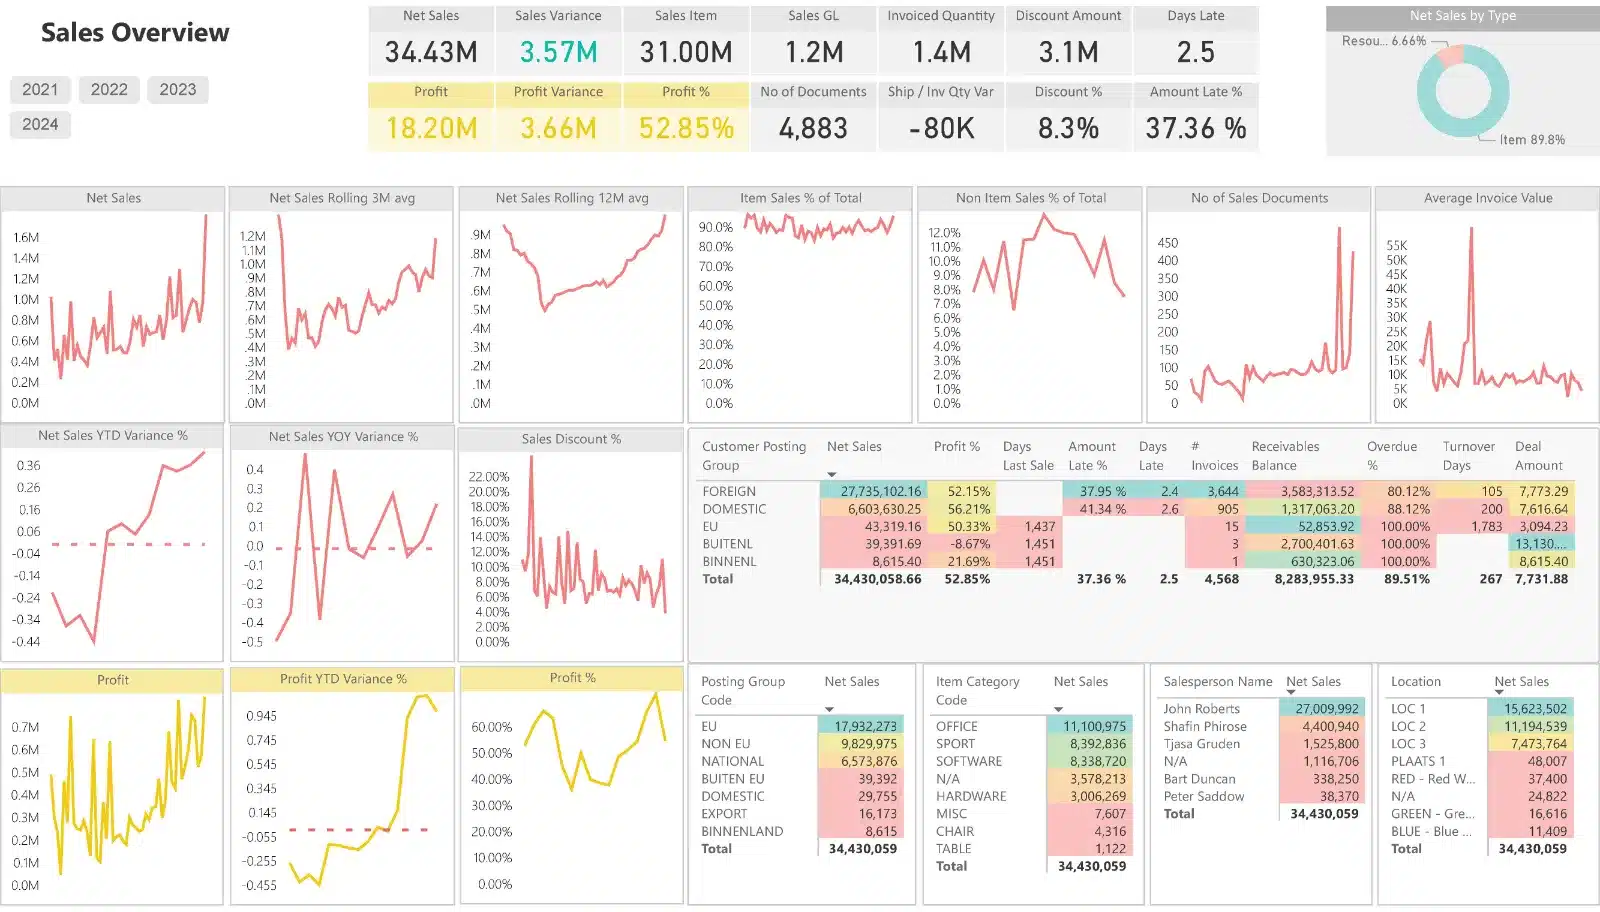
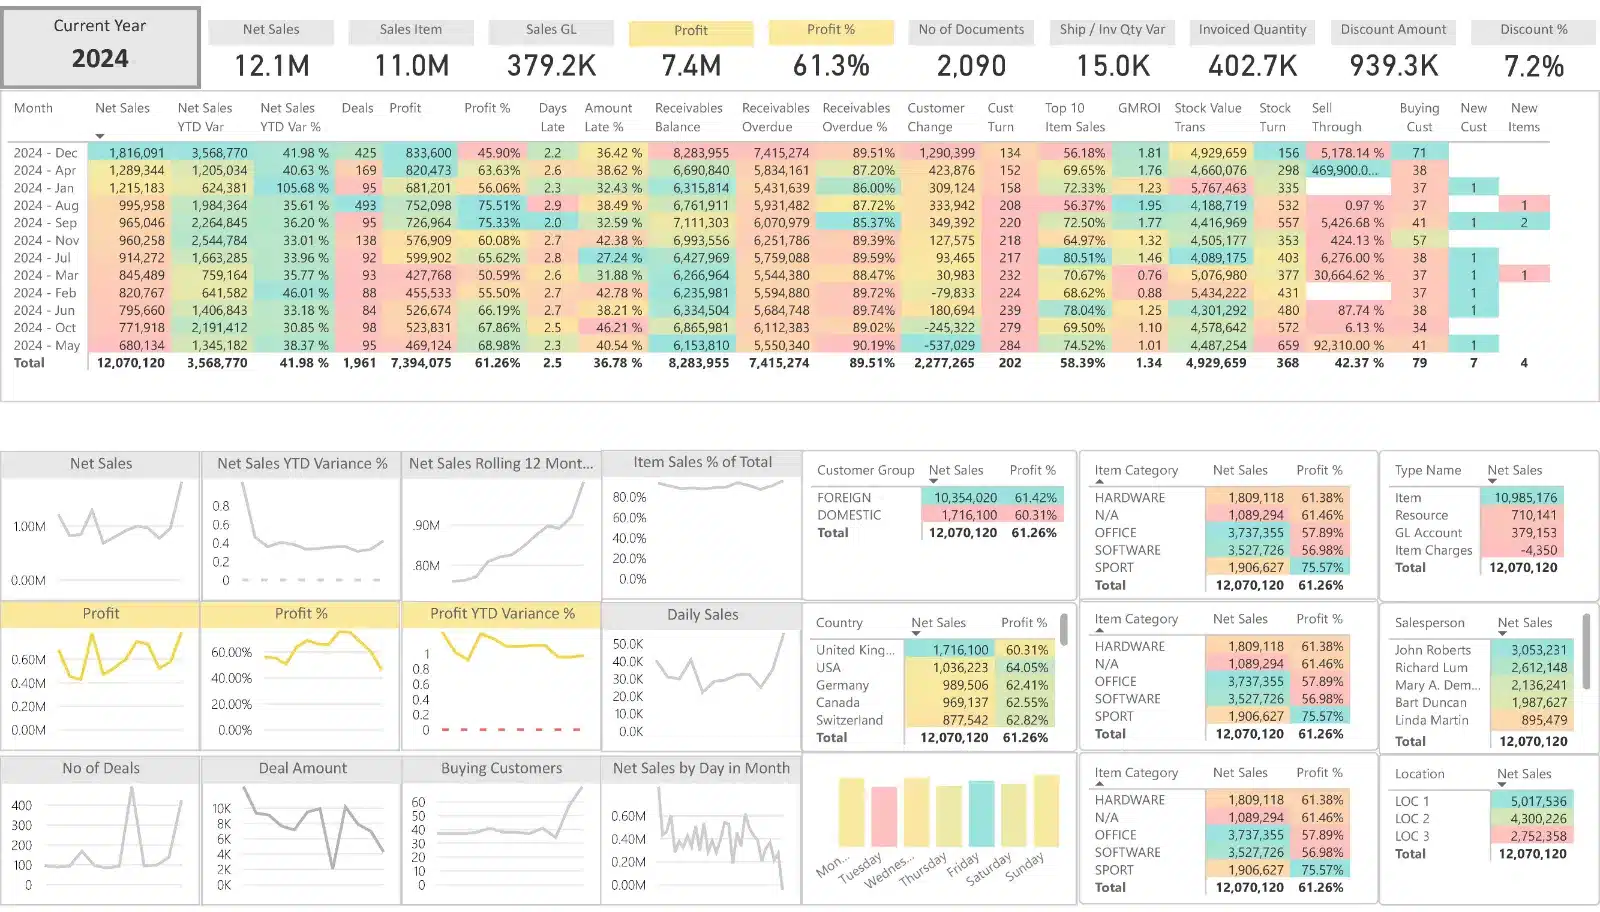
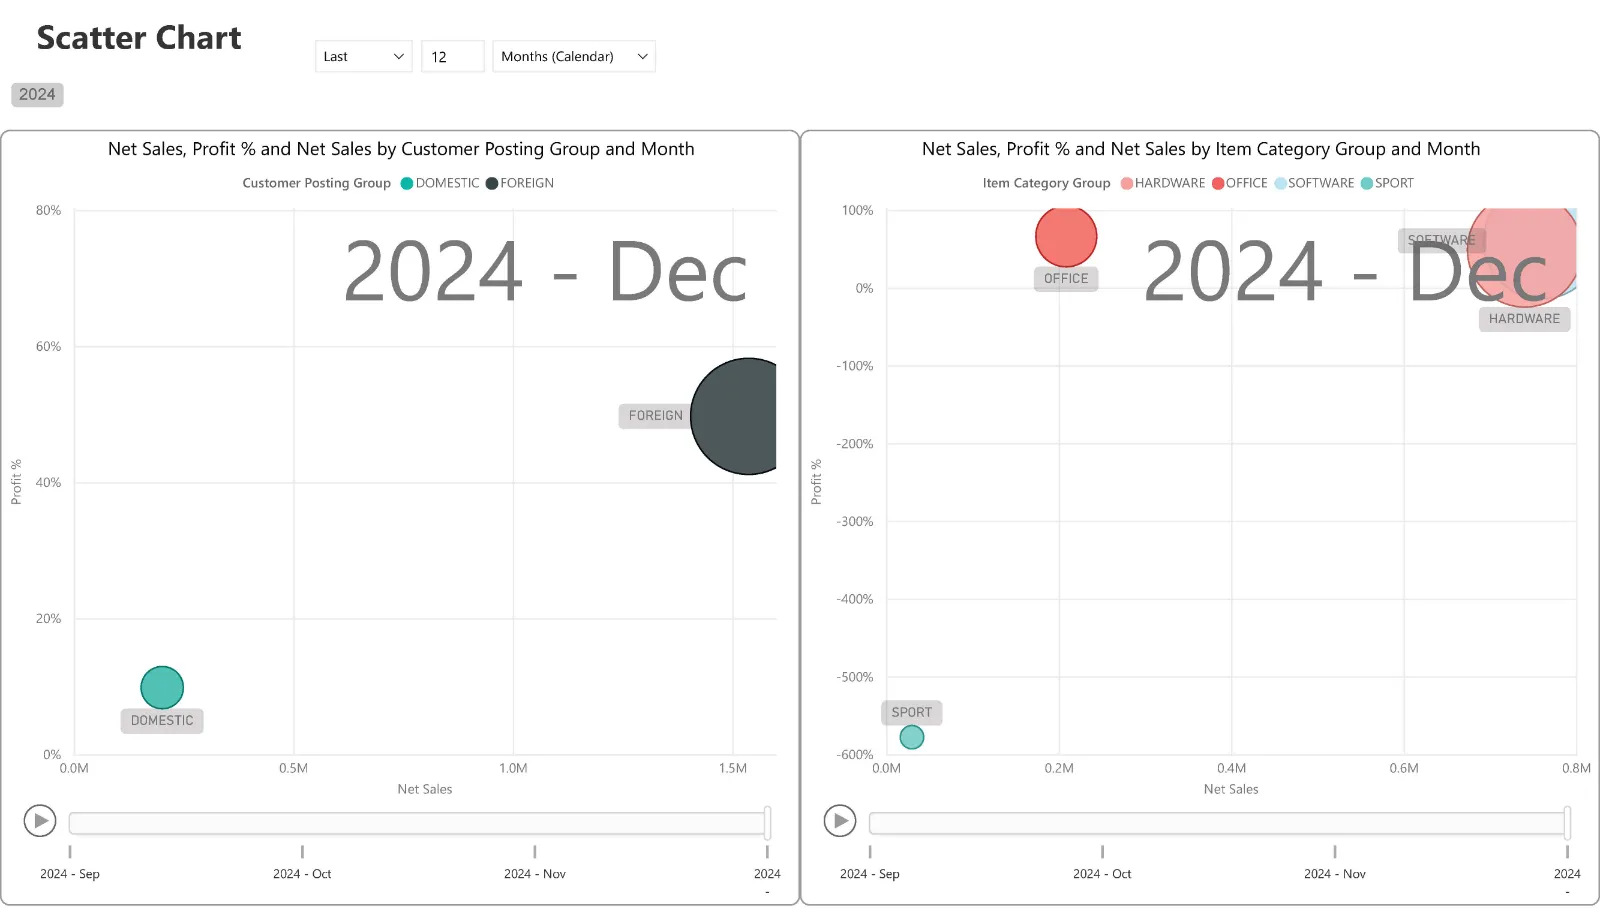
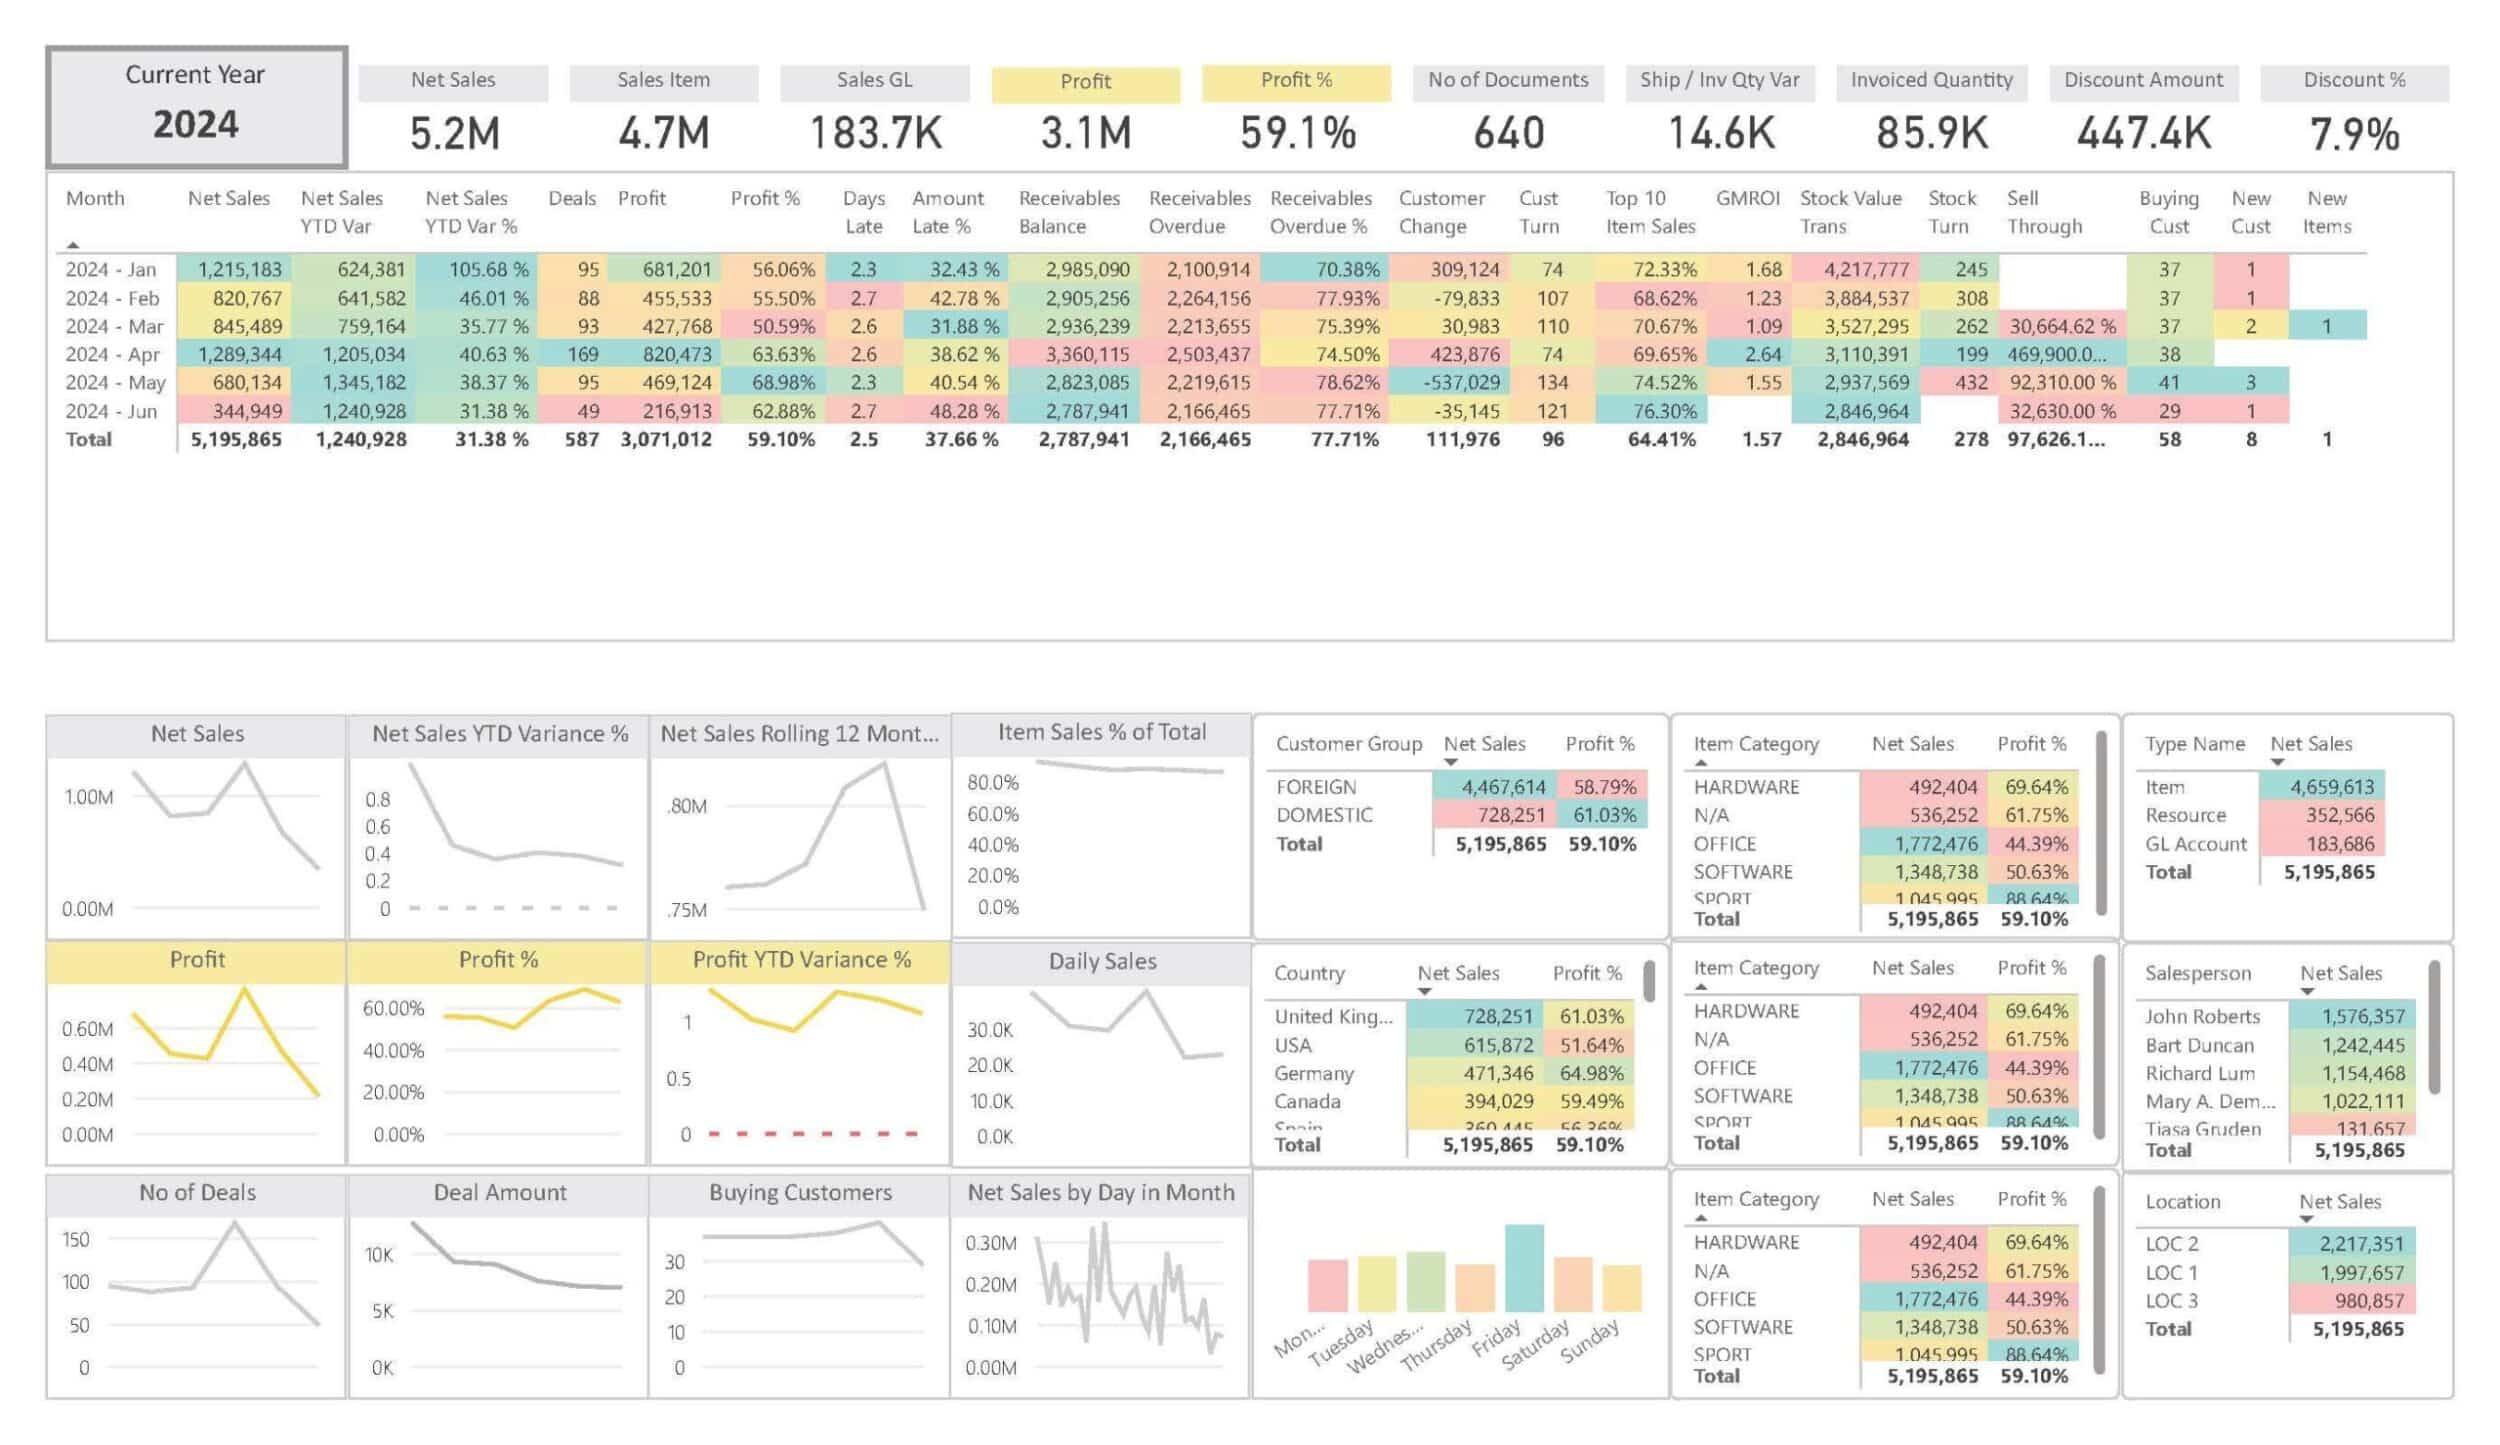
Current Year Sales and Profit Analysis by Customer Group for Microsoft Dynamics
This dashboard provides a snapshot of sales performance for the current year, with a focus on profit, customer segmentation, and sales group analysis, helping businesses track ongoing performance.
What It Does/Offers:
- Displays net sales, profit, and profit variance for the current year, offering insights into ongoing sales success.
- Breakdown by customer group (foreign vs. domestic), showing contribution to overall sales and profit.
- Tracks monthly sales trends with metrics like YTD variance and profit percentage, giving a clear view of progress throughout the year.
- Shows top-performing item categories, item types, and salesperson performance, helping optimize focus areas for better results.
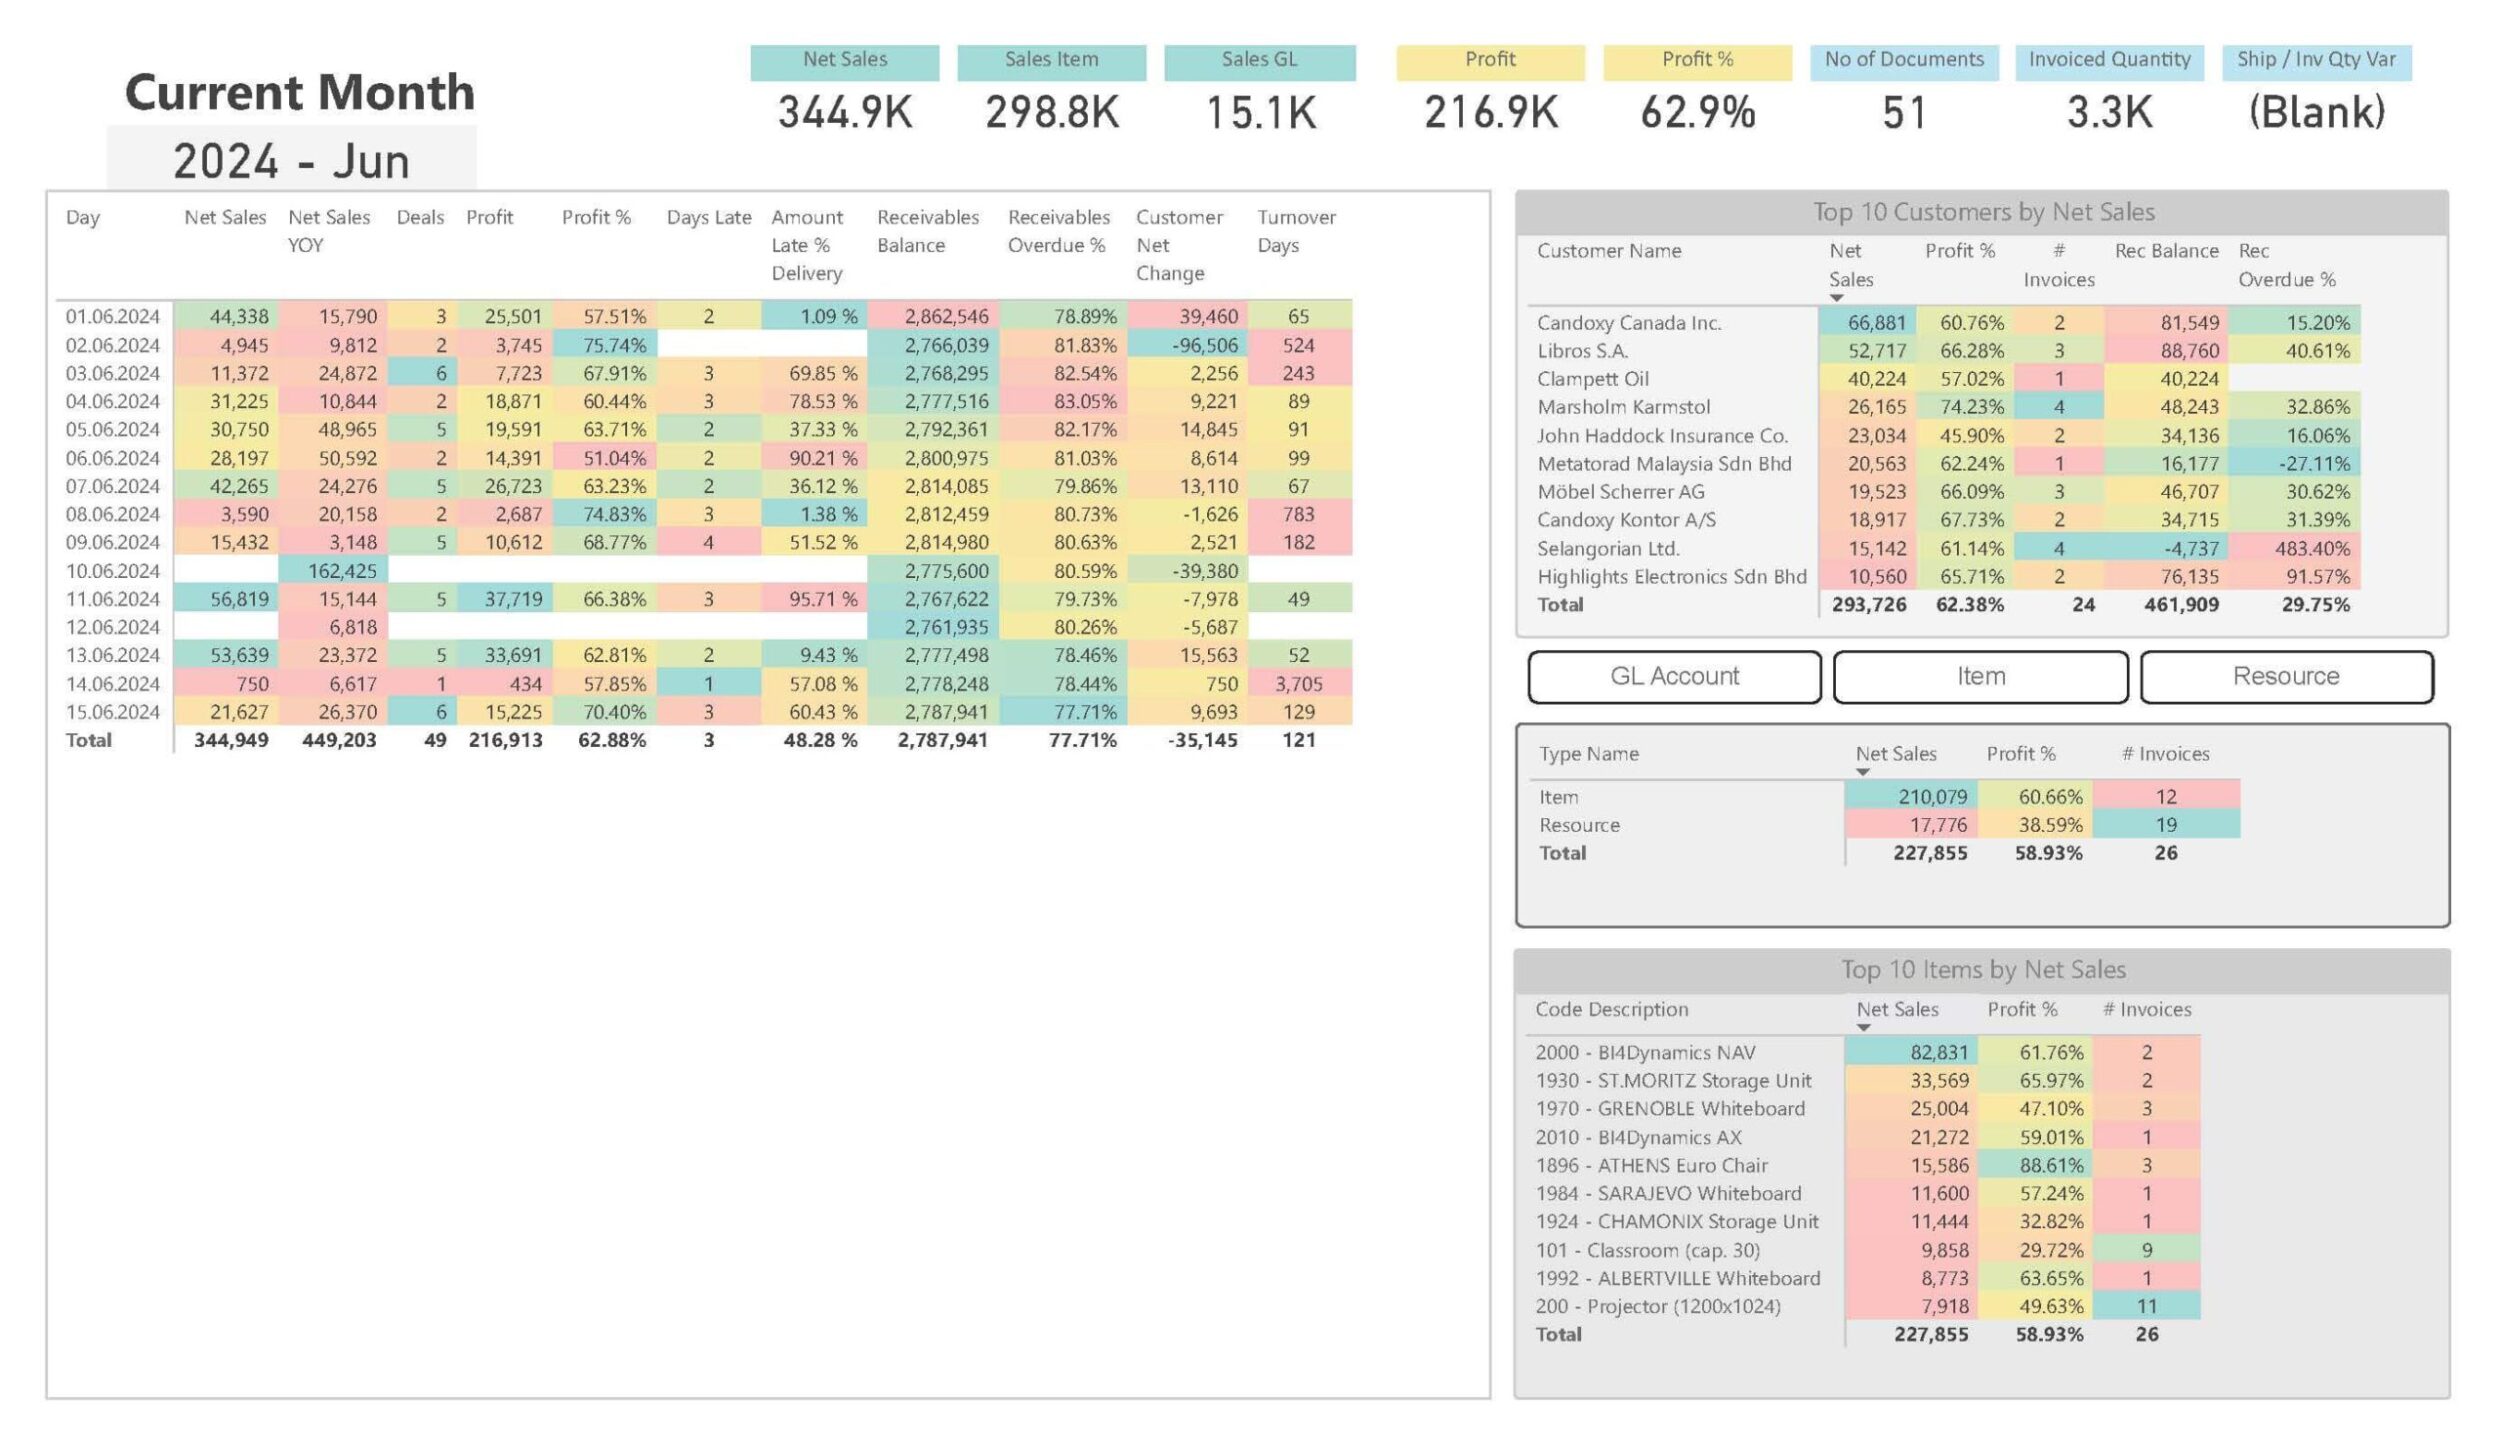
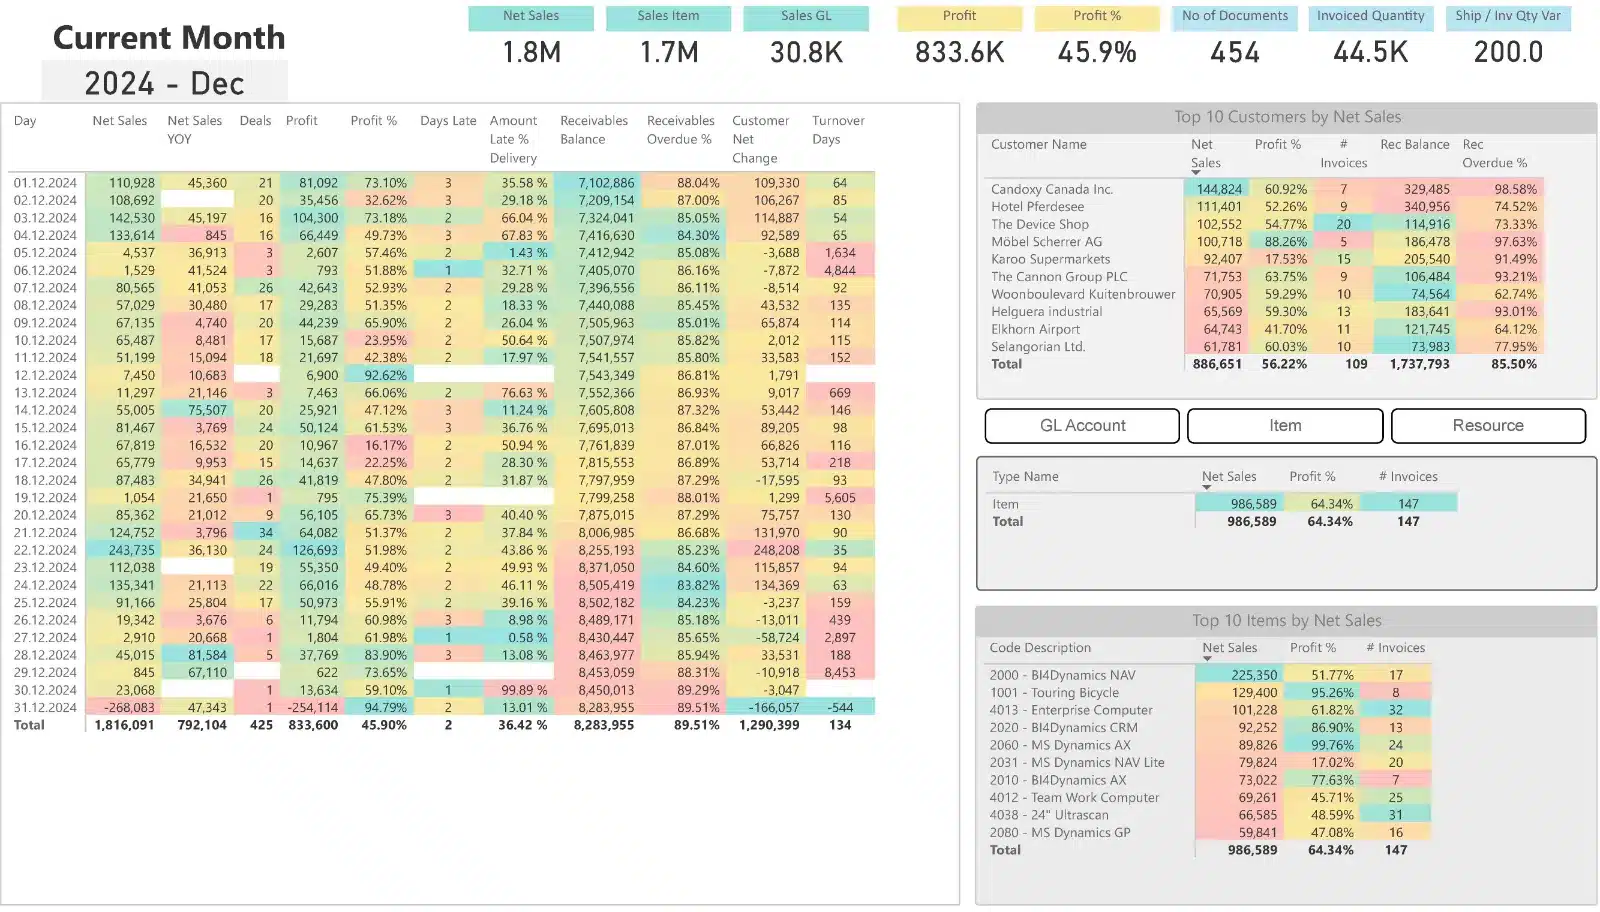
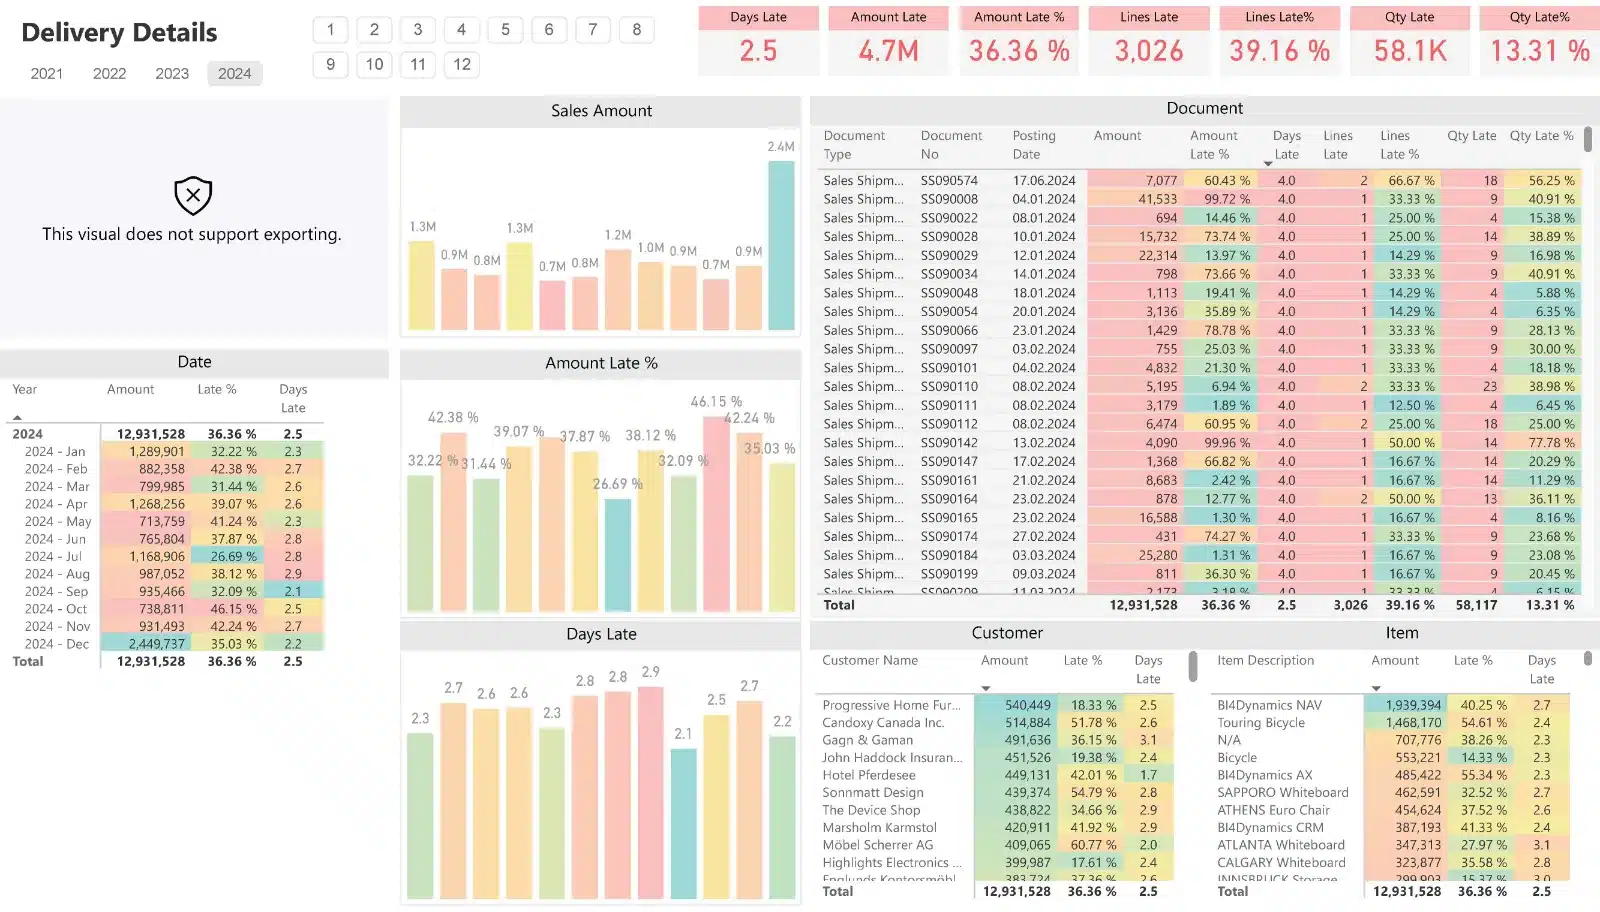
Current Month Sales Analysis Dashboard for Microsoft Dynamics Power BI
This Power BI dashboard provides a day-by-day breakdown of sales metrics for the current month, offering real-time insights into sales activities, customer changes, and top-performing items.
What It Does/Offers:
- Daily net sales, profit, and profit percentage for a detailed view of ongoing monthly sales performance.
- Tracks metrics like receivables balance, overdue percentage, and customer changes to maintain financial health.
- Provides a list of top customers by net sales, giving a clear picture of the most valuable clients.
- Breakdown by item type and code description, identifying the best-selling items and profit contributors during the month.
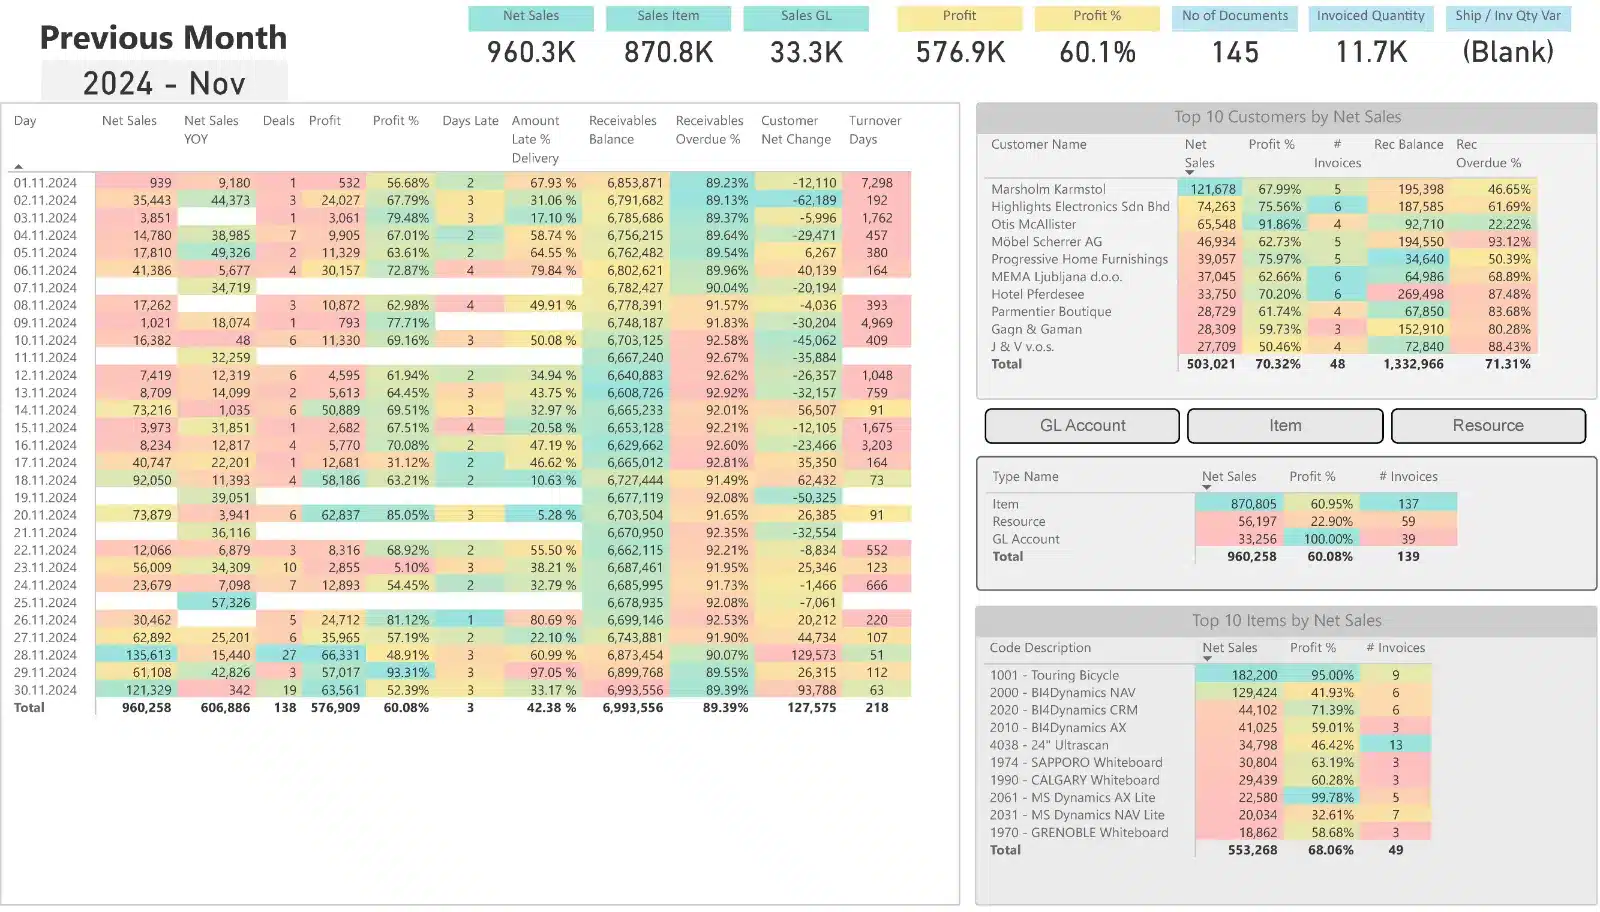
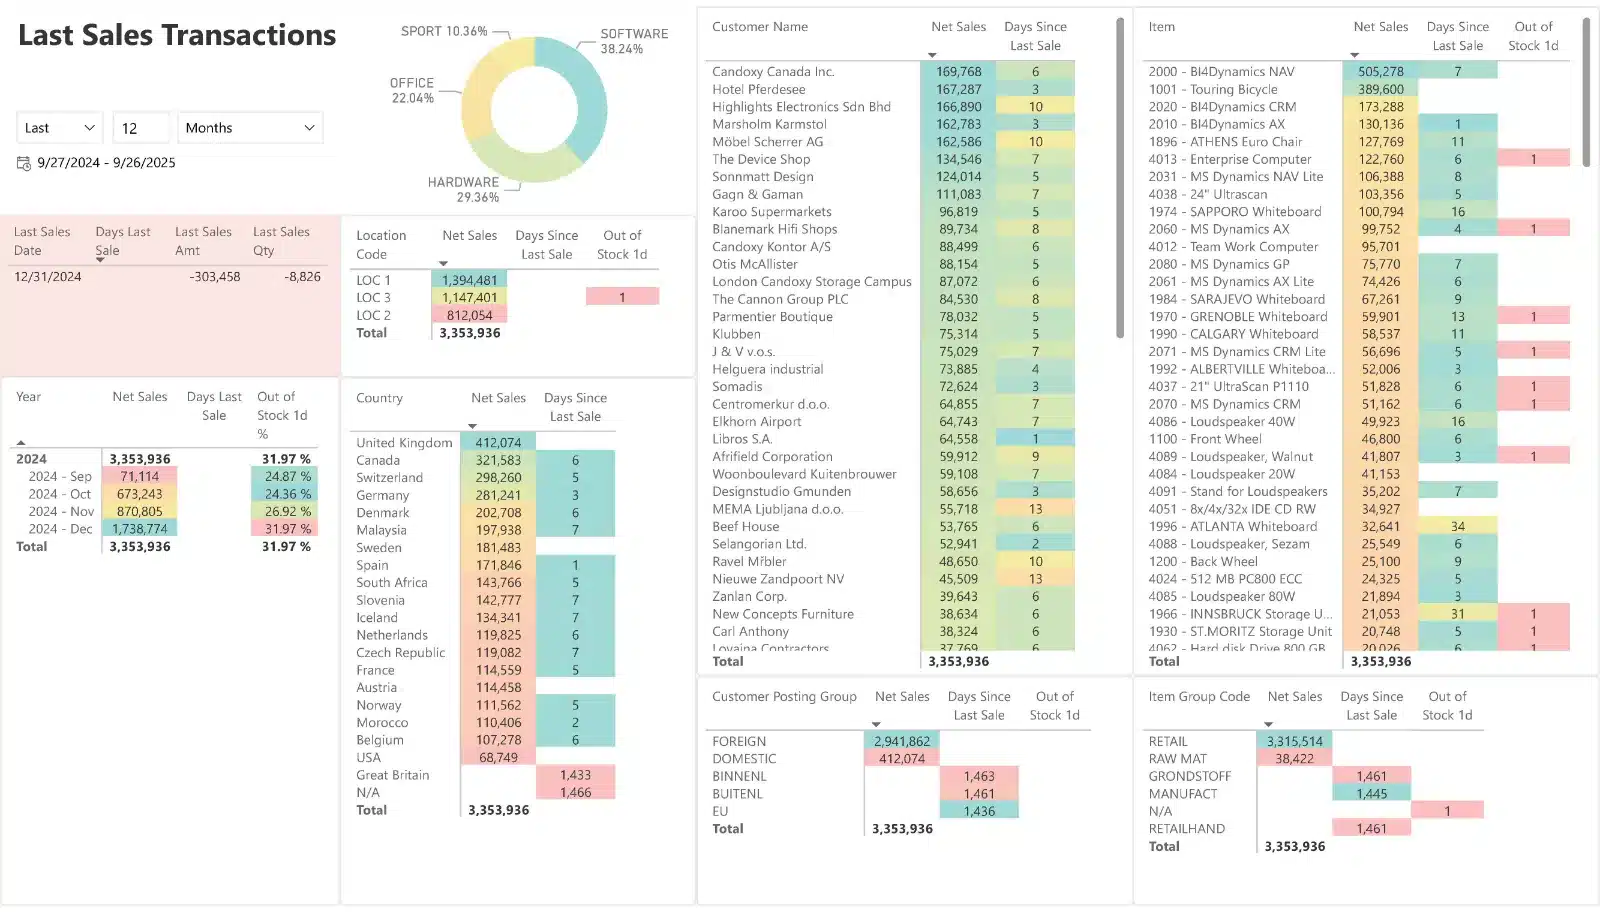
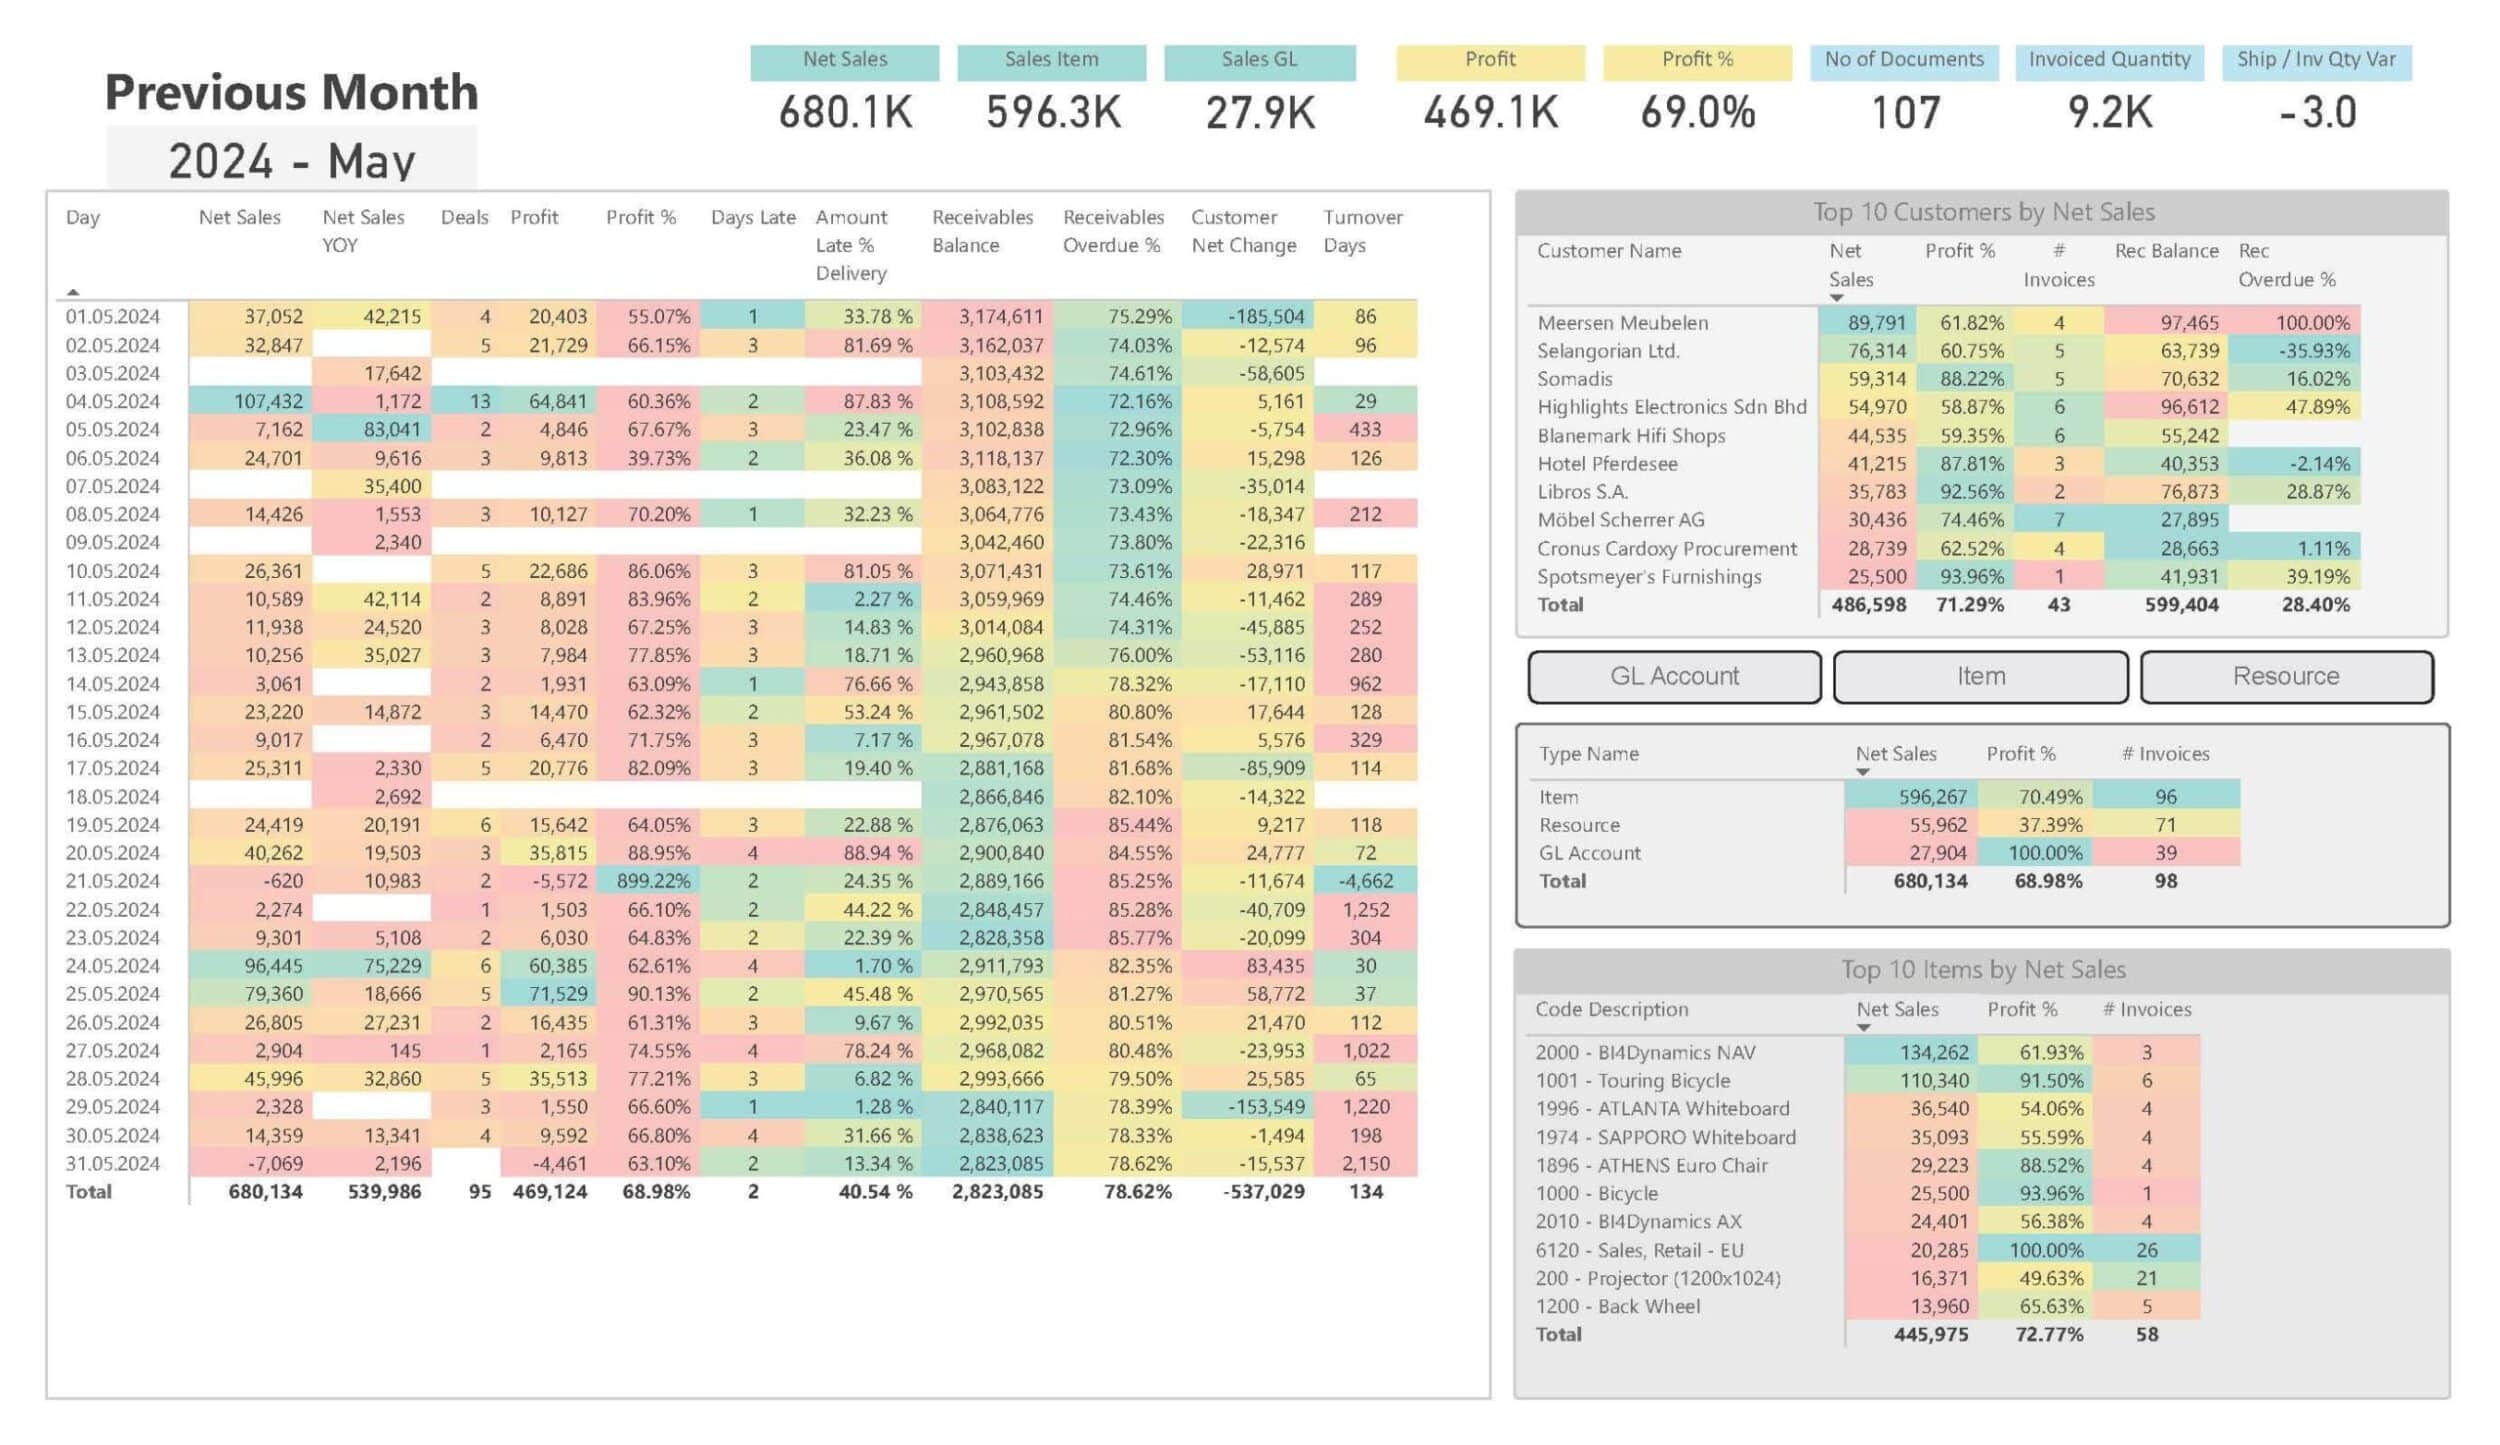
Previous Month Sales Analysis Dashboard for Microsoft Dynamics Power BI
This dashboard provides a complete overview of sales activities for the previous month, including metrics on sales, profit, receivables, and top customers, helping to reflect on past performance.
What It Does/Offers:
- Day-wise net sales, profit, and profit percentage for the entire previous month, helping businesses evaluate historical performance.
- Tracks amount late in delivery, receivables balance, and overdue percentage to assess financial performance for the month.
- Top customers by net sales and profit, providing insights into key clients and their buying patterns.
- Top 10 items by net sales, highlighting the most successful products during the month and helping businesses plan inventory for the future.
Want to test BI4Dynamics?
We offer 30-day no-obligation free trial!
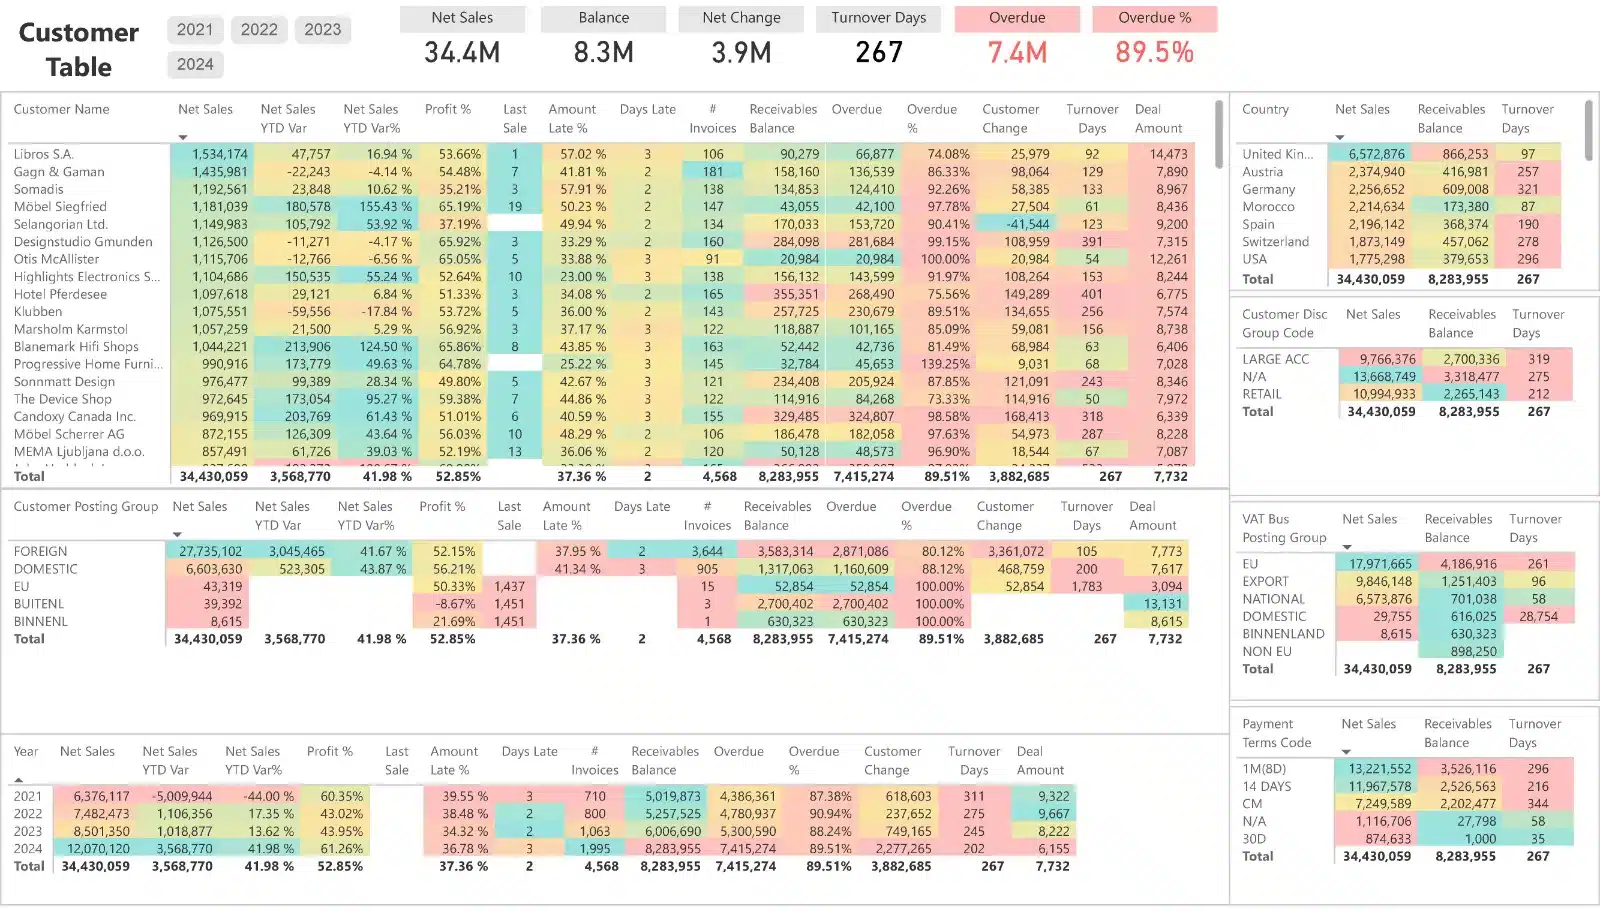
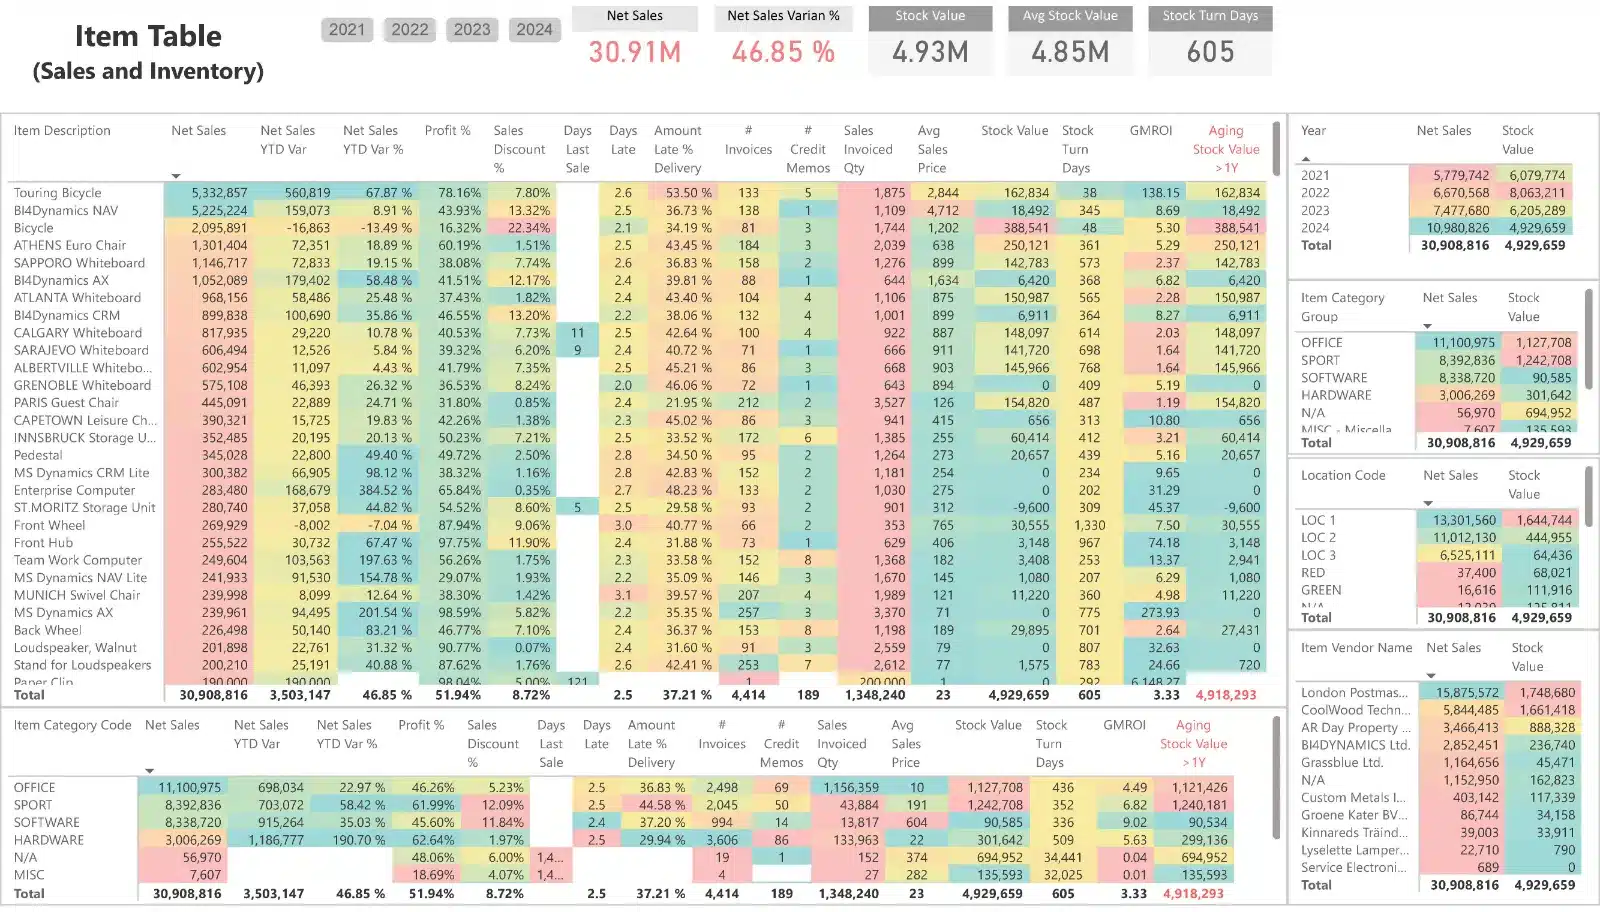
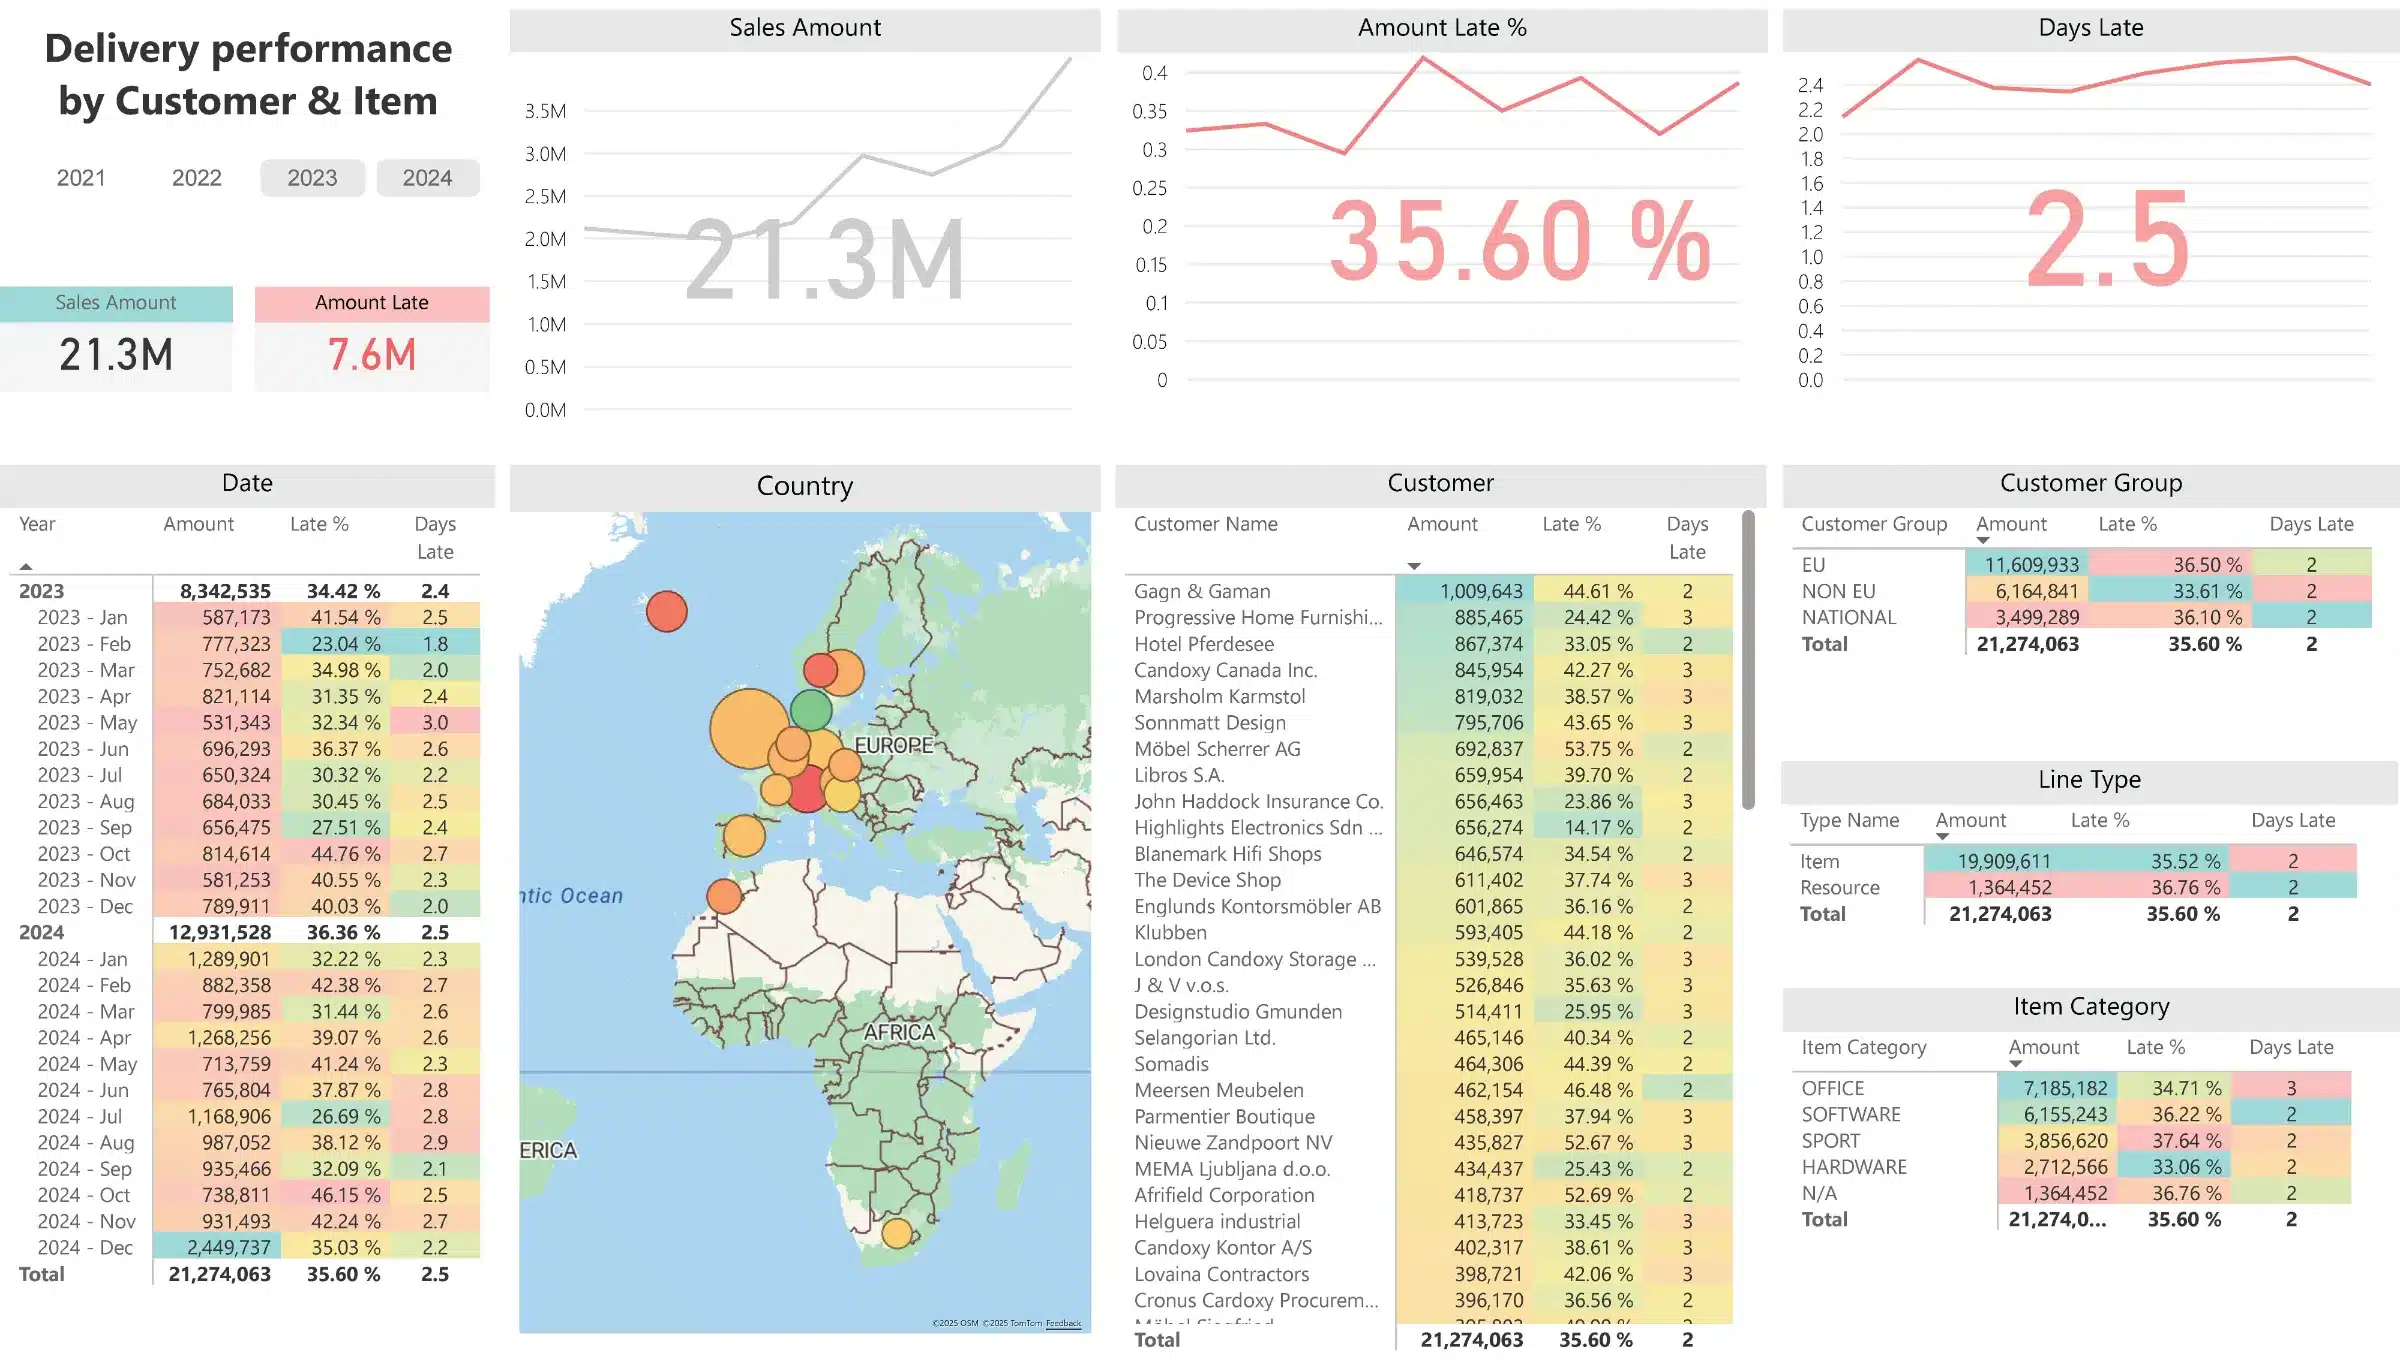
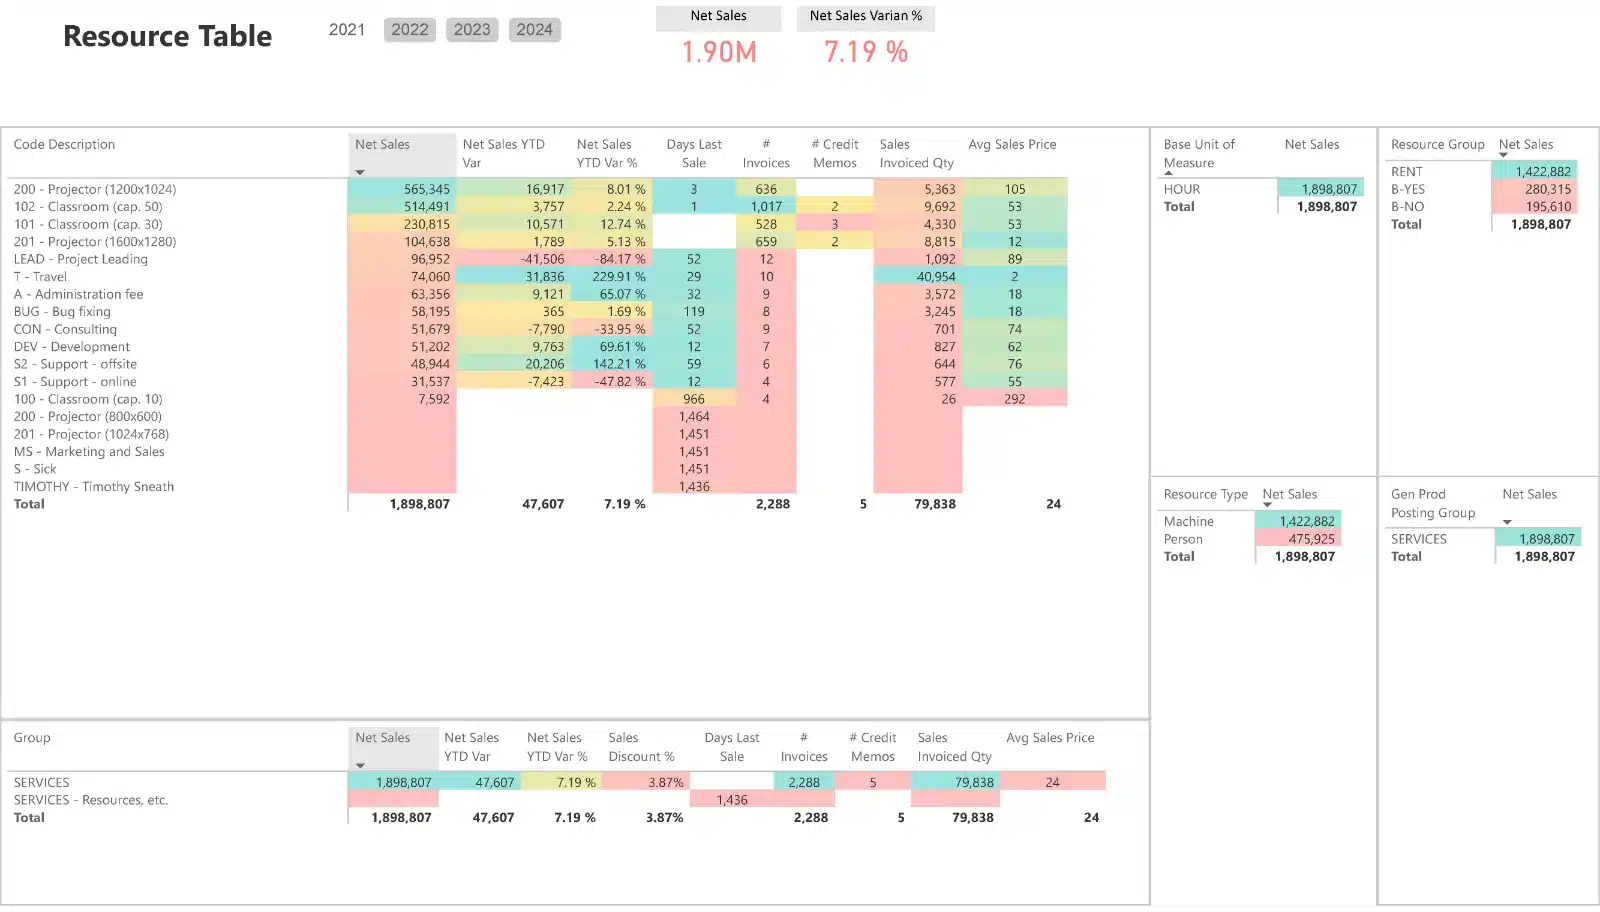
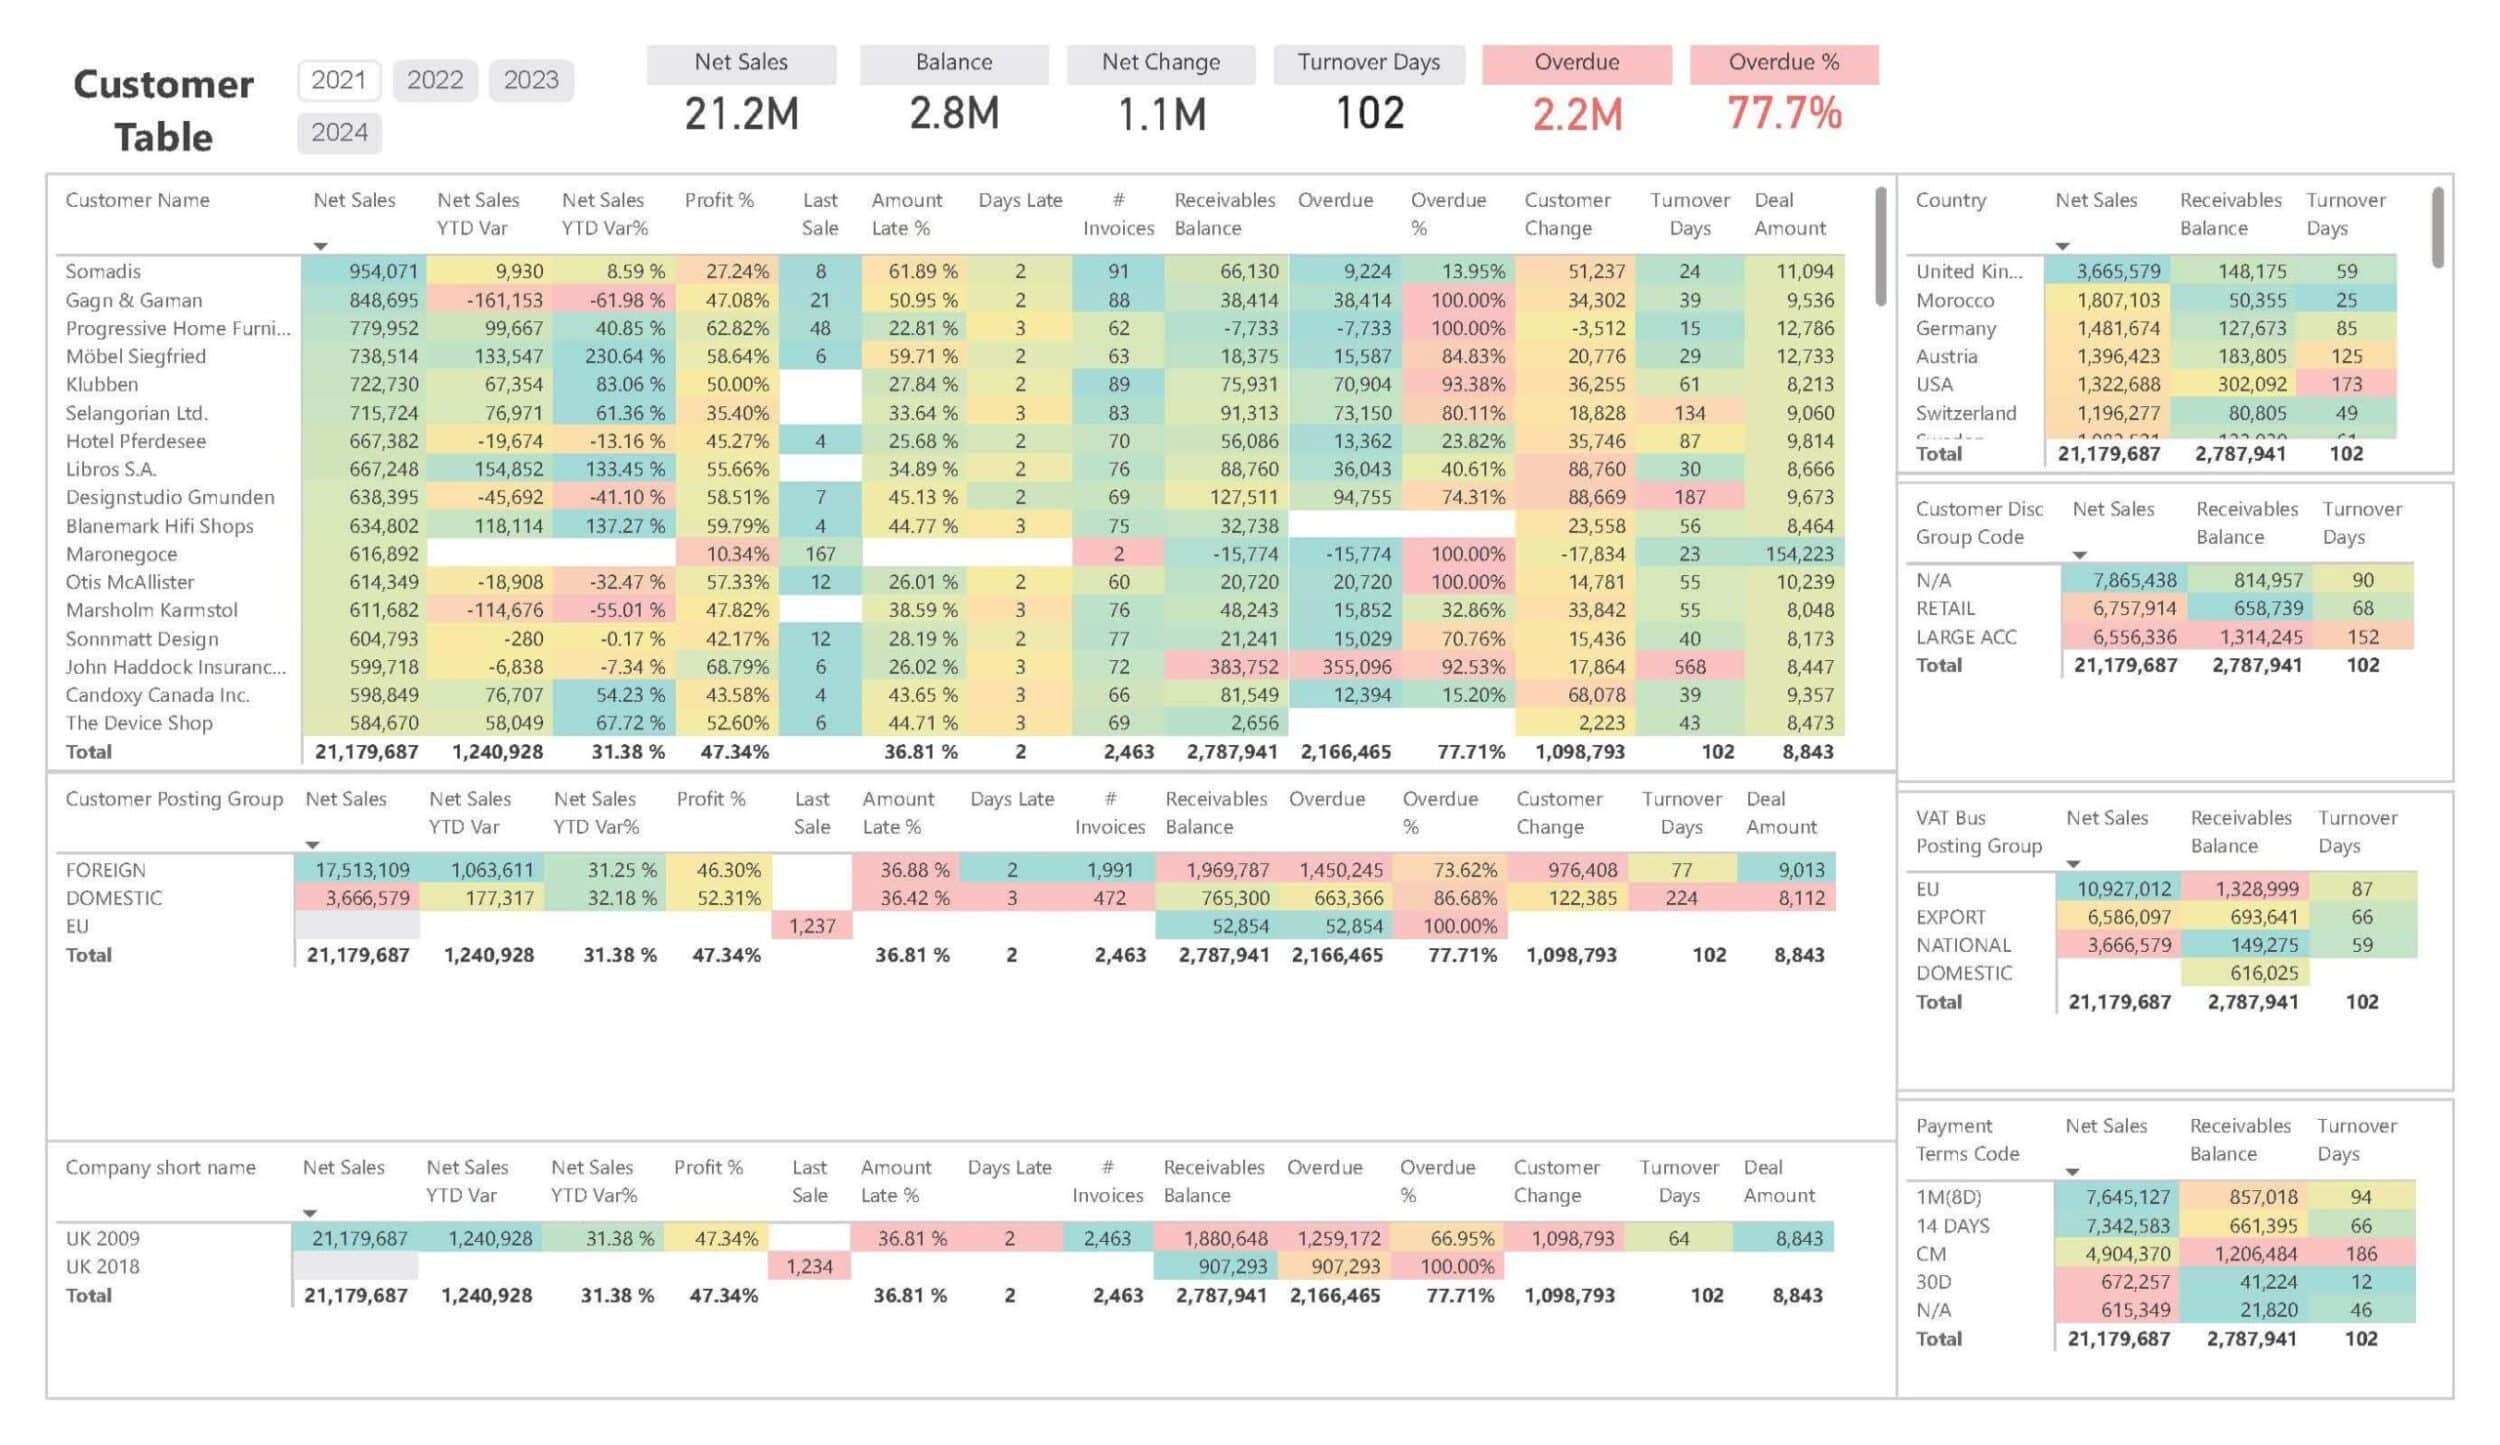
Customer Sales Table Dashboard for Microsoft Dynamics Power BI
This dashboard provides an aggregated overview of sales by customer, highlighting net sales, turnover, receivables, and overdue balances for informed decision-making regarding customer relationship management.
What It Does/Offers:
- Aggregated customer sales view, including metrics like net sales, profit percentage, and receivables.
- Insights into overdue balances and customer change to identify potential risks in collections.
- Overview of turnover days by customer, assisting in determining how fast sales are being converted to cash.
- Customer segmentation by country and customer group, providing valuable geographical insights into sales performance.
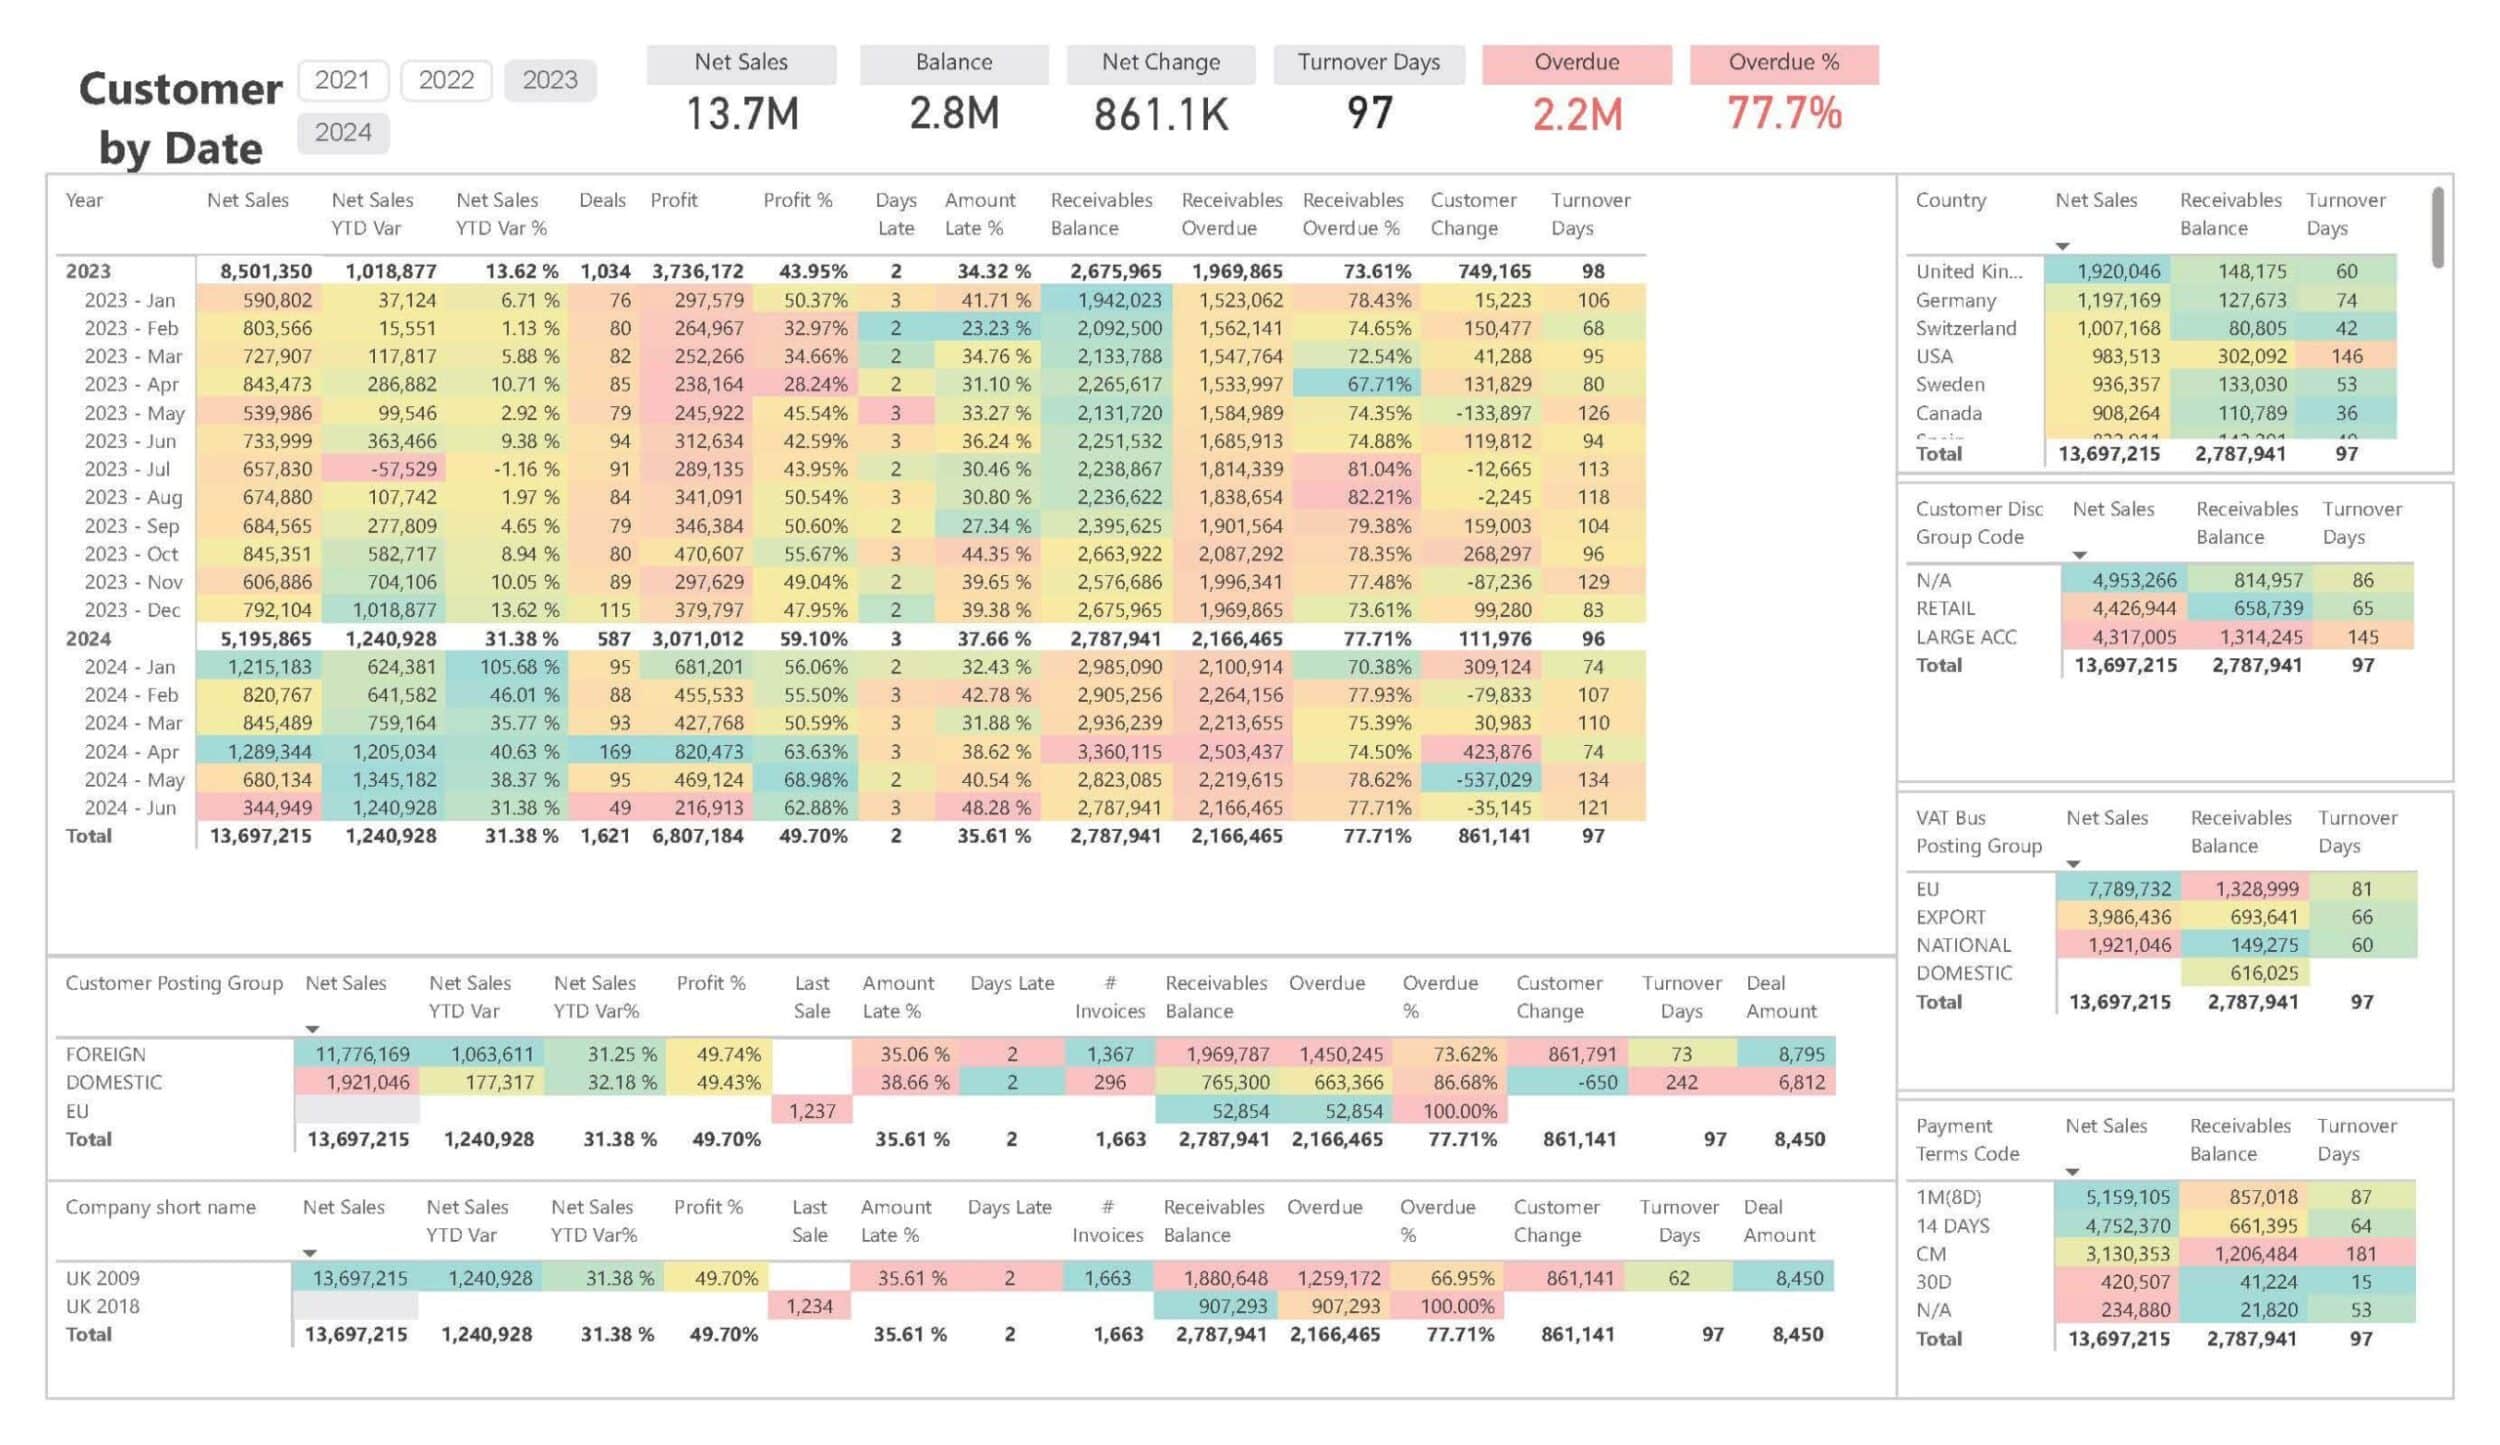
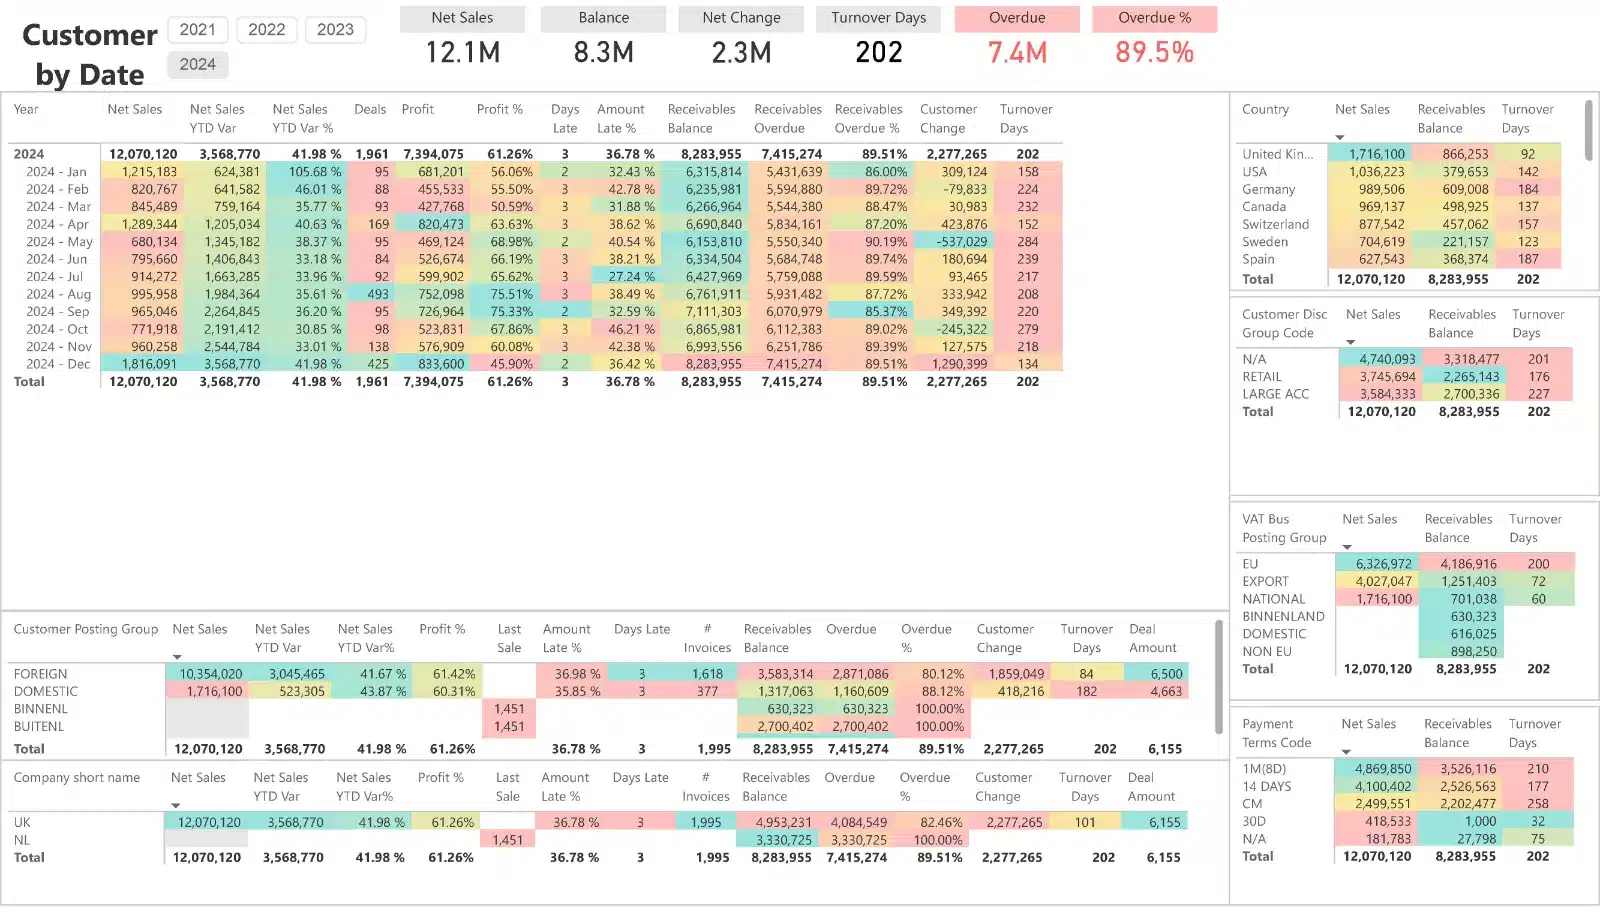
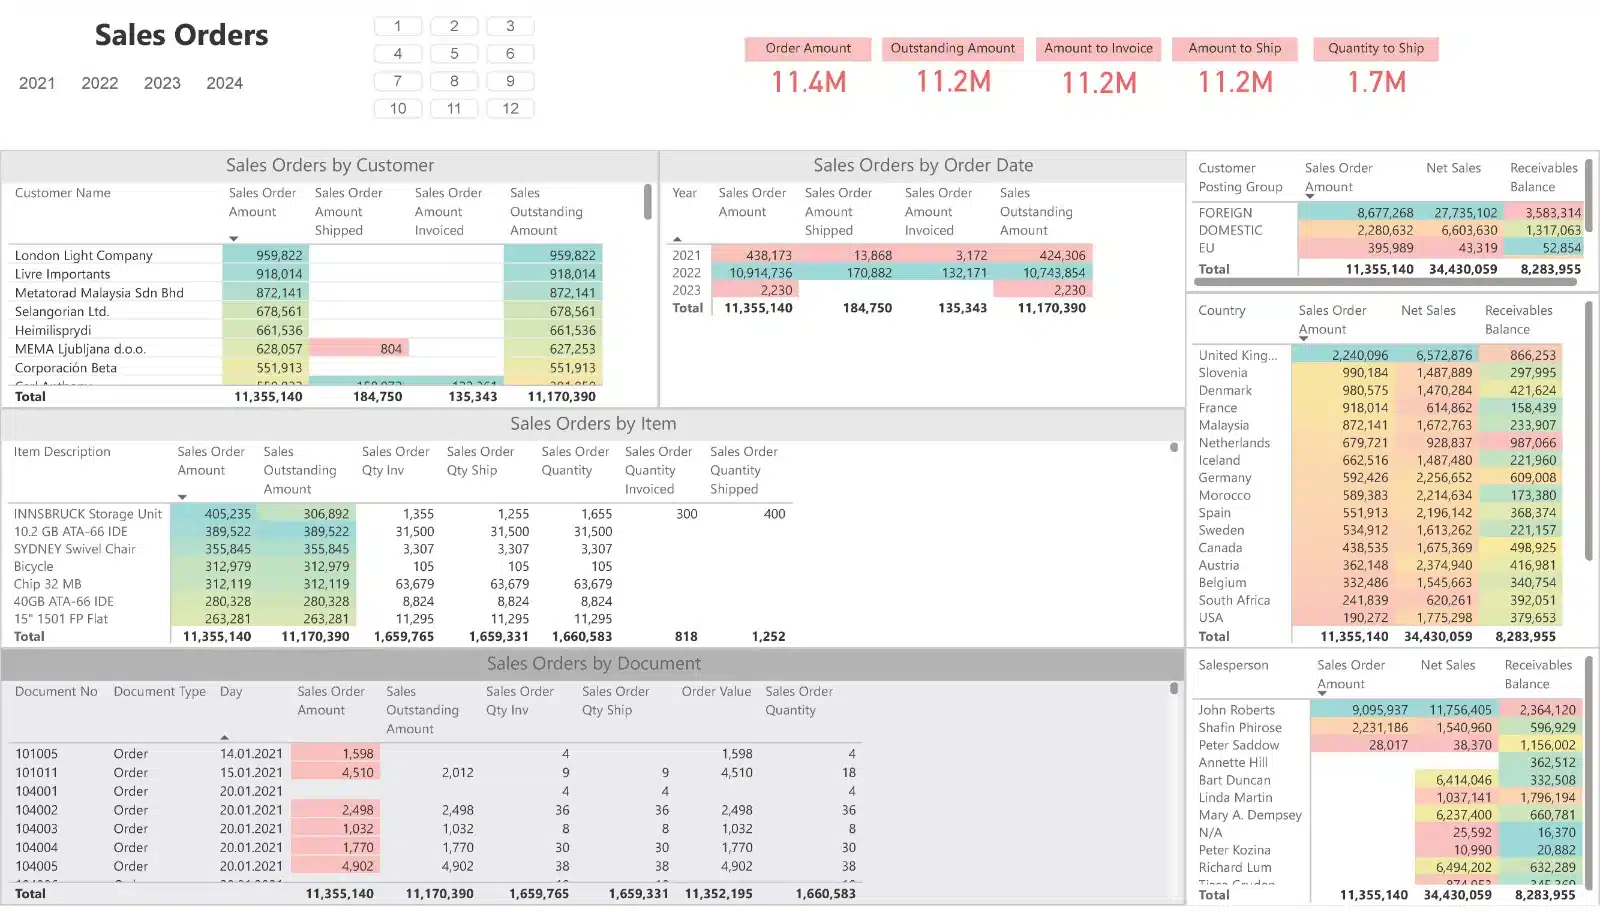
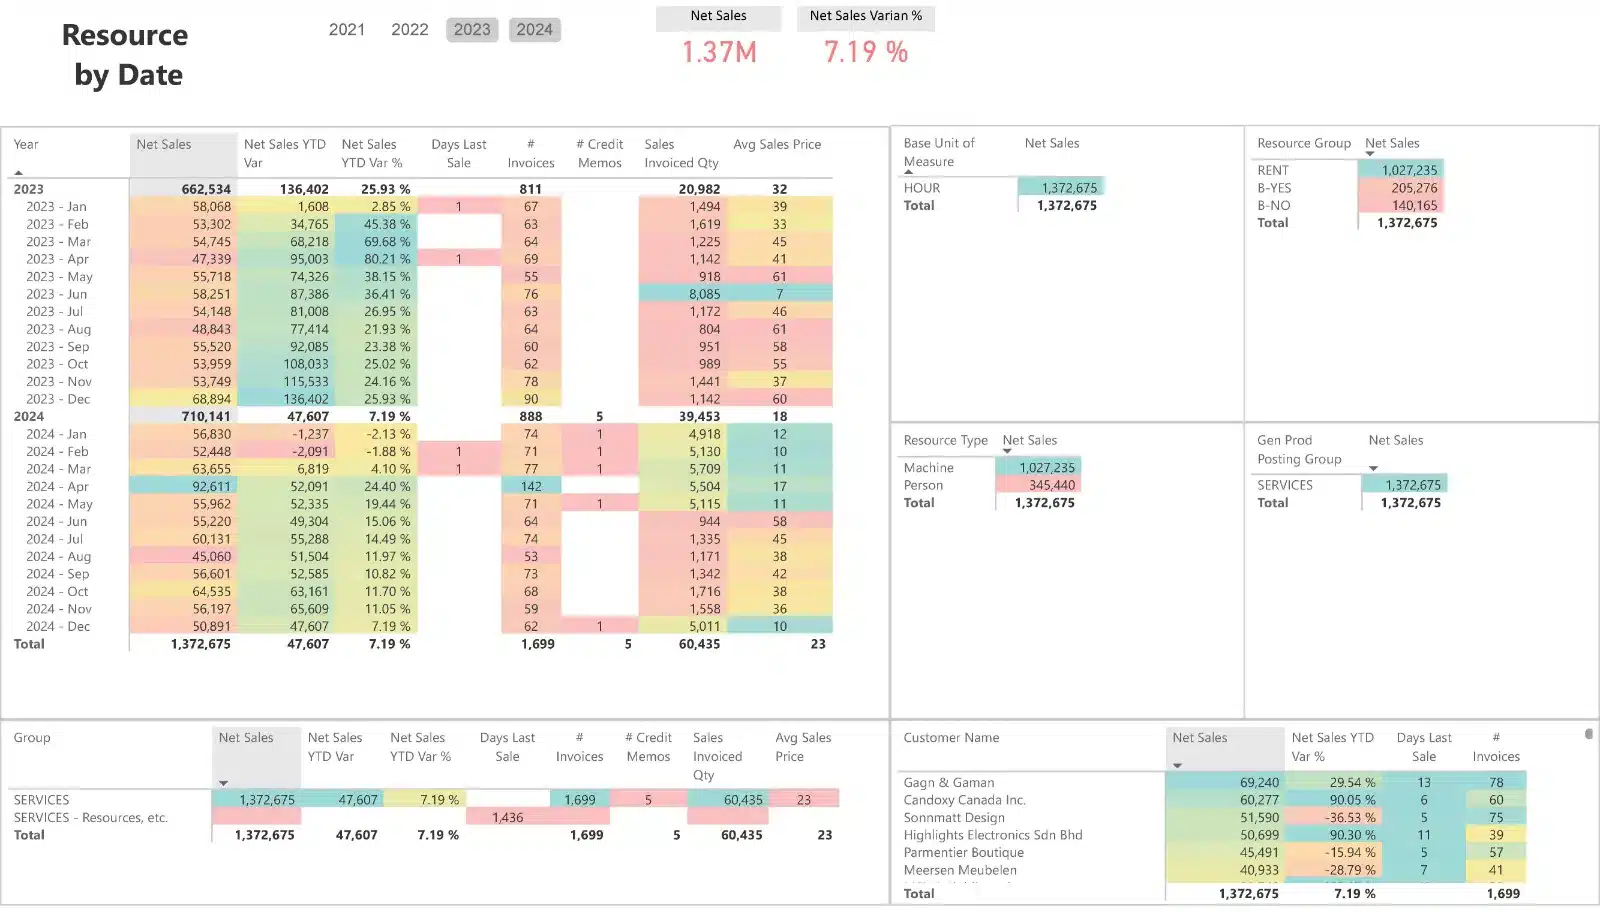
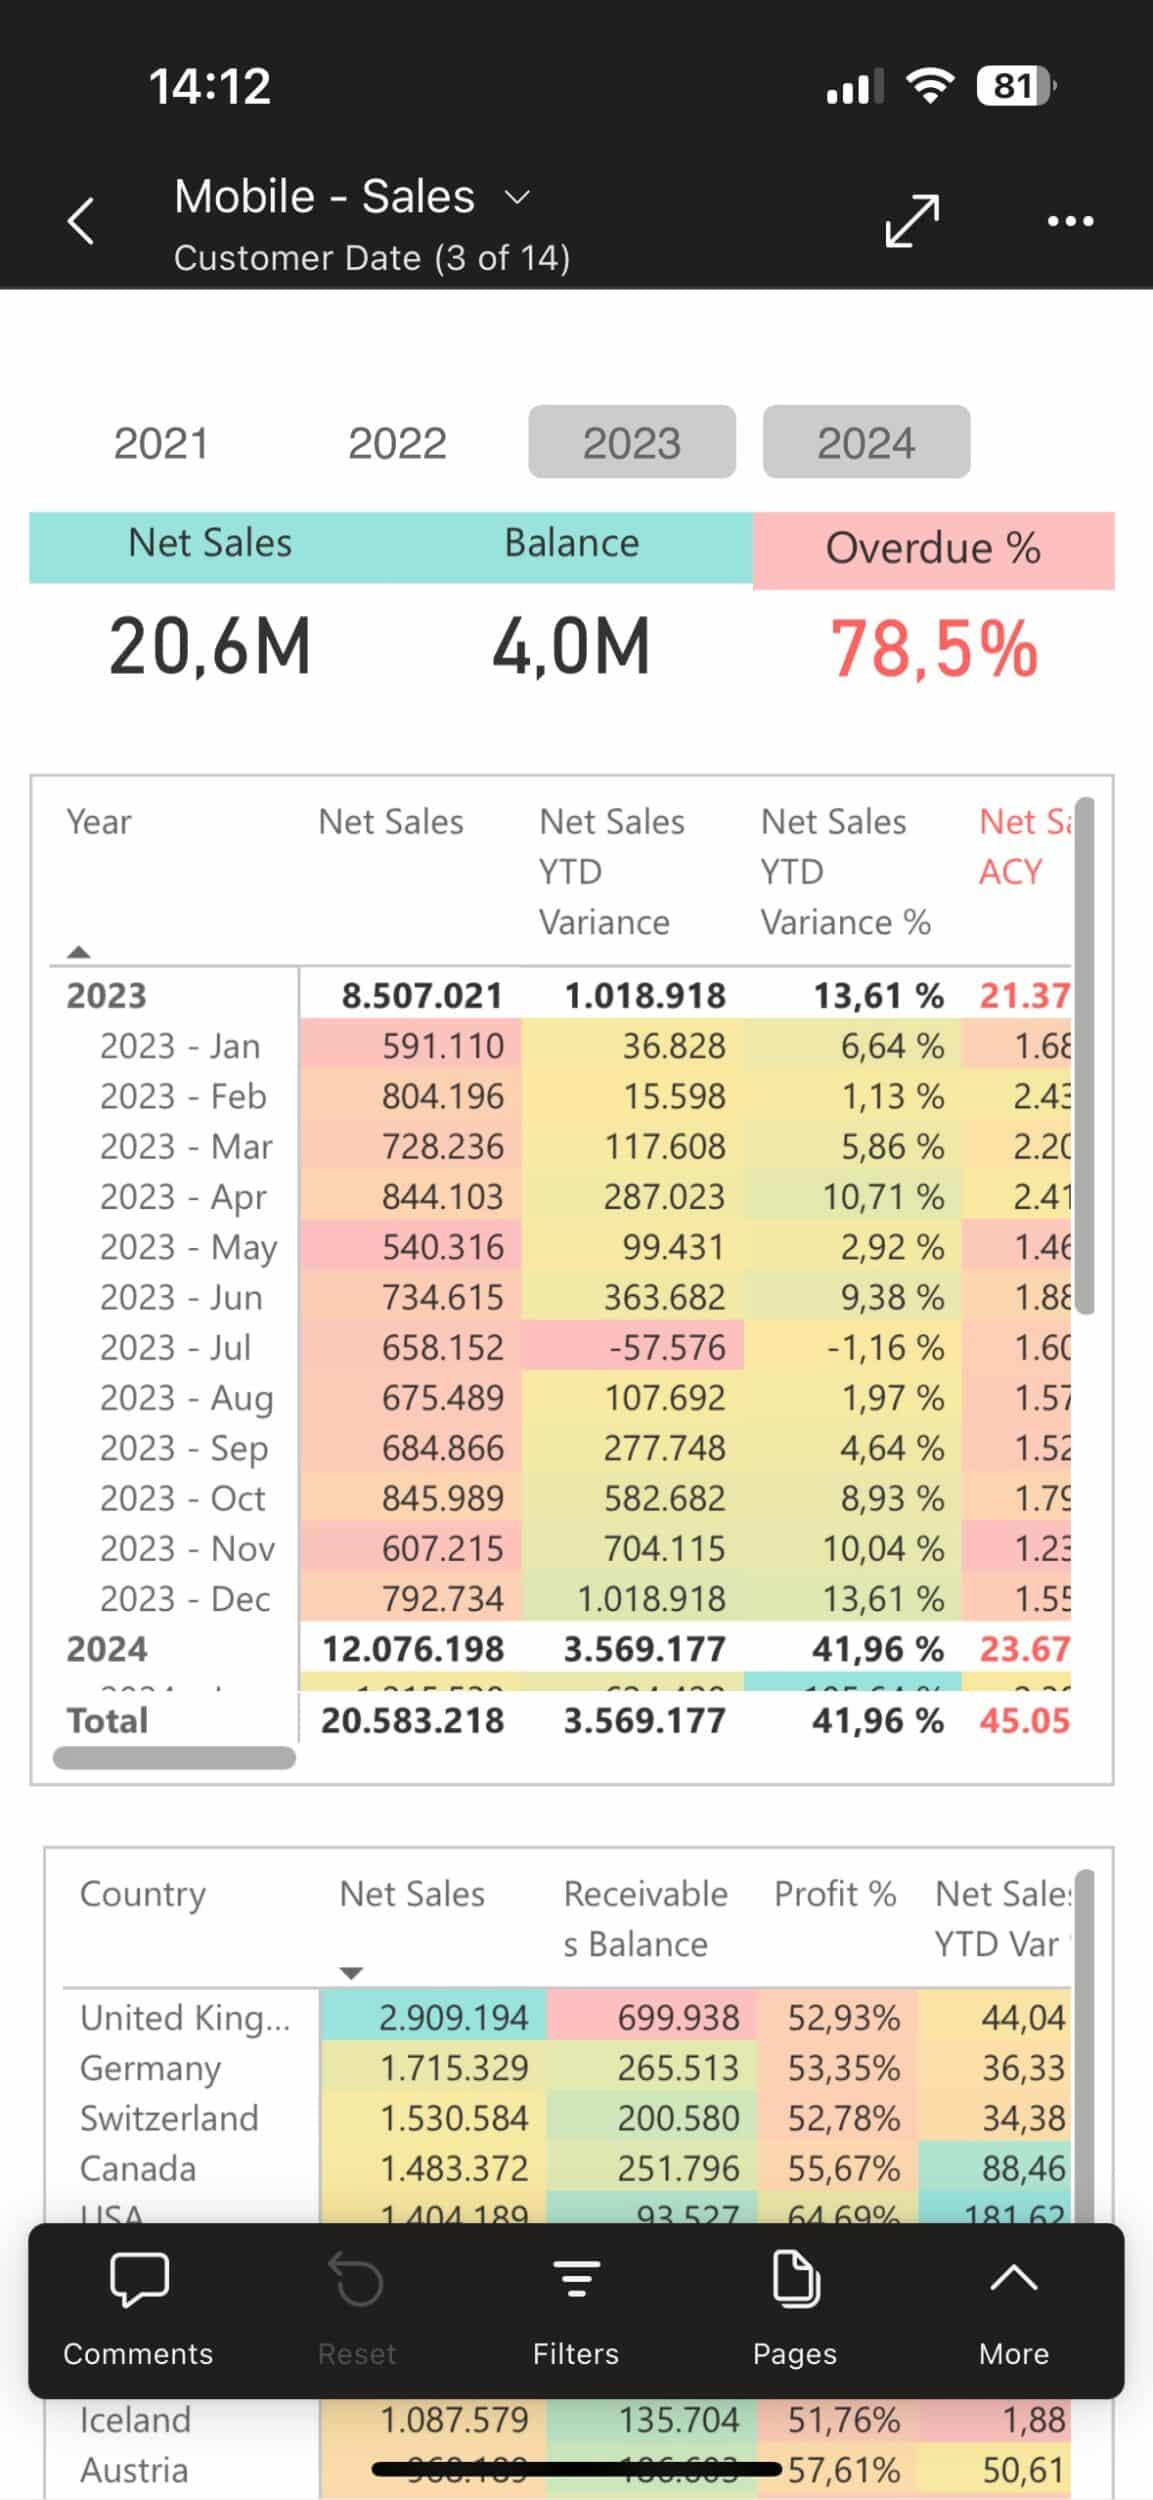
Sales by Date Analysis Dashboard for Microsoft Dynamics Power BI
This Power BI dashboard shows sales metrics by date, offering a detailed breakdown of net sales, profit, overdue percentages, and receivables to keep track of monthly and quarterly performance.
What It Does/Offers:
- Sales trends by date, including net sales, profit percentage, and sales YTD variance.
- Metrics on receivables overdue and turnover days, giving a complete view of financial health over time.
- Breakdown by country and customer group for more targeted performance analysis.
- Insights into payment terms and overdue percentages, helping to manage cash flow.
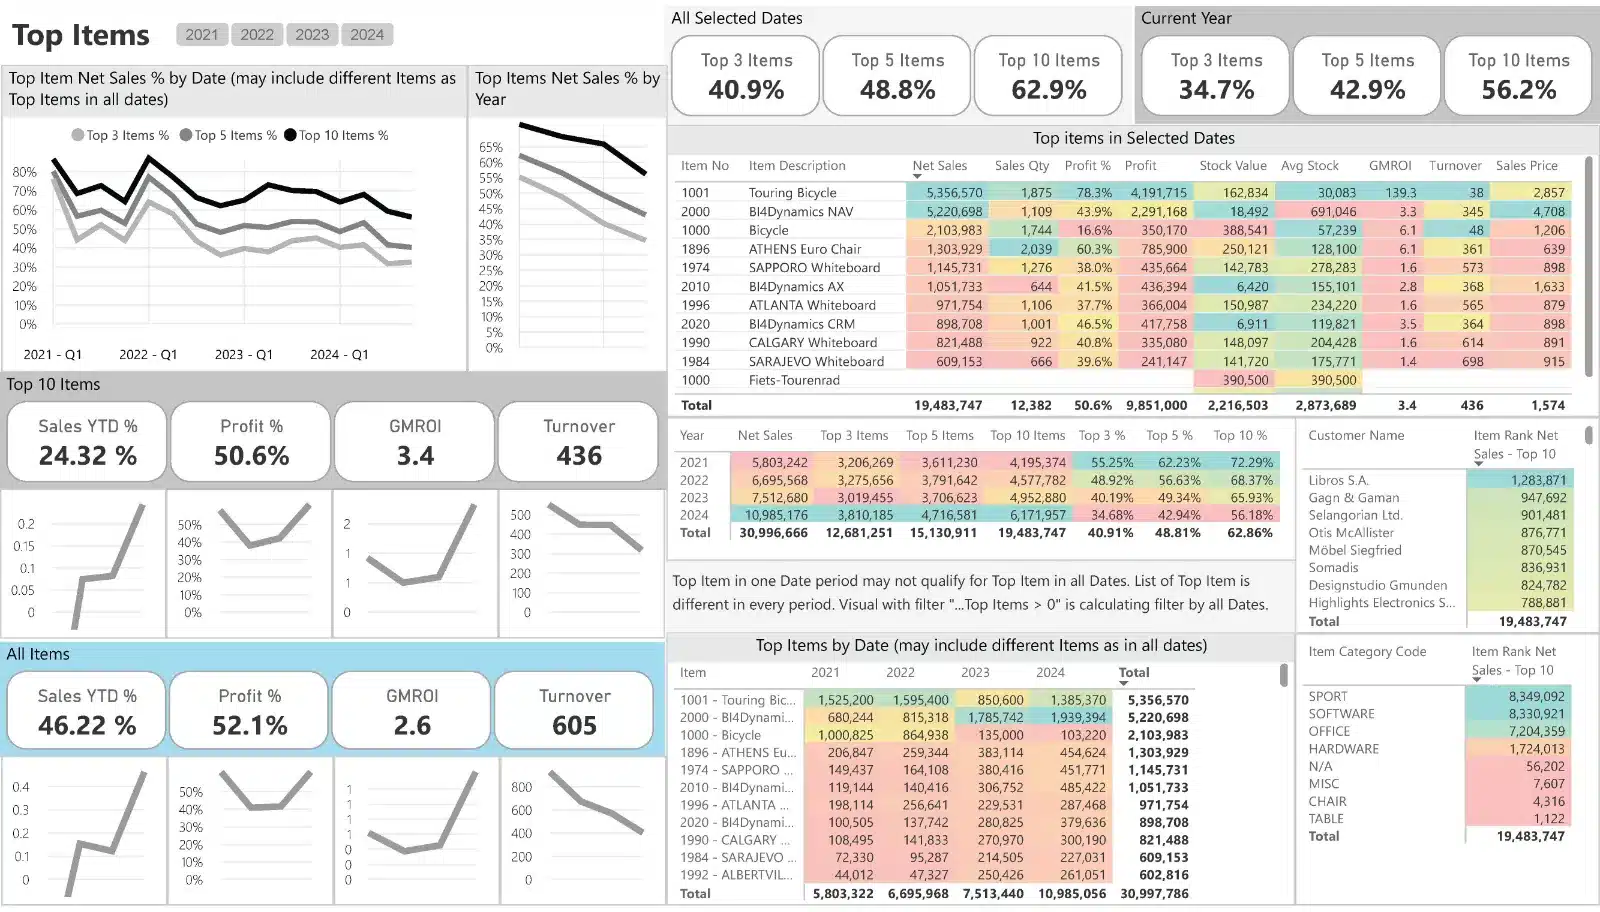
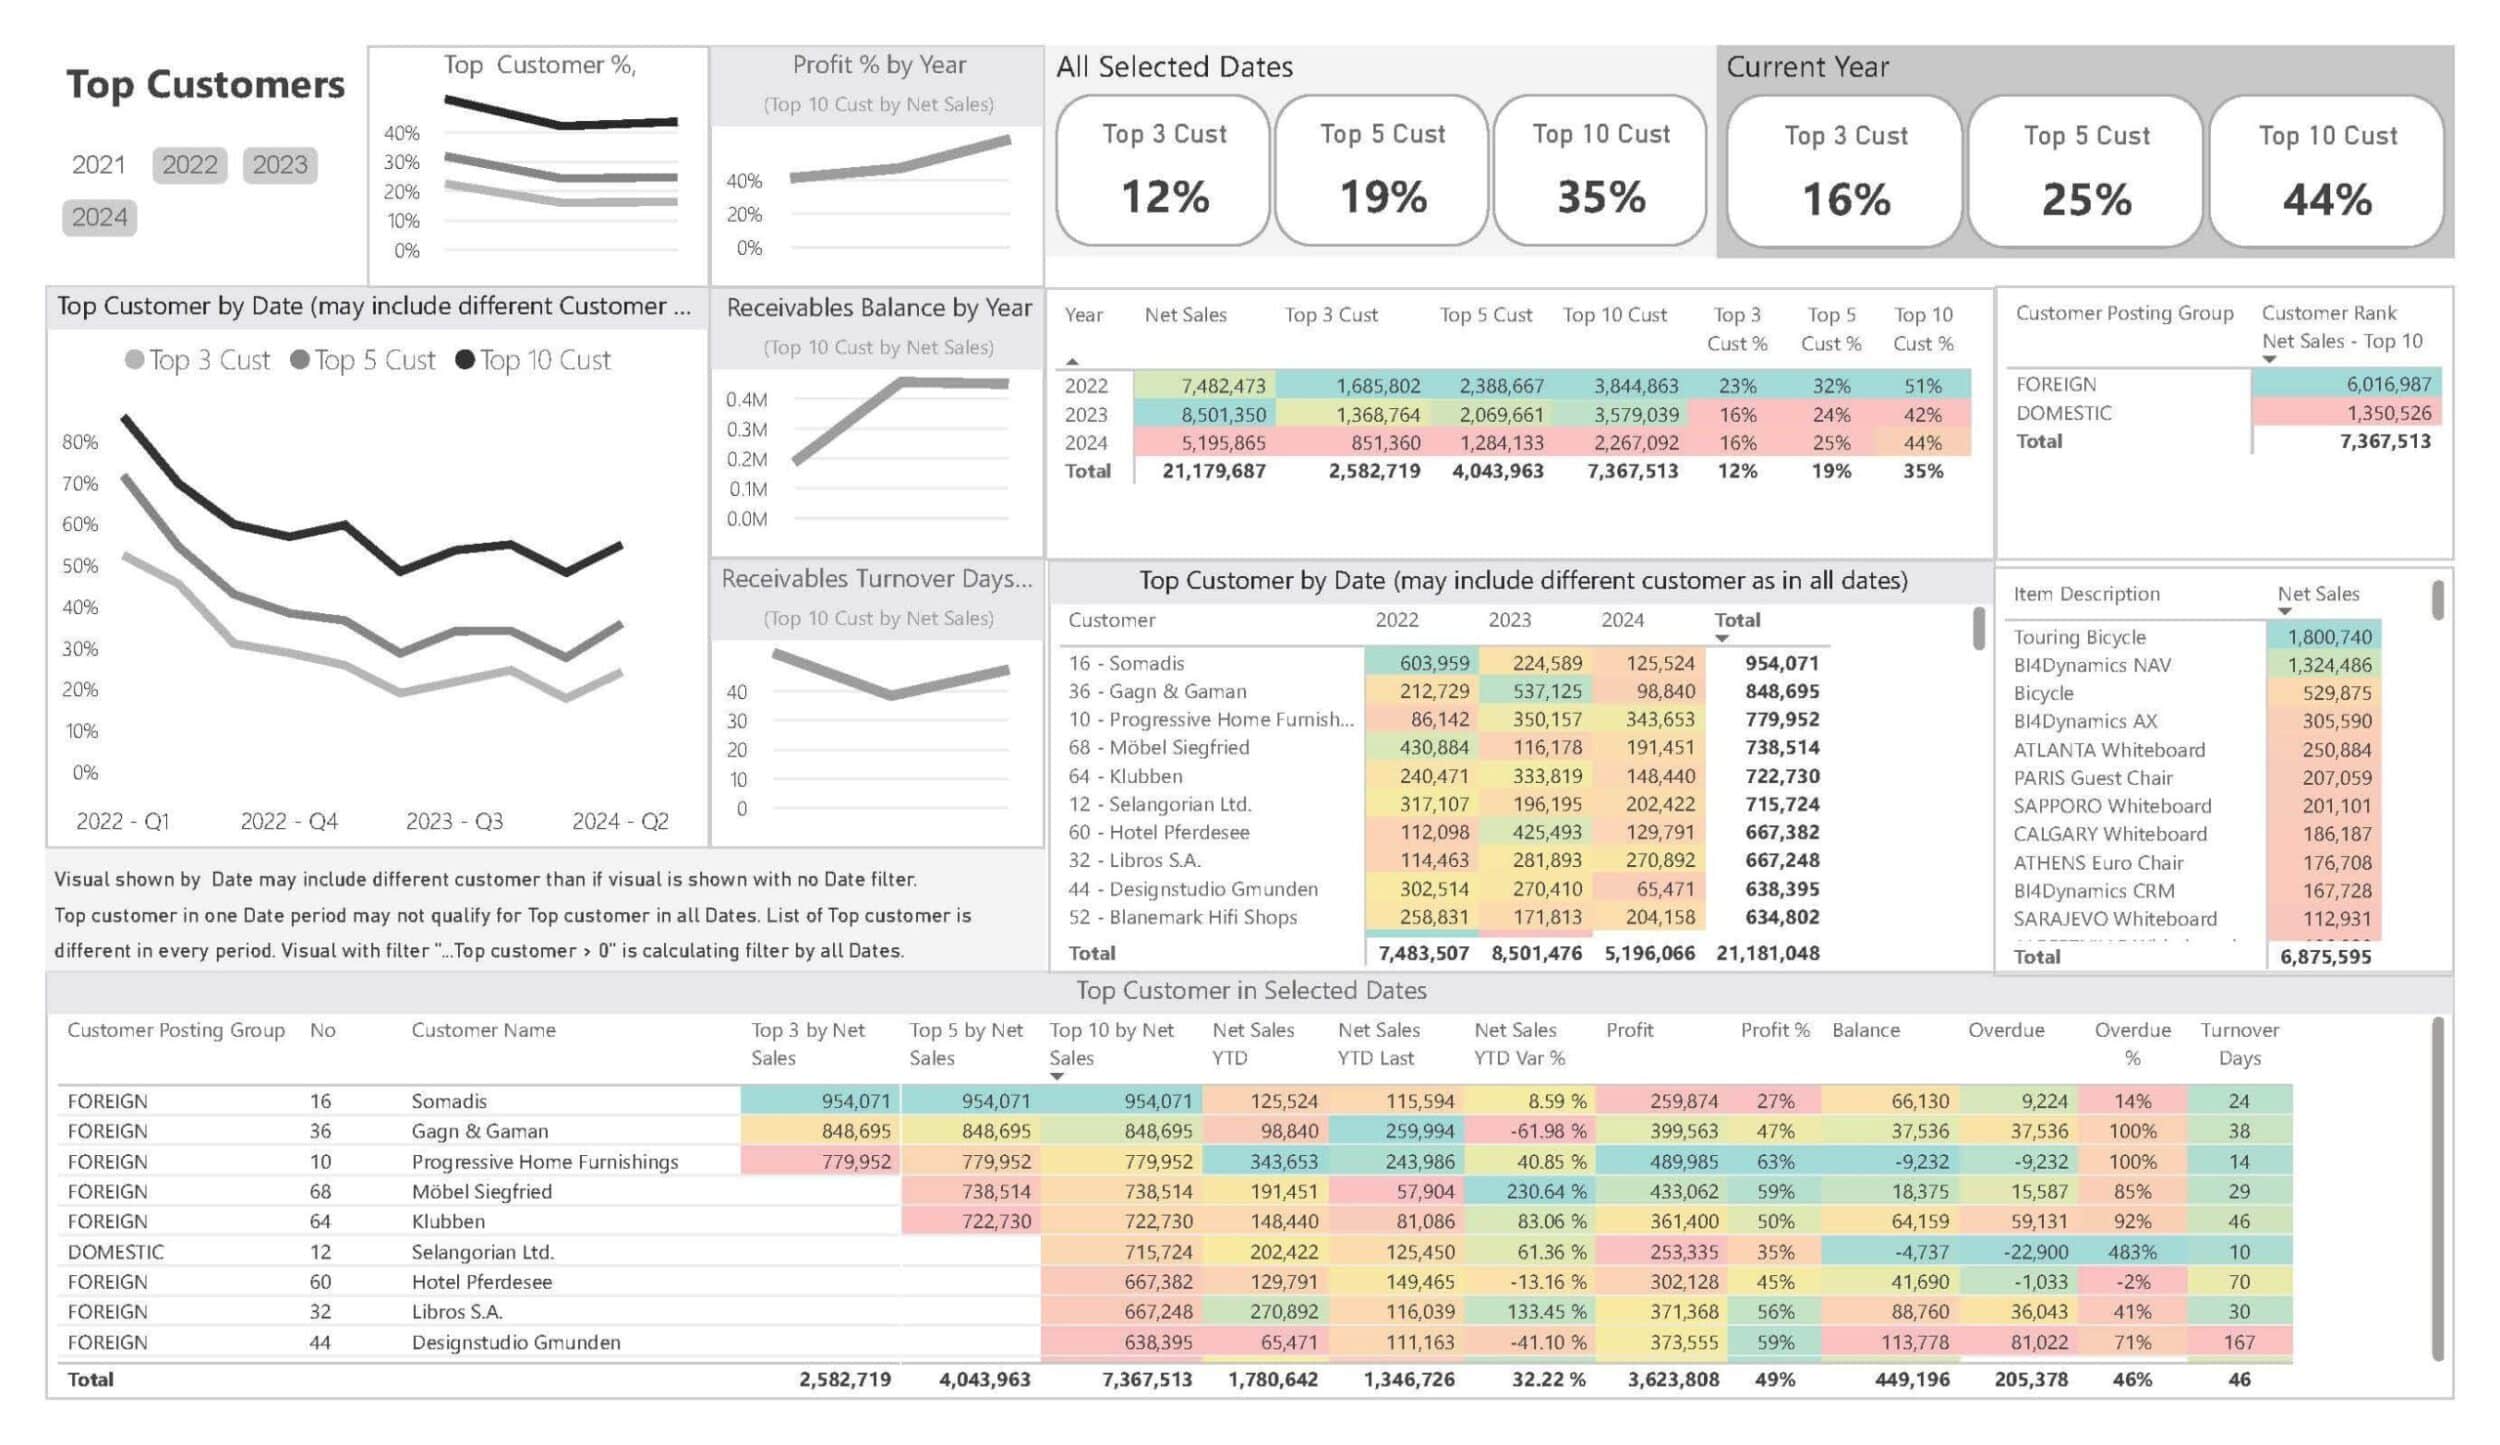
Top Customers Analysis Dashboard for Microsoft Dynamics Power BI
This Power BI dashboard highlights top customers by sales, profit, and receivables, offering a strategic view to focus on the most valuable relationships.
What It Does/Offers:
- Top customer analysis by net sales, profit, and receivables turnover days.
- Top 3, Top 5, and Top 10 customer contributions across various metrics, offering insights into which customers drive the most value.
- Tracks profit and receivables balance trends by top customers for each year.
- Overview of customer posting groups and ranking, helping businesses focus their efforts on high-value relationships.
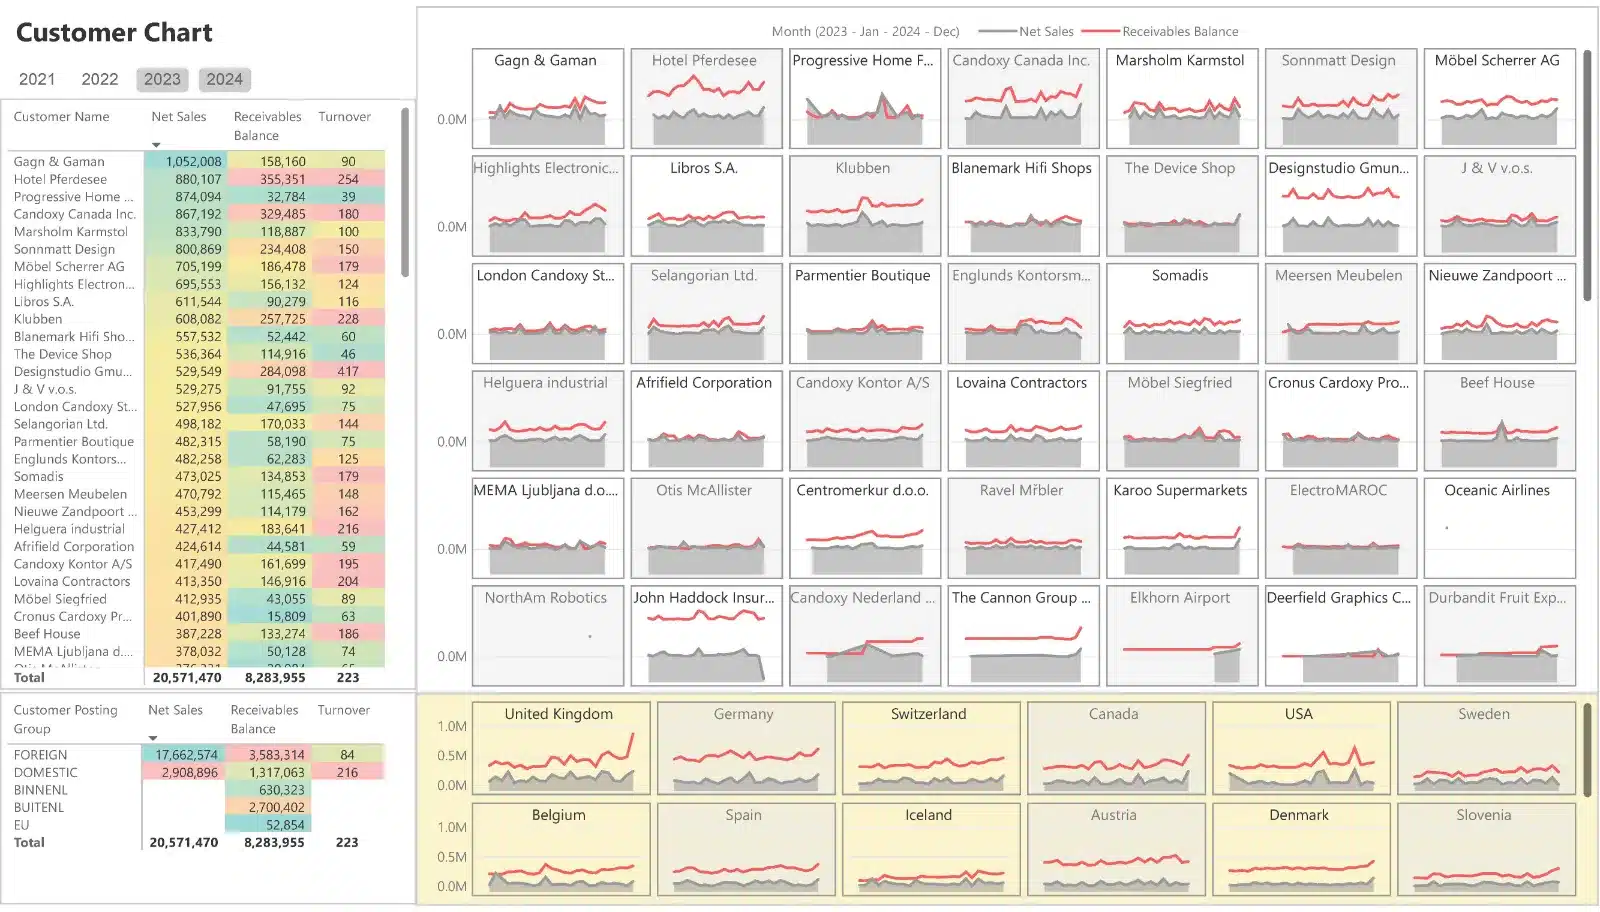
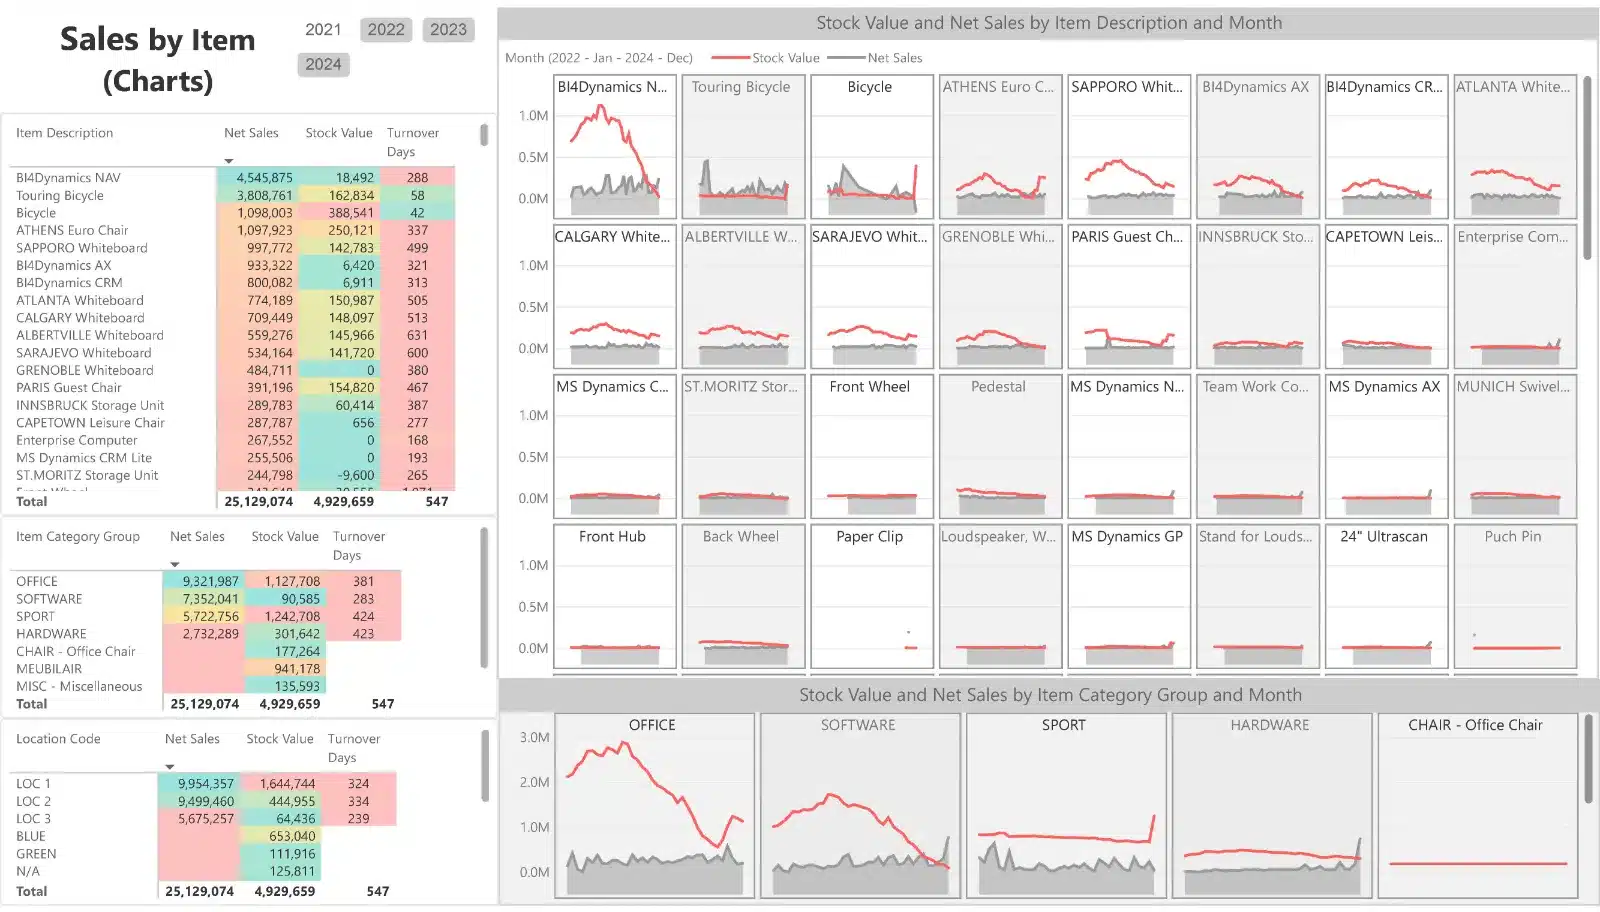
Customer Chart Dashboard for Microsoft Dynamics Power BI
This dashboard provides visual trend lines for net sales and receivables balances across different customers and countries, offering insights into sales trends over time.
What It Does/Offers:
- Trend analysis for each customer with net sales and receivables balance, providing a clear visual of customer activity.
- Overview of net sales and receivables balance by country, enabling geographical performance tracking.
- Allows for easy comparison of sales and receivables trends for different customers over time.
- Breakdown by customer posting group, showing segmentation for effective sales targeting.
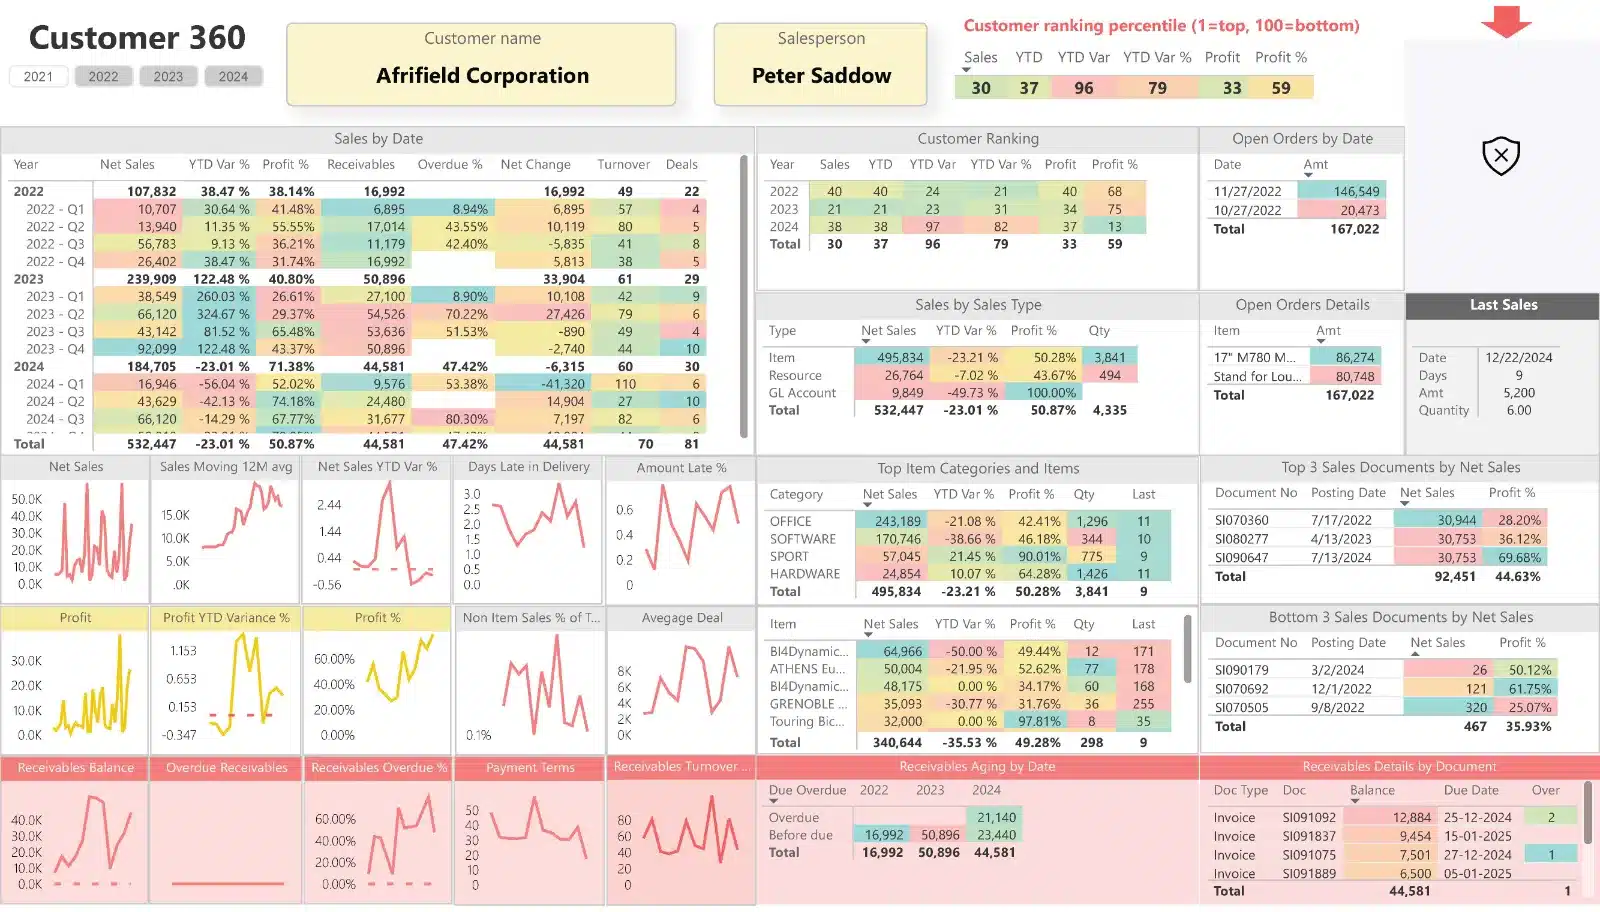
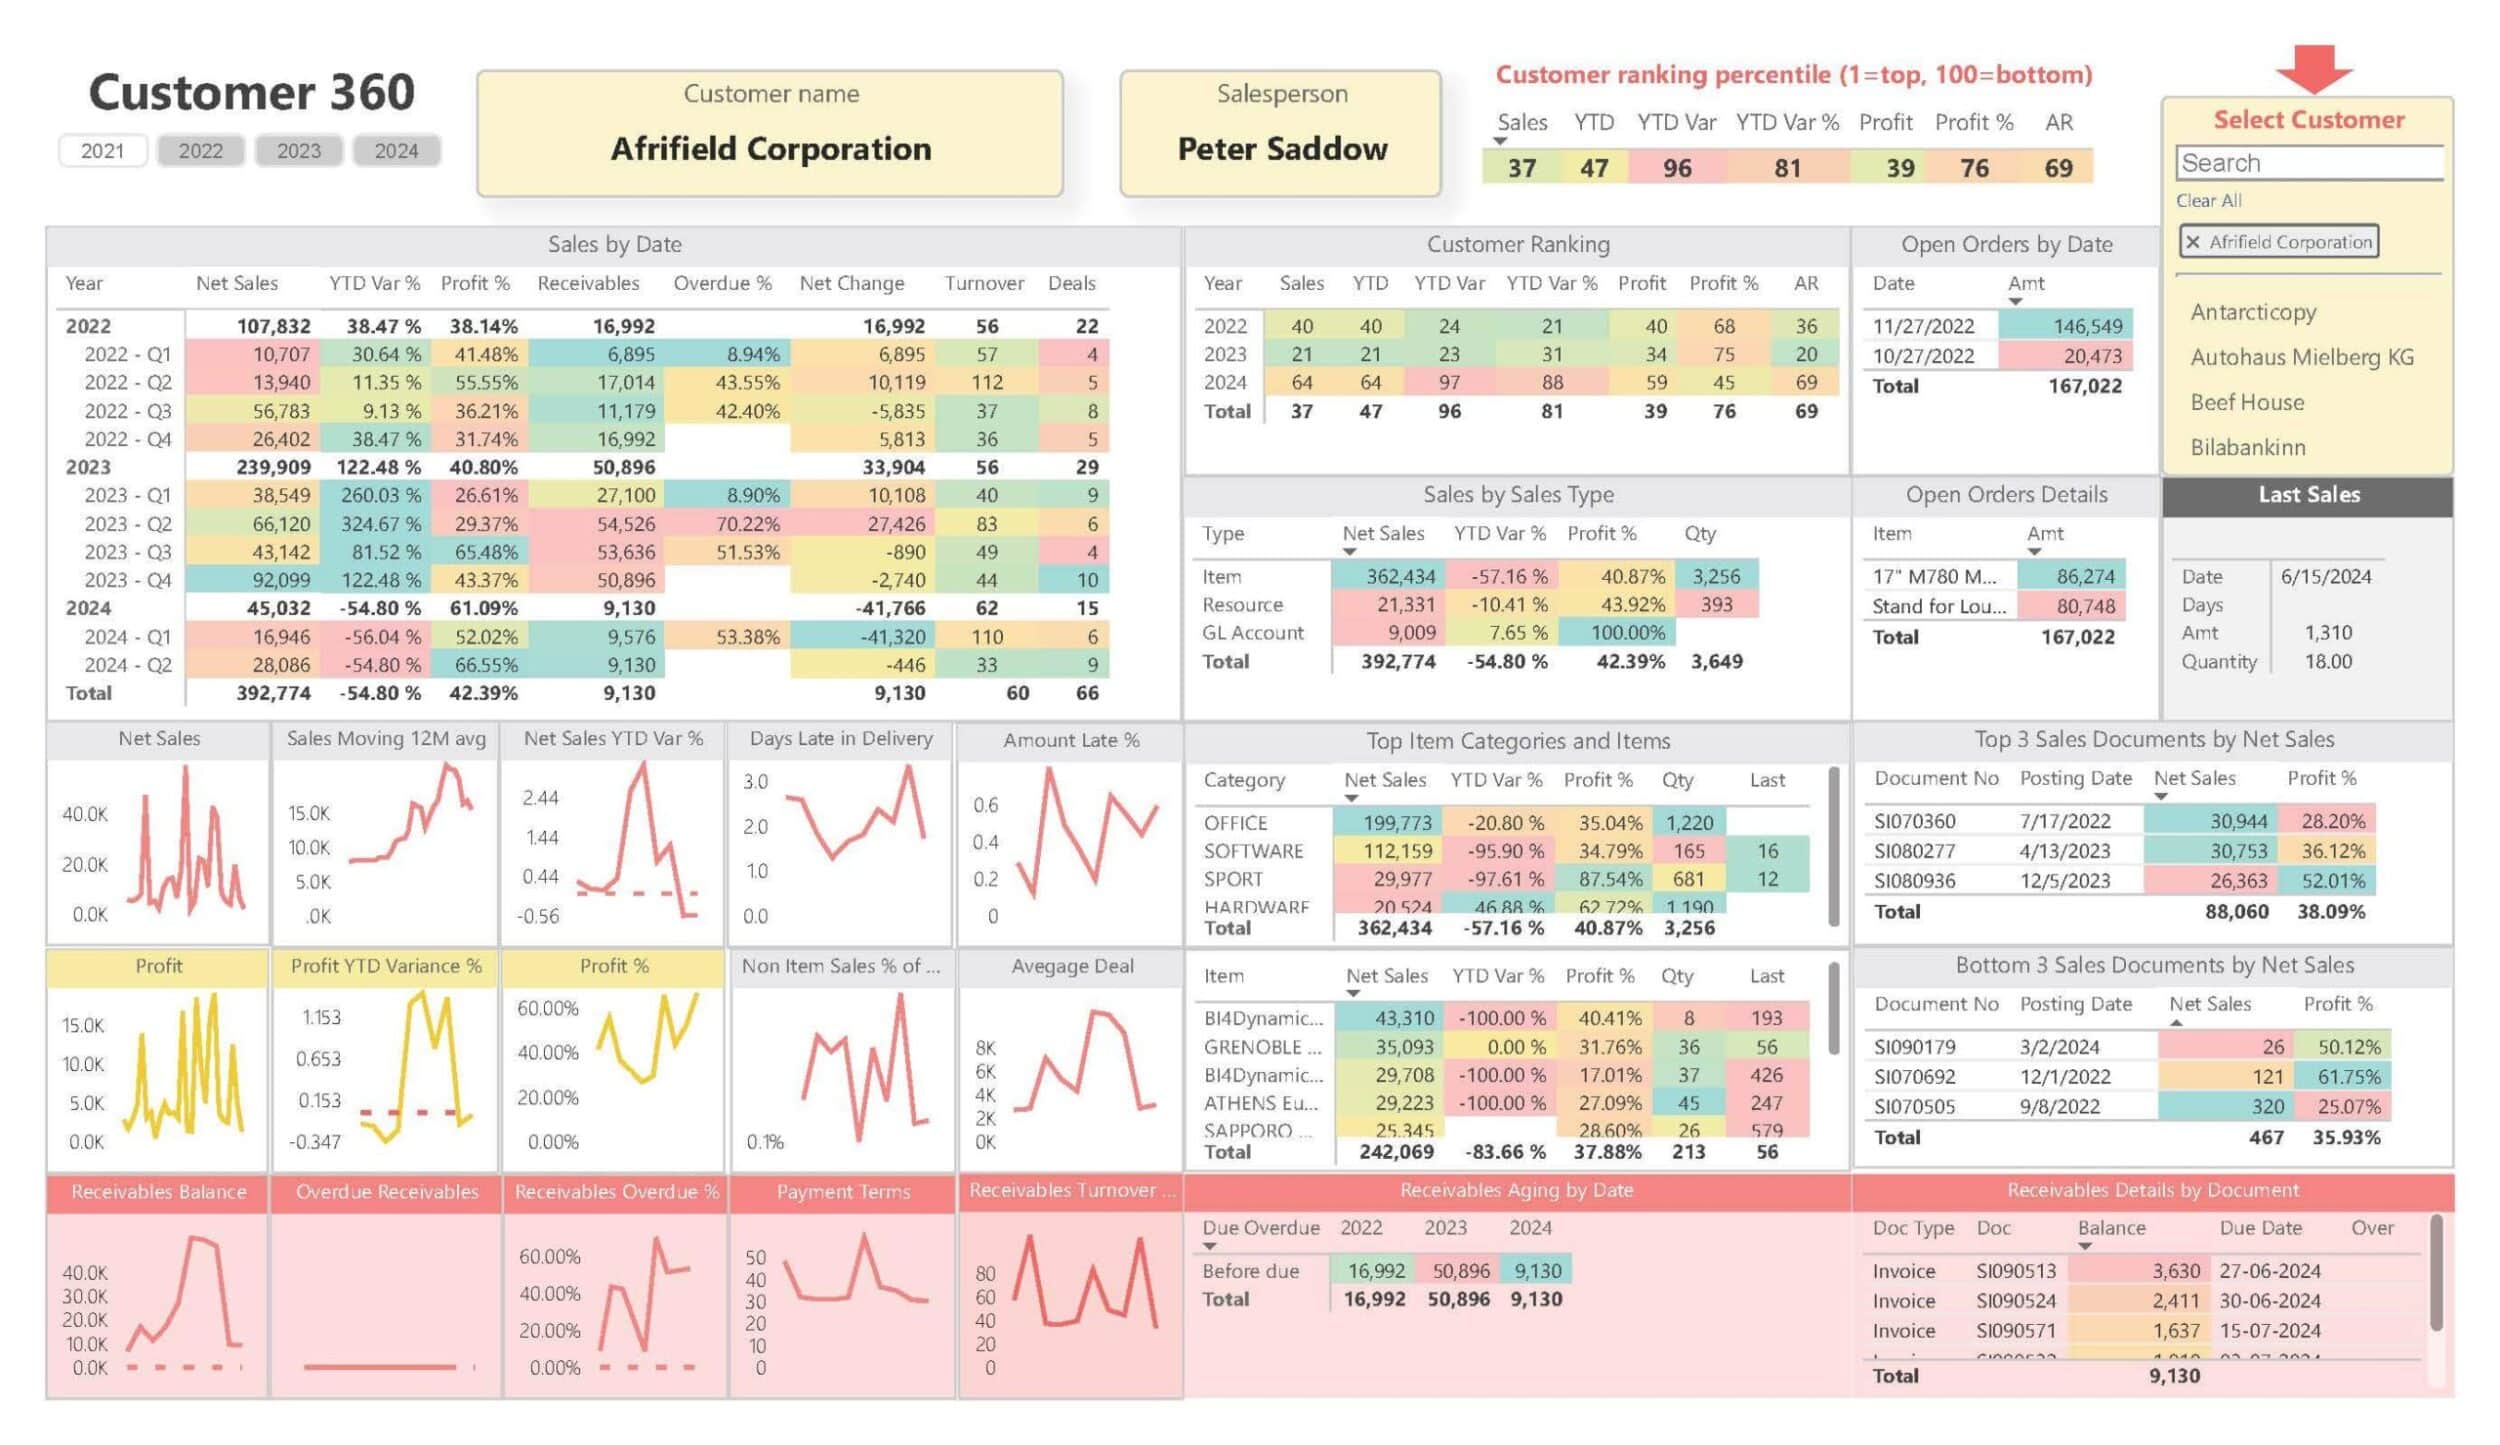
Customer 360 View Dashboard for Microsoft Dynamics Power BI
This Power BI dashboard provides an in-depth view of individual customer performance metrics, including sales trends, customer ranking, and receivables aging, helping to optimize customer relations and profitability.
What It Does/Offers:
- Detailed sales trends by customer with net sales, YTD variance, and profit metrics.
- Customer ranking percentile to assess customer contribution relative to the entire portfolio.
- Overview of open orders and sales documents, giving a complete picture of customer activities.
- Metrics on receivables aging and overdue invoices, helping monitor and manage customer payment behaviors effectively.
Want to test other application areas?
Stay Ahead with BI4Dynamics
In today's dynamic business environment, having real-time access to accurate and comprehensive financial data is essential. The BI4Dynamics Sales Power BI Dashboard equips you with the tools needed to:
Gain Insights
Enhance Strategic Planning
Improve Operational Efficiency
Get Started Today
Revolutionize your reporting and analysis with BI4Dynamics
1.
Request a Personalized Demo
Explore how BI4Dynamics meets your specific needs.
Consult with our experts to learn how to maximize the solution’s benefits. 👉 Start here.
2.
Connect your data securely
We will open an unrestricted license, containing all business modules and our customization wizard.
No worries: It will be securely installed on your infrastructure, without interfering with your ERP.
3.
Implement and Empower
Deploy the solution and enhance your team’s capabilities.
Test it FREE 30 Days Free.