A wide variety of pre-made reports are offered for every module whereas the Sales Module has 20 easy to customize reports.
The pre-made Power BI reports are connected to an in-memory tabular Model, which allows you to bring any of 1500 (BC & NAV) or 2000 (F&O & AX) BI measures into your analysis.
All reports are interactive and can be modified by you, at any time and according to your exact needs.
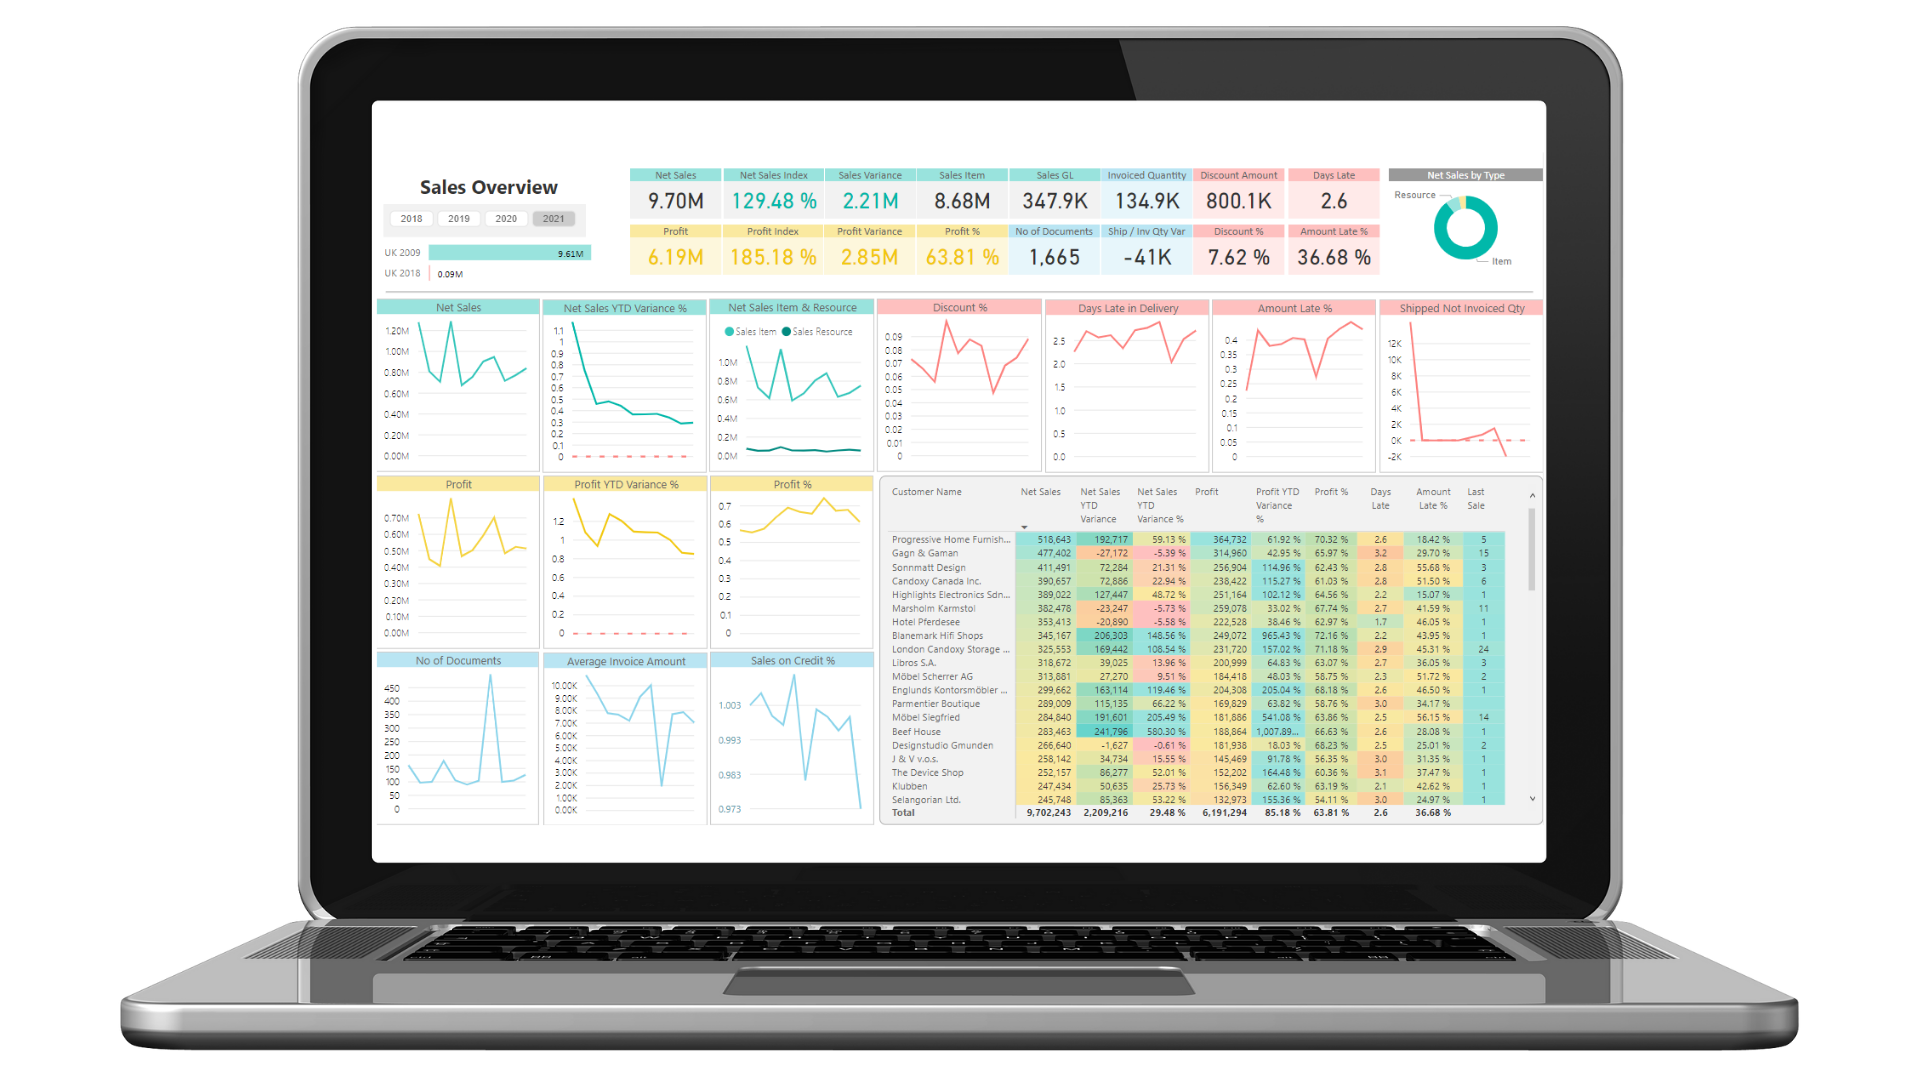
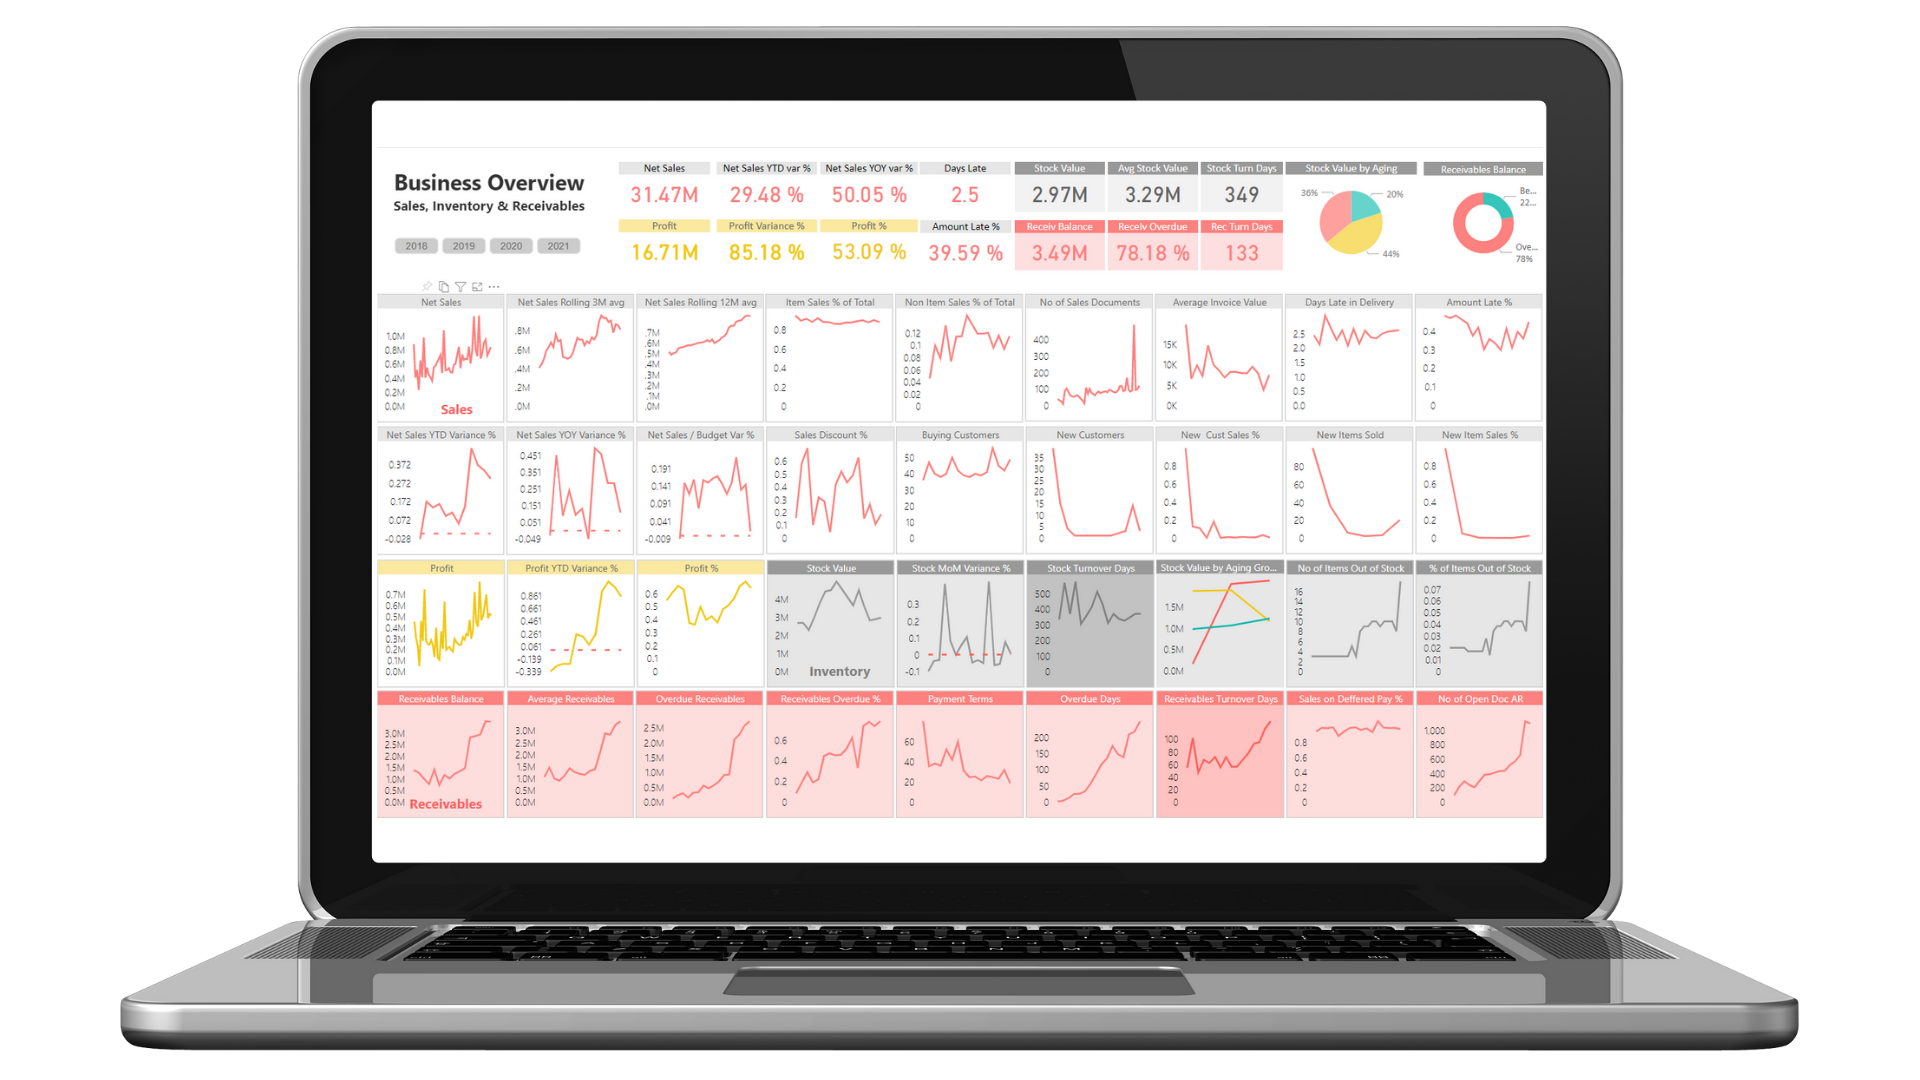
Sales cube comes with 322 measures Measure groups are sharing 42 dimensions with 476 attributes in 71 hierarchies. Sales Values: We have it all.
Analyze sales and profit (Gross / Net Sales, Costs, Discounts, Profits, Invoiced Quantities, Charges, Average Sales/Cost/Profit) from posted sales and service transactions with strongly supported time intelligence (YTD, YoY, PoP, 12 Last months, Rolling 3/6/12) and Expected values (Net Sales, Profit, Cost) coming from Value Entry. There are 81 measures in ACY (additional currency for reporting is selected from Currency table) for consolidation and 8 measures in Posted currency. Follow Last Sales Transactions by any dimension or hierarchy if customers are changing buying habits.
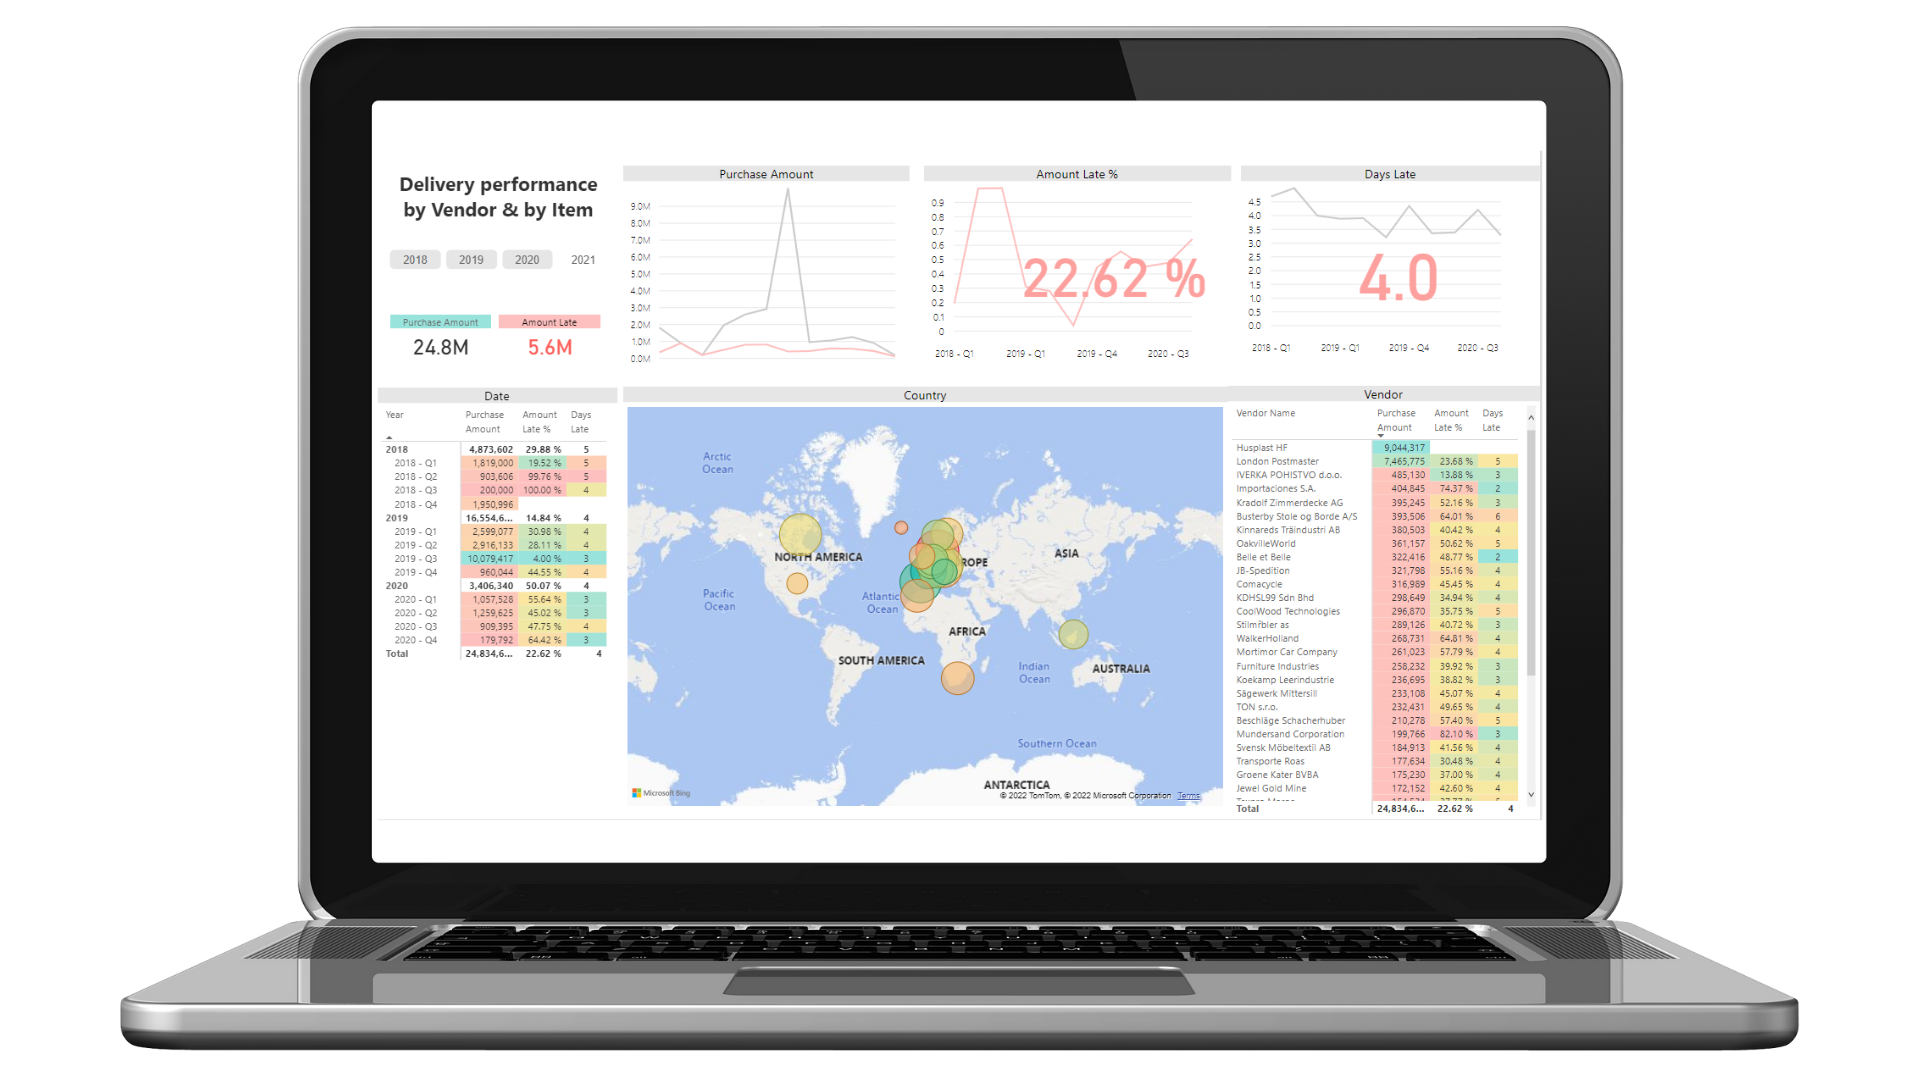
Purchase cube comes with 131 measures you can analyze over 35 dimensions.
Track delivery performance (Amount Late%, Days Late …) of your vendors. This is information that your vendors don‘t have!
Days Late is the difference between the Delivery Date (Promised, Requested, or Planned) and Posting Date of Receipt.
Analyze purchase documents (Quote, Order, Blanket Order, Return order, Invoice, and Credit memo) by any measure or dimension available in Purchase Header or Purchase Line. Even though the document is archived, changed, posted or deleted.
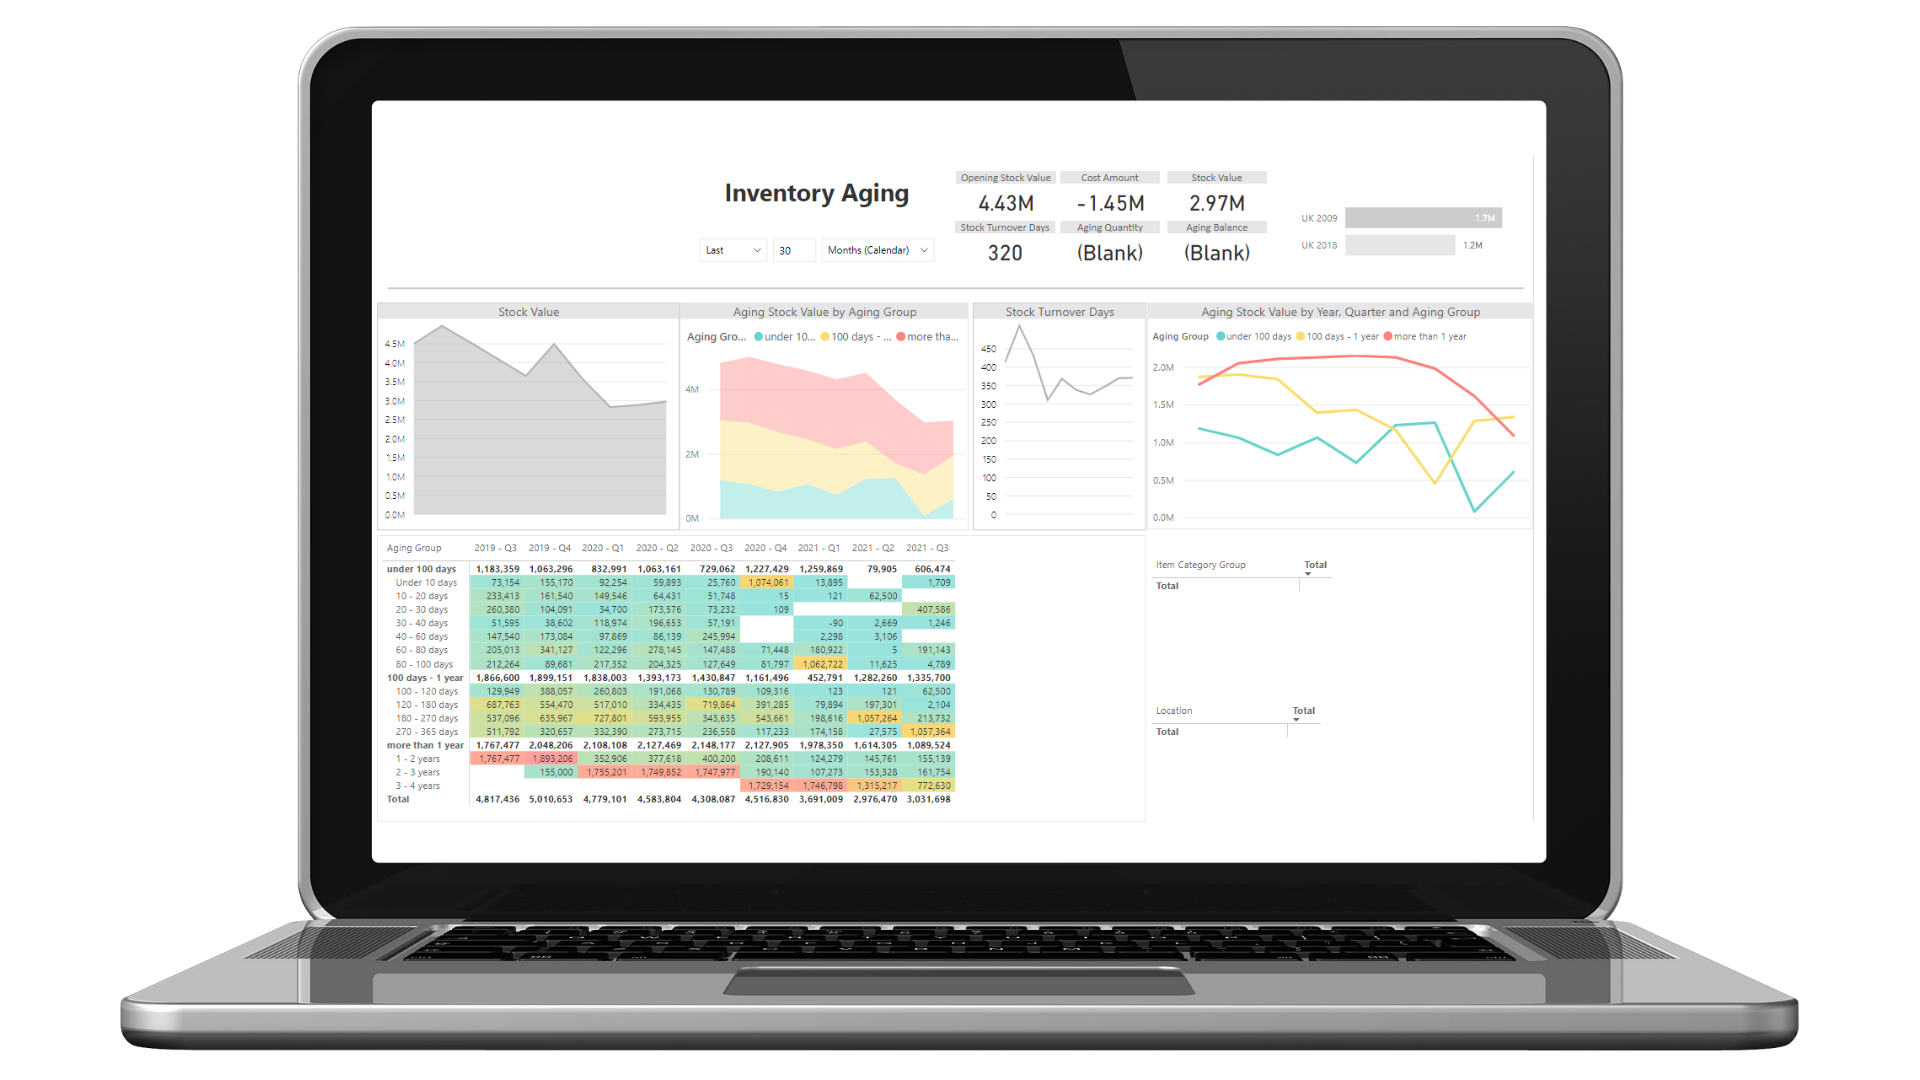
Inventory cube comes with 152 measures and 18 dimensions.
Inventory Aging: track Aging value and quantity from first BC transactions with all changes over time by detailed aging buckets. Aging Days measure tells how many days items have not been moving from the last location.
Analyze the cost of Items, GL postings (services), Charges and Fixed Assets (Cost amount, Discount, Quantity, Price, Last purchase transactions) from standard invoiced transactions as well as from specific information like Cost Amount Expected.
Inventory Invoiced Transactions: analyze Cost and Quantity (Amount, Increase, Decrease) by Entry type (in multiple variants of measure), Average costs and Expected values (Posted to GL or Inventory Cost).
Inventory Shipped Transactions: analyze Cost and Quantity (Amount, Increase, Inventory State: track dynamics of your Inventory (Opening / Closing Qty and Balance, Stock Rotation in days, Min / Max Values, Average Qty and Value over time).
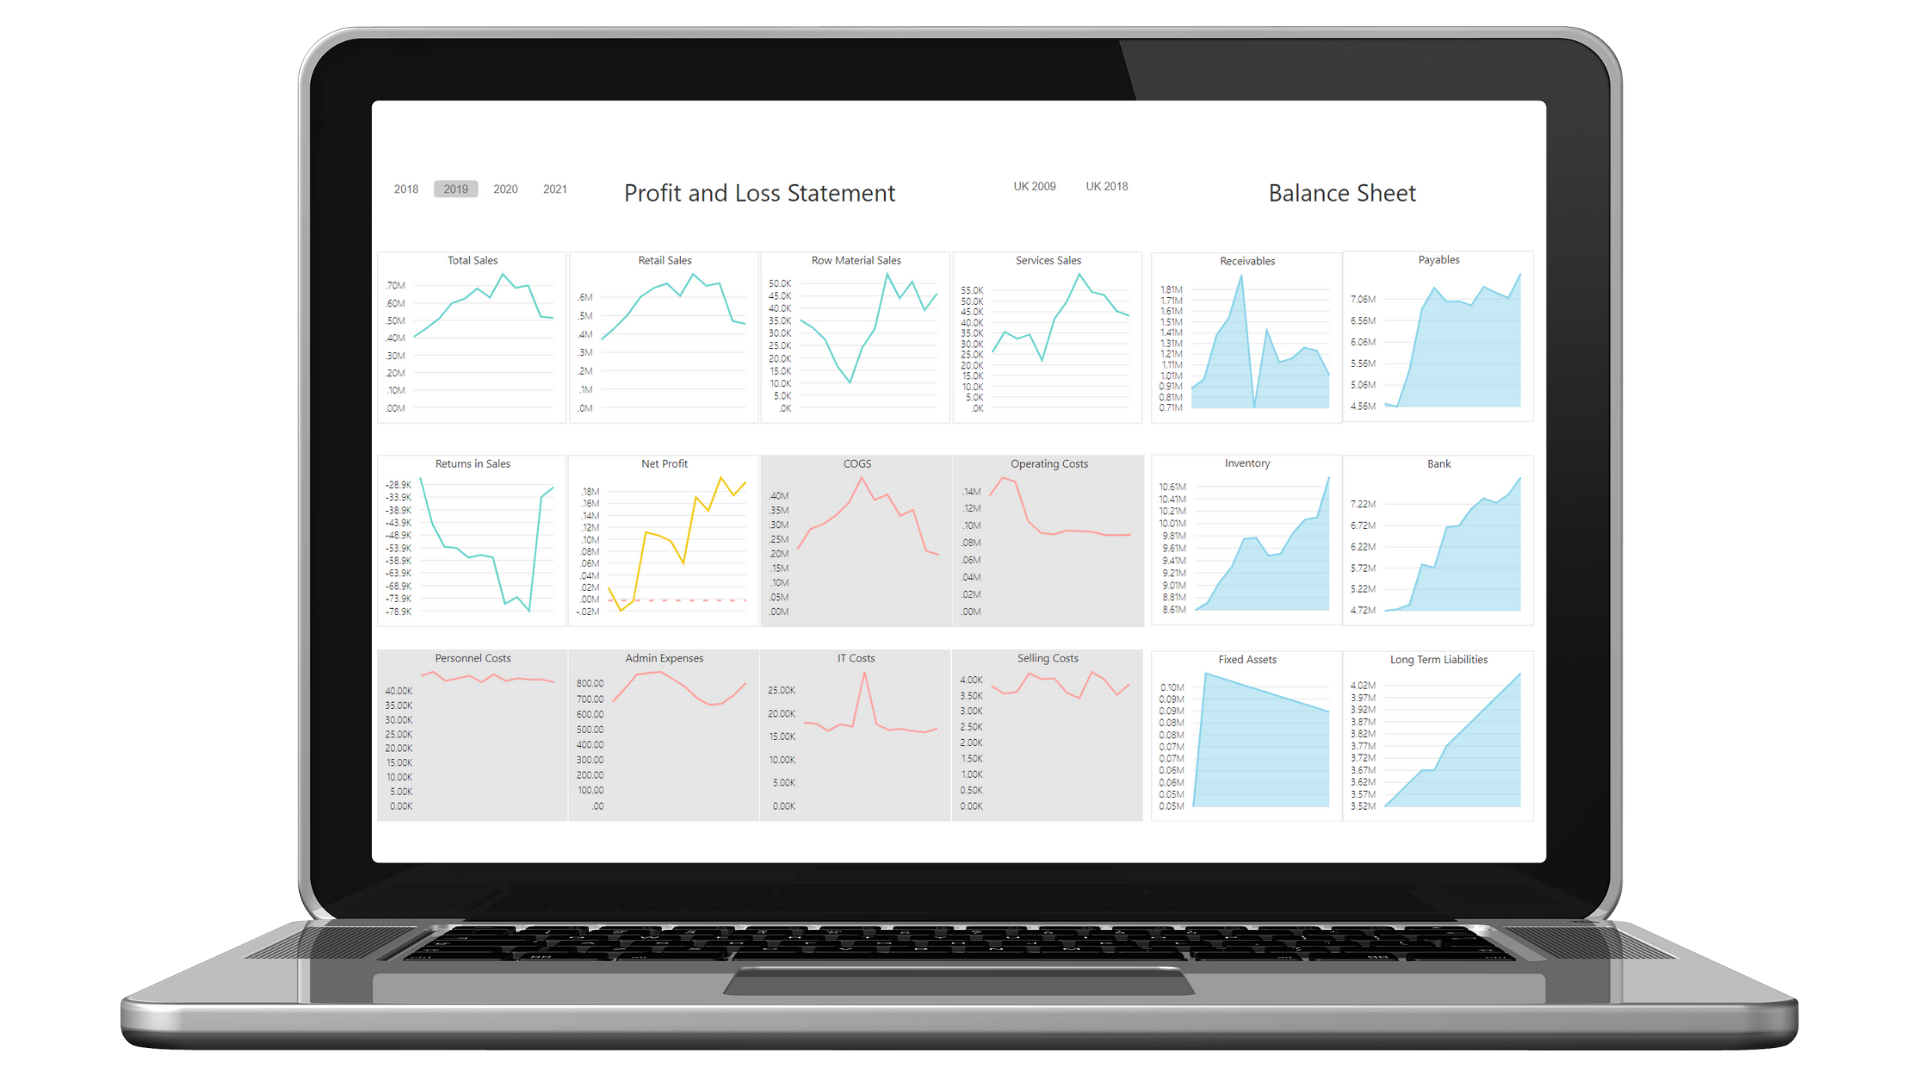
Finance cube comes with 179 measures, 22 dimensions with 215 attributes in 33 hierarchies.
Account Schedules: Transform your static Account Schedules from BC to BI, combine it with any standard BI dimension or any 20 global BC dimension, and get unimaginative flexibility for financial reporting in Excel or Power BI.
GL Analysis: Analyze GL transactions and balances in local currency as well as addition currency for reporting (ACY) for consolidation.
GL Budget: Analyze GL budget and budget variances with well supported time intelligence and comparisons.
Cost Accounting: Analyze Cost Entries as allocated GL transactions by Account Schedules or Cost Center hierarchy, this module is ideal for top-bottom analysis. All details exposed.
analyze Cash flow (standard BC module) by Source Type, Account, and track it down to Forecast document level.
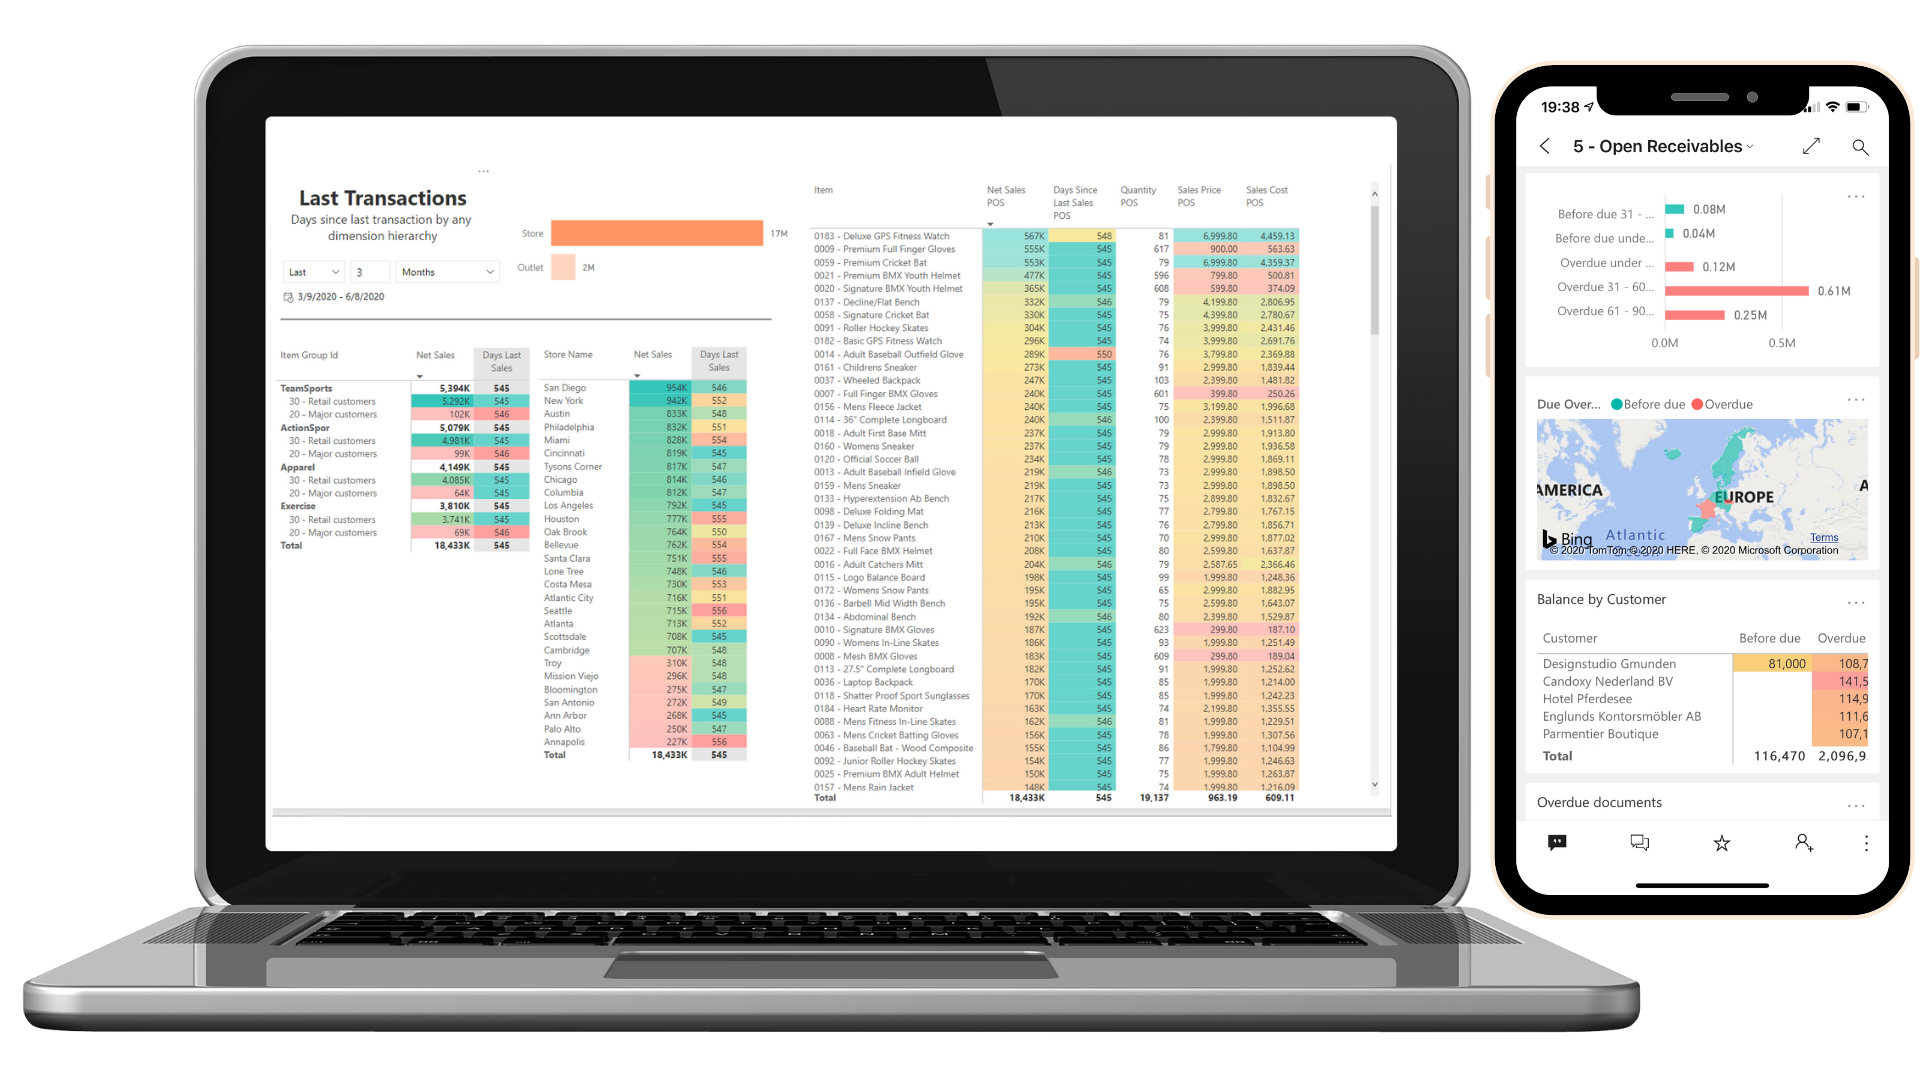
Out-of-the-box Mobile Dashboards made in Power BI
Mobile dashboards for Power BI are available for standard application areas. Sales, Purchase, Inventory, Receivables, Payables, and Finances. Selected data can be refreshed every few seconds.
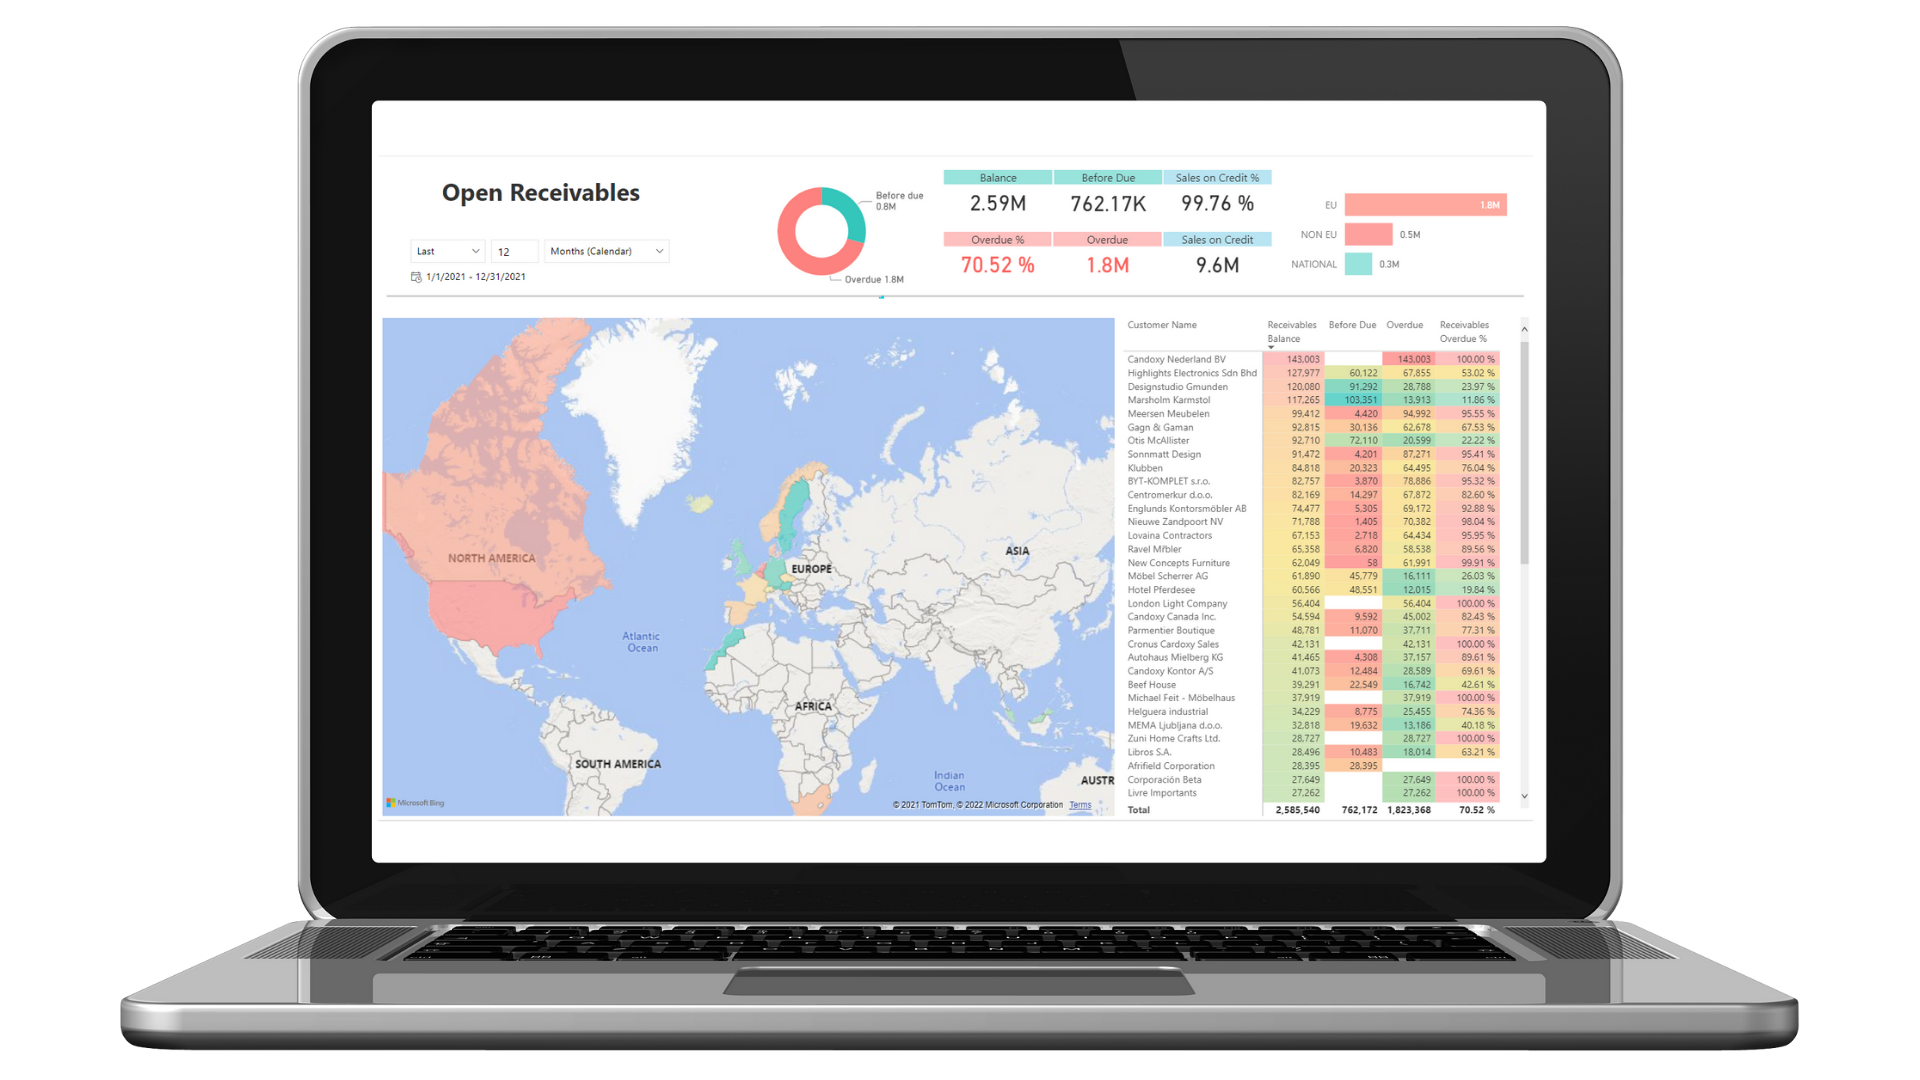
Receivables is the most standardized business area
Receivables Transactions: get insight into customer transactions (with standard Debit, Credit, Net change, and Payment terms also as weighted average, as well as some specific measures Sales on Credit as amount and percentage).
Receivables State: Analyze balances that are calculated daily for every open document (Opening, Closing, Average, Due and Overdue, Overdue %). Track customer payment habits starting from Payment Terms to Average Open Days and Average Overdue Days – all 3 measures are calculated as weighted averages. Setup and compress data on a weekly or monthly level to gain loading time and save disk space.
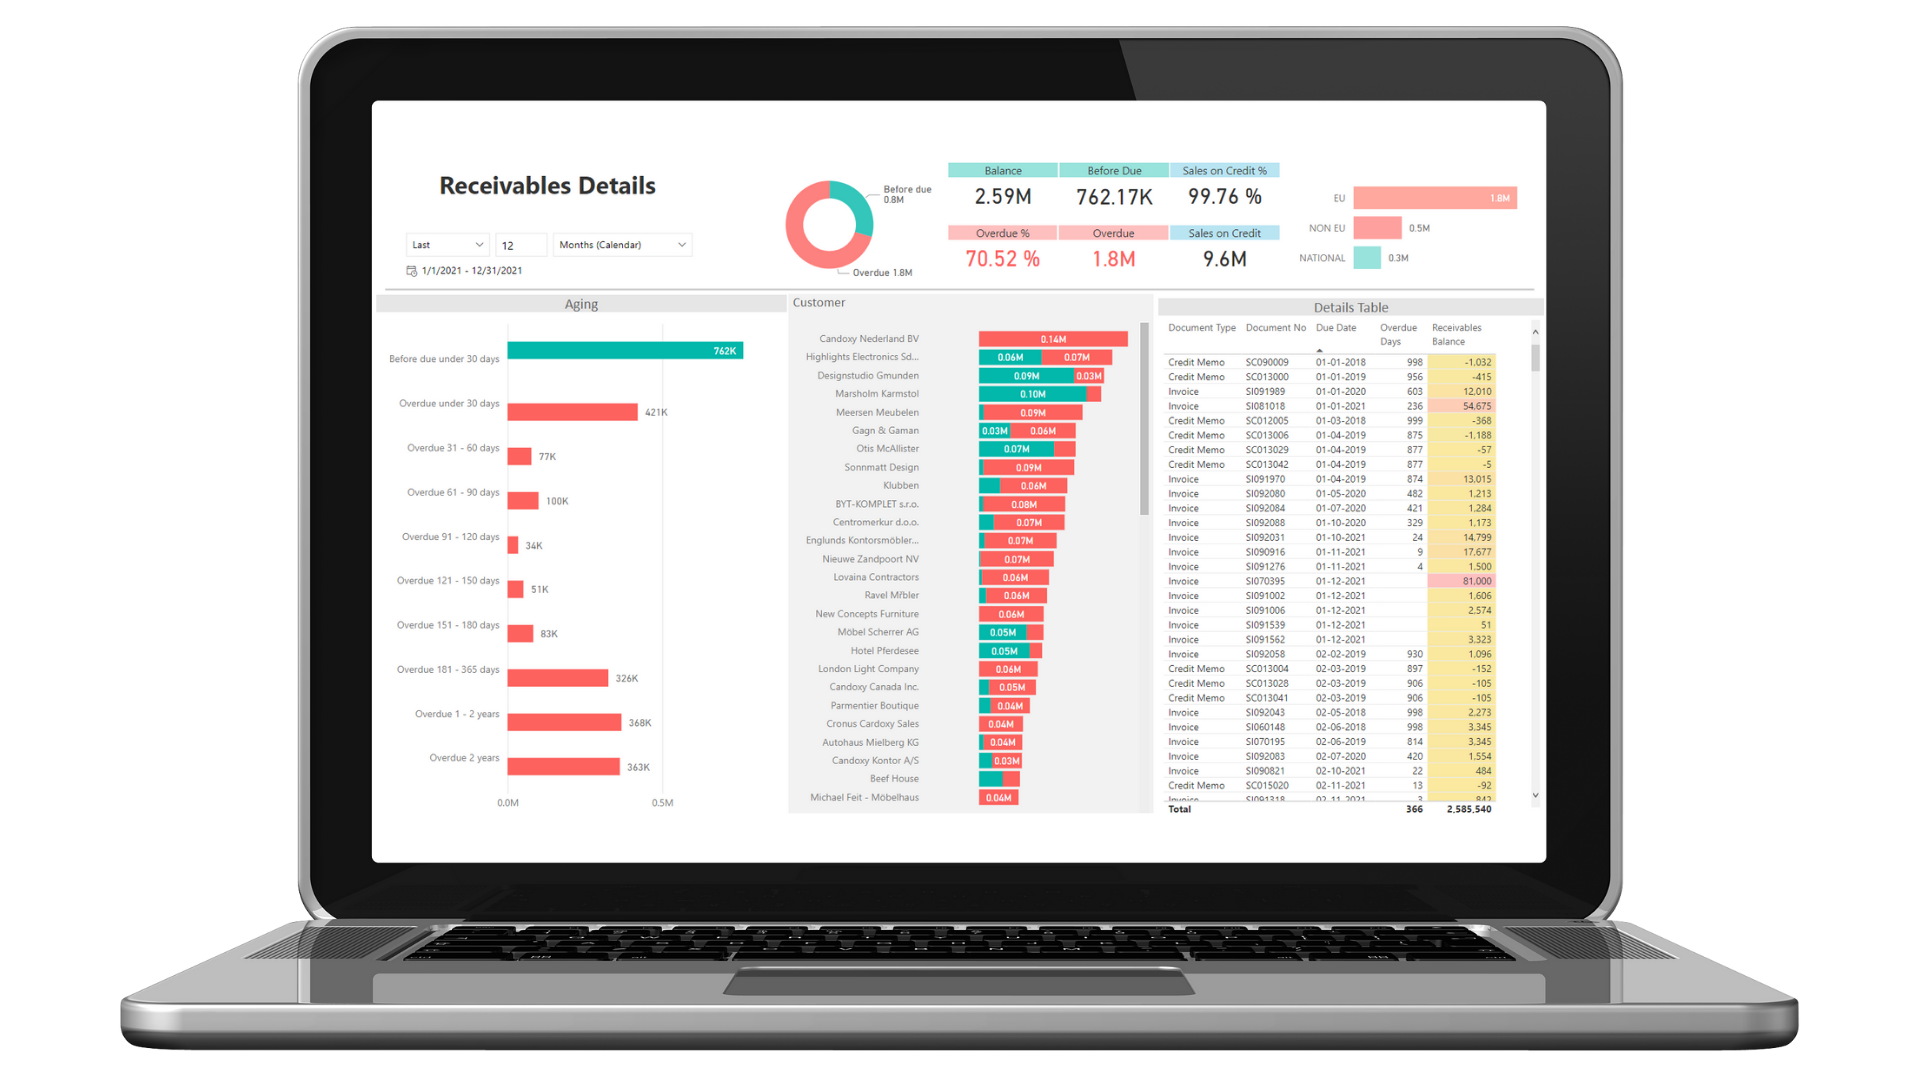
Power BI Receivables Details Dashboard
Each application area has 5-10 different dashboards. Starting with yearly trends, moving to monthly trends, and to a more detailed view for each specific area. In receivables for example we have receivables details where you can have a complete overview of your receivables.
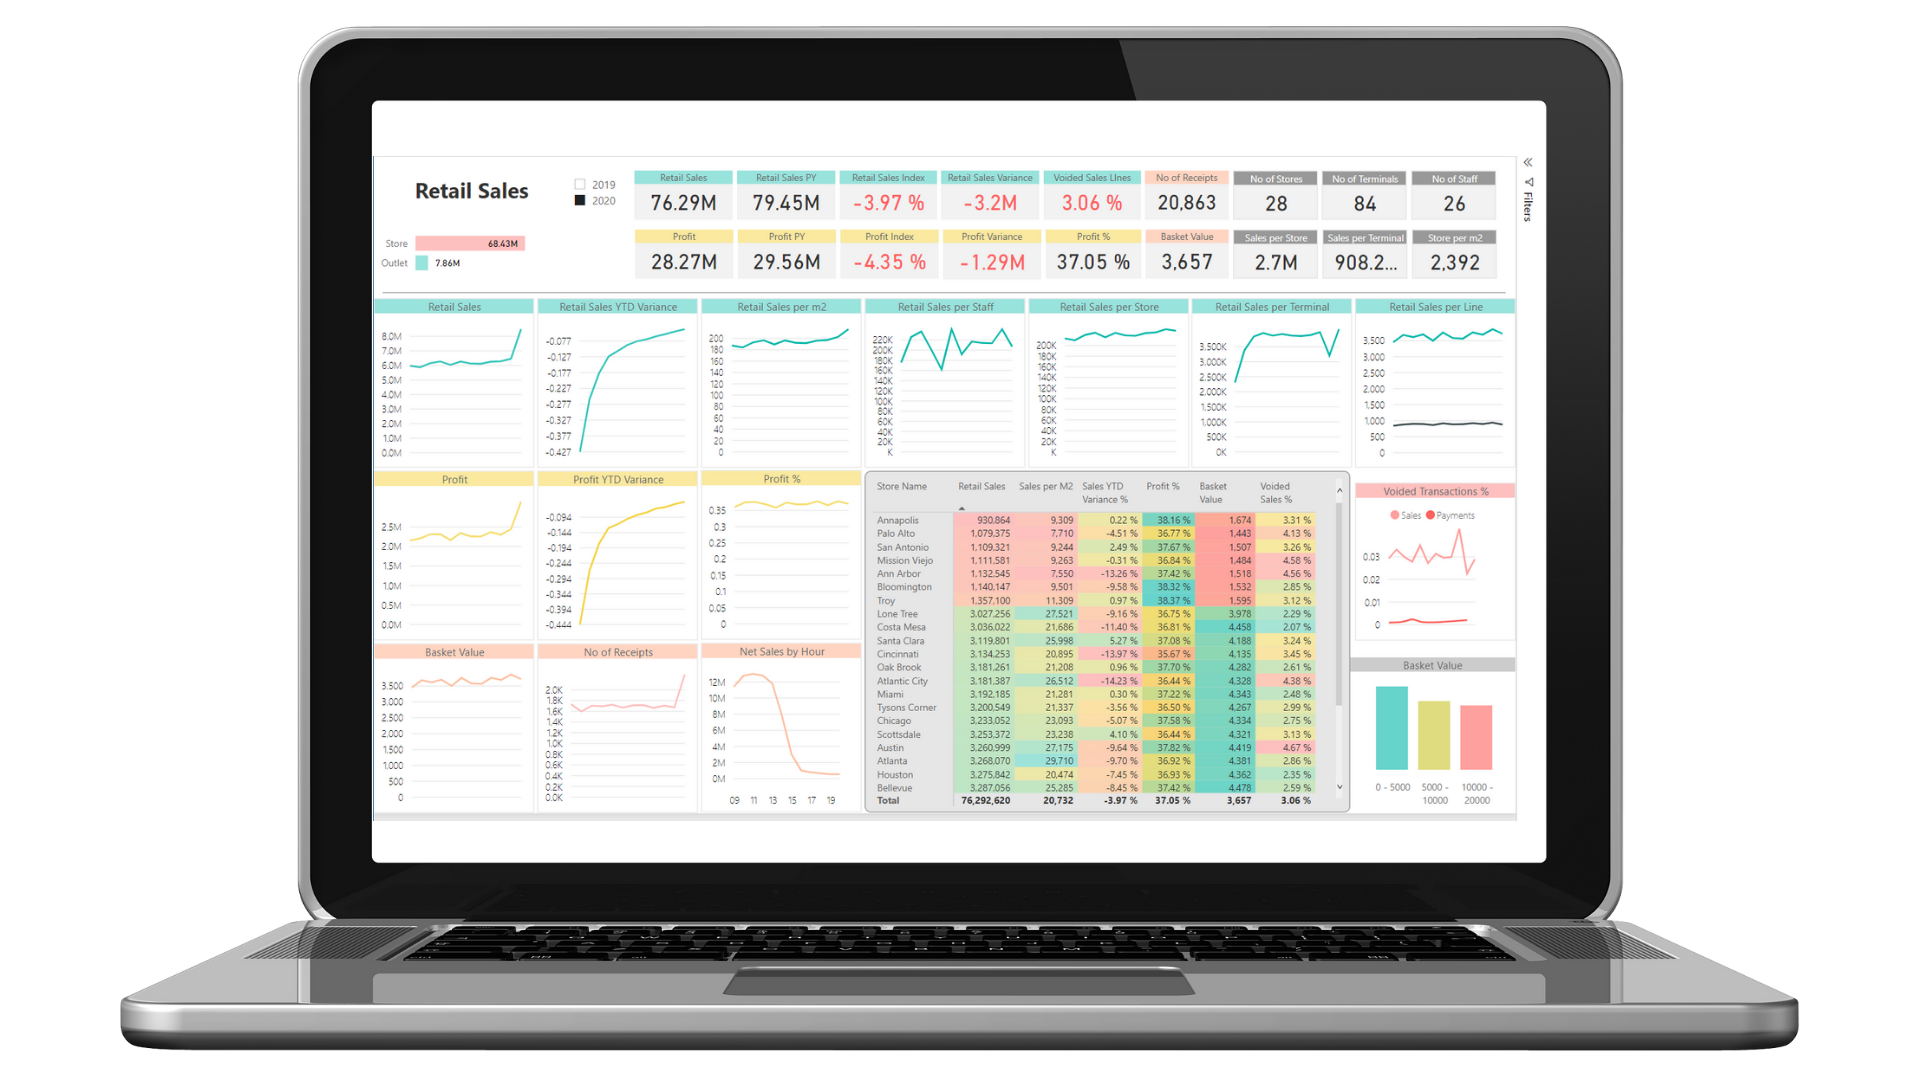
Power BI Retail Dashboard with 330 measures
POS Sales: Analyze Gross / Net Sales (per Line, M2, Item, Staff, Store and Terminal), Profit and Qty, Basket Value, Store Size, Returns, Tax, and Discounts. Well supported time intelligence with Daily / Weekly / Monthly Sales and many variances (YTD, MTD, WTD, YoY and PoP) of base measures. 89 measure are available in ACY (additional currency).
POS Payments: Analyze payment habits (Net Amount, Average Payment) by Tender Type, Card down to payment line.
POS Batch: Analyze POS events (durations, logons, returns, voids, transactions, returns).
POS Vouchers: Analyze Open amount, Net amount and Applied amount by Created, Applied and Expired Date of Vouchers.
Retail Store Information: Track Store Area M2 (from store information or from store sections) that is used for calculation of averages in other measure groups.
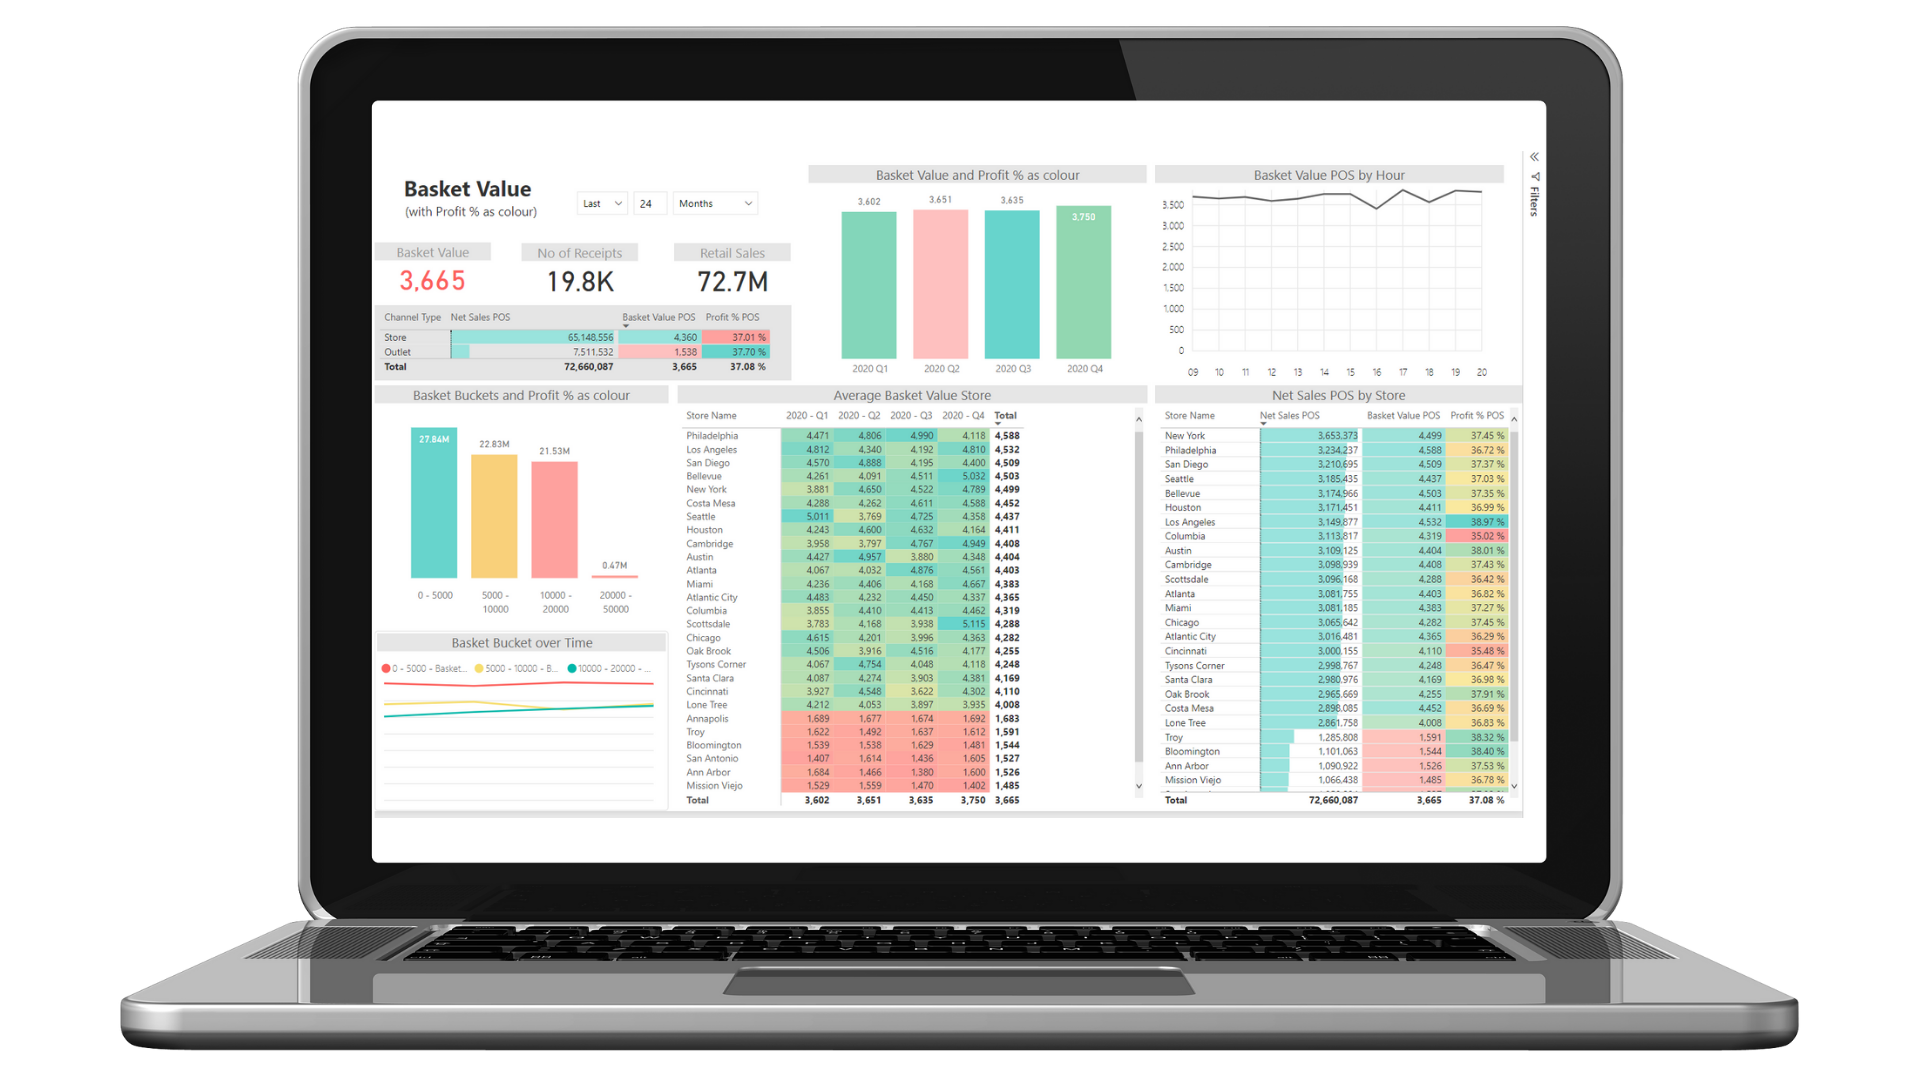
Power BI Retail Basket Value – Dashboard – Microsoft Dynamics – BI
Basket Buckets can be easily configured. Besides baskets analysis, we also offer a voided analysis. Voided POS Payments: Analyze voided payments.
Voided POS Sales: Analyze voided sales transactions.