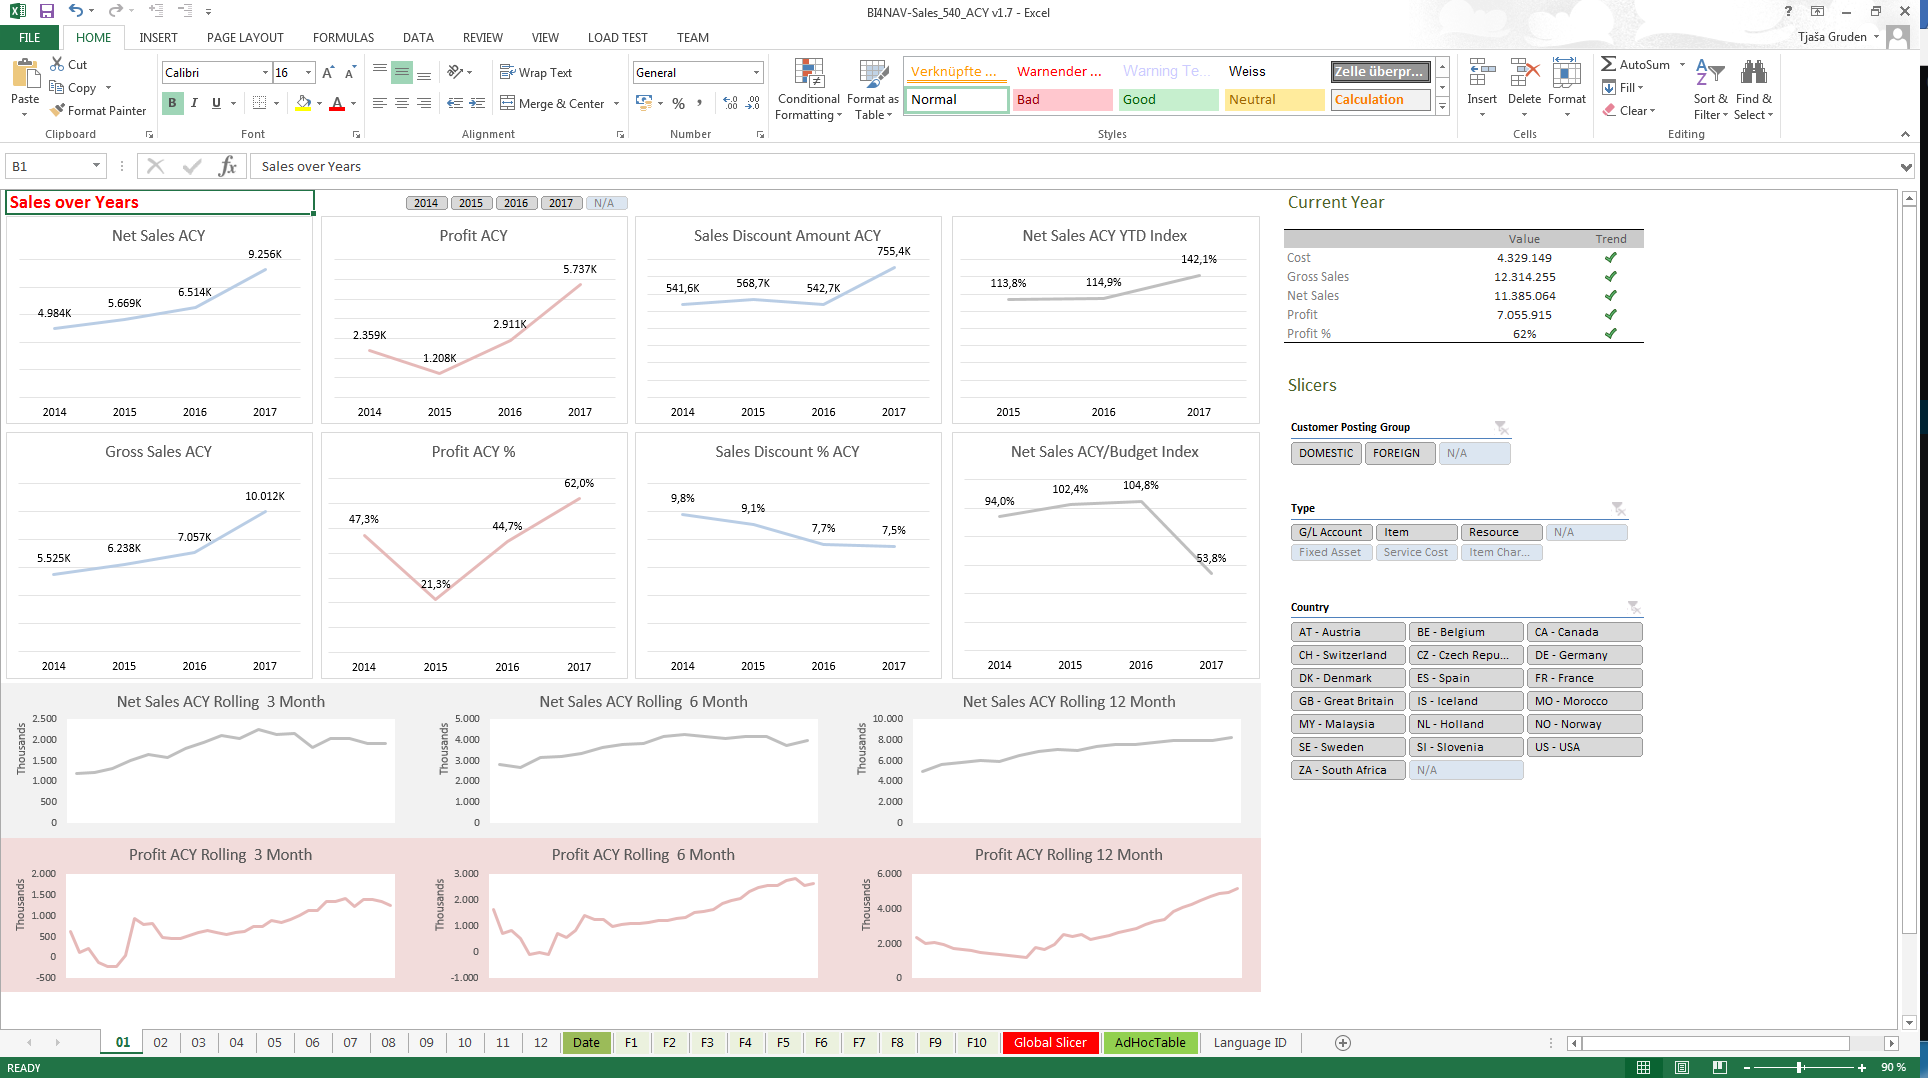
adhoc
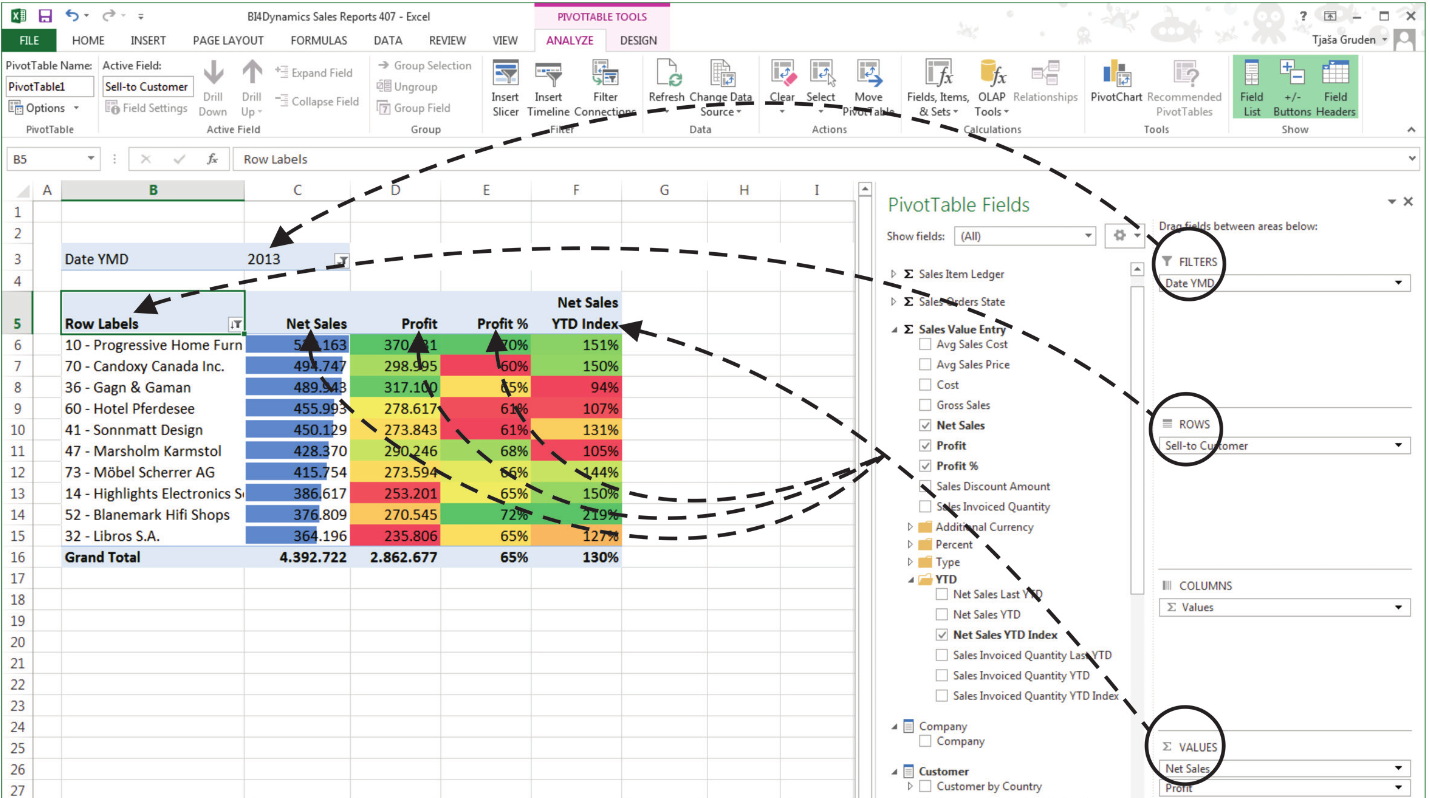
Pivot table field list that contains BI4Dynamics dimensions and measures. Attributes are automatically positioned in pivot table rows and columns by dragging and dropping.
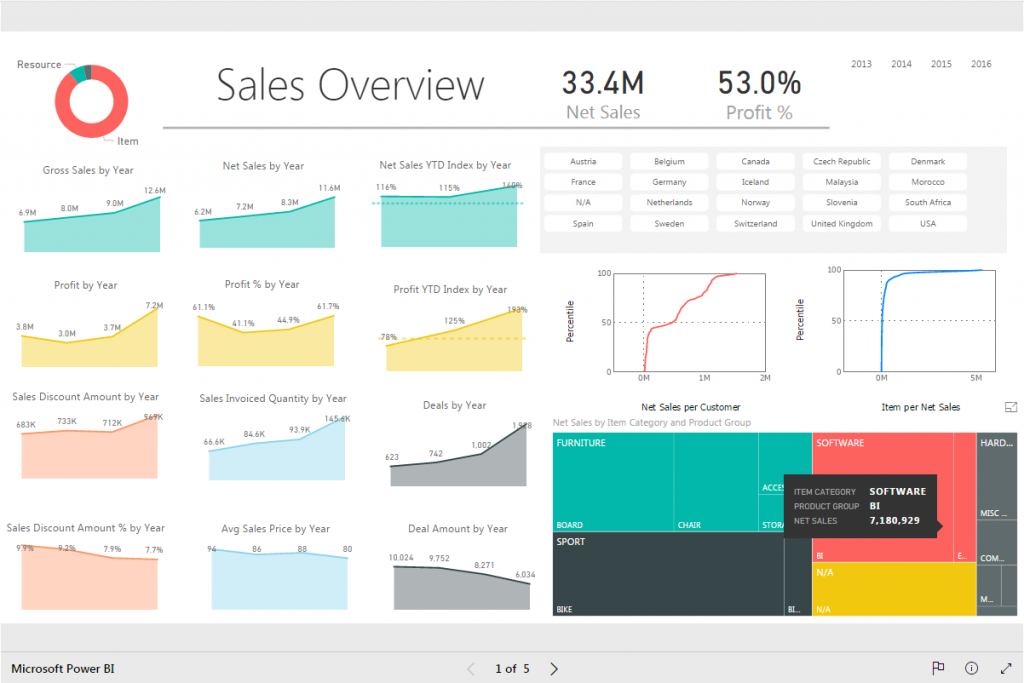
01-Sales-Report-Power-BI-BI4Dynamics-1024×683
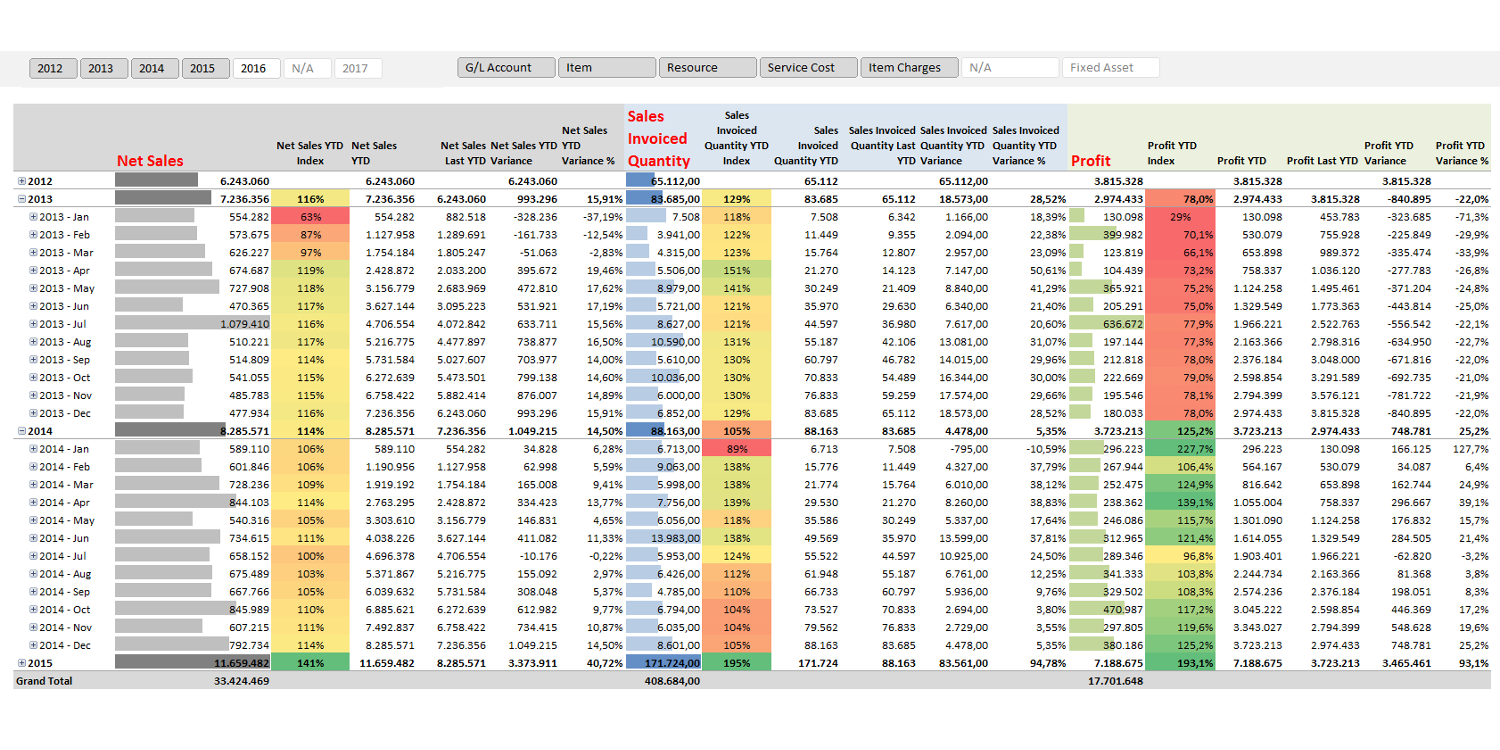
Sales YTD (Year-to-Date) Overview
Sales analysis isn’t complete without Year-to-Date selection of measures. This table enables the
view of Net Sales, Sales Invoiced Quantity and Profit.
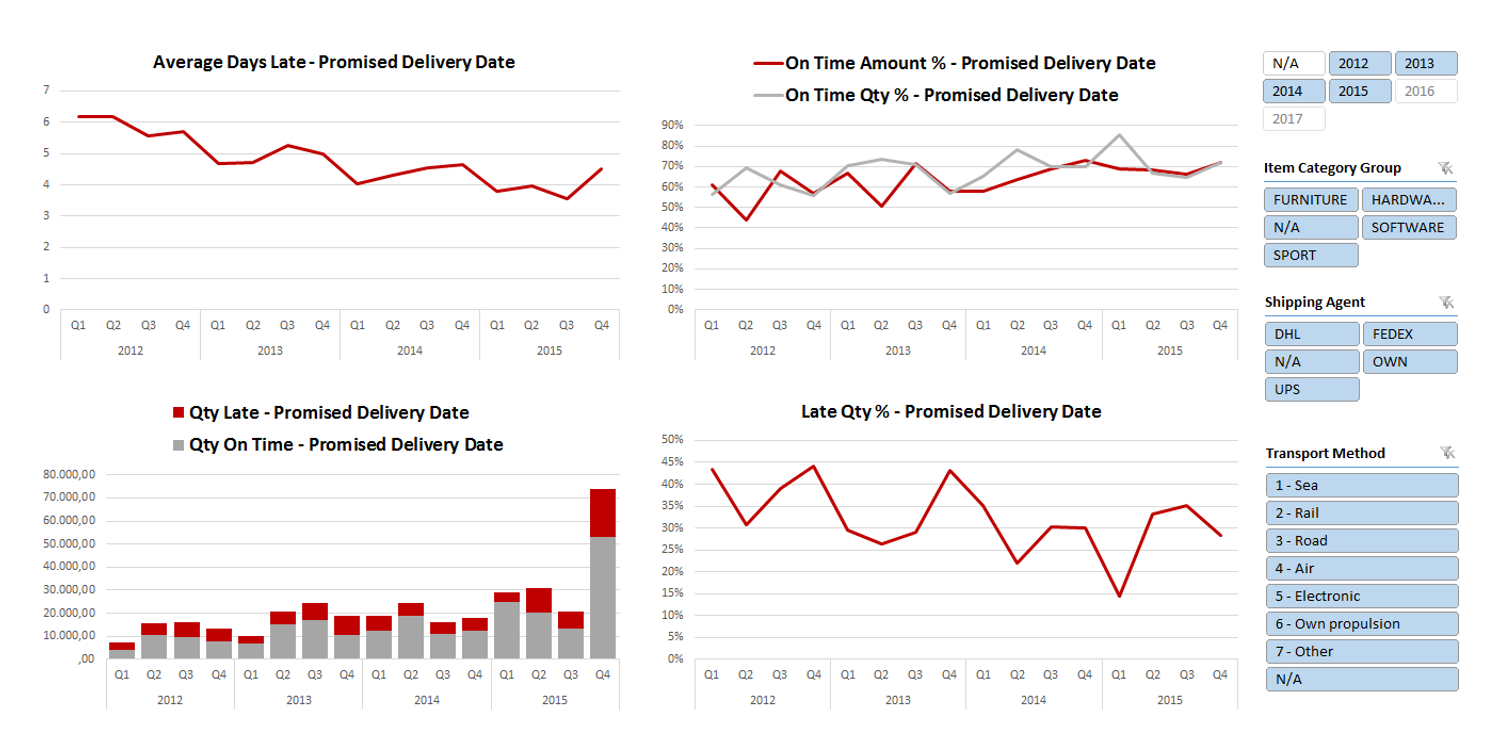
Sales Delivery Performance Dashboard
Track Sales Delivery Performance based on difference between Shipment date and one of following dates: Planned Delivery / Planned Shipment / Promised Delivery / Requested Delivery.
02-Receivables-Report-Power-BI-BI4Dynamics-Open-Receivables-1024×683
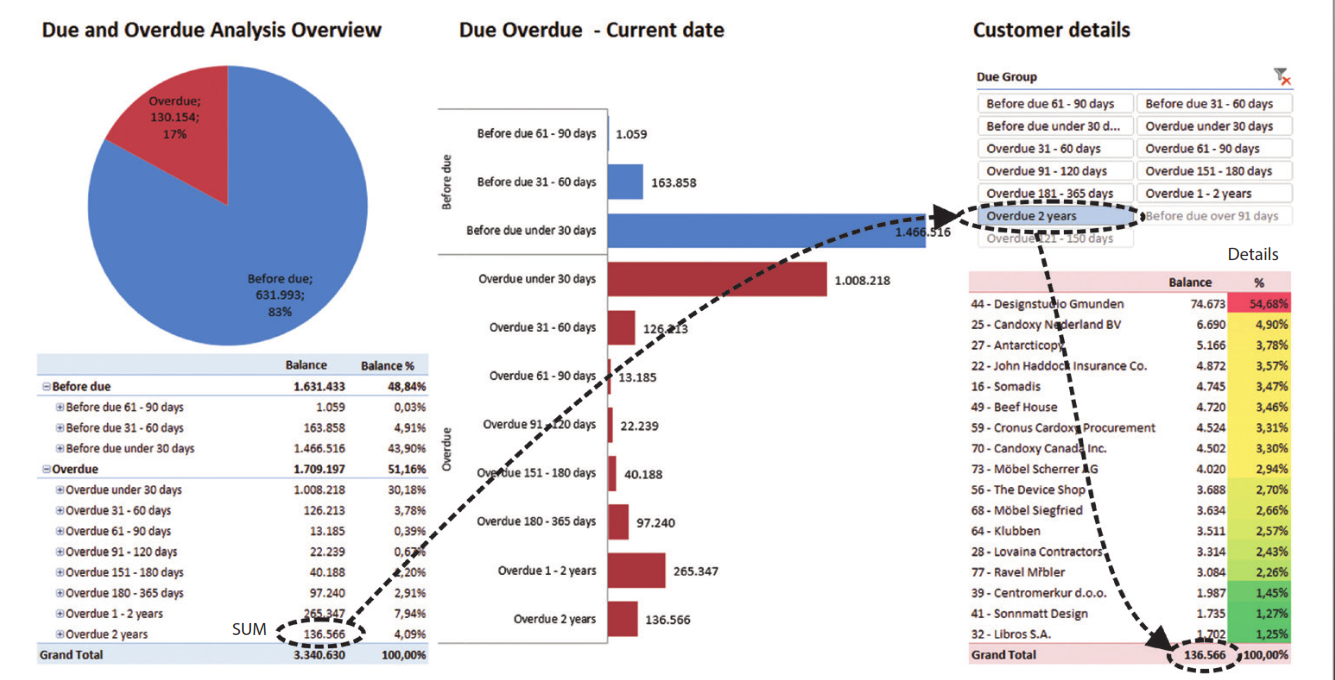
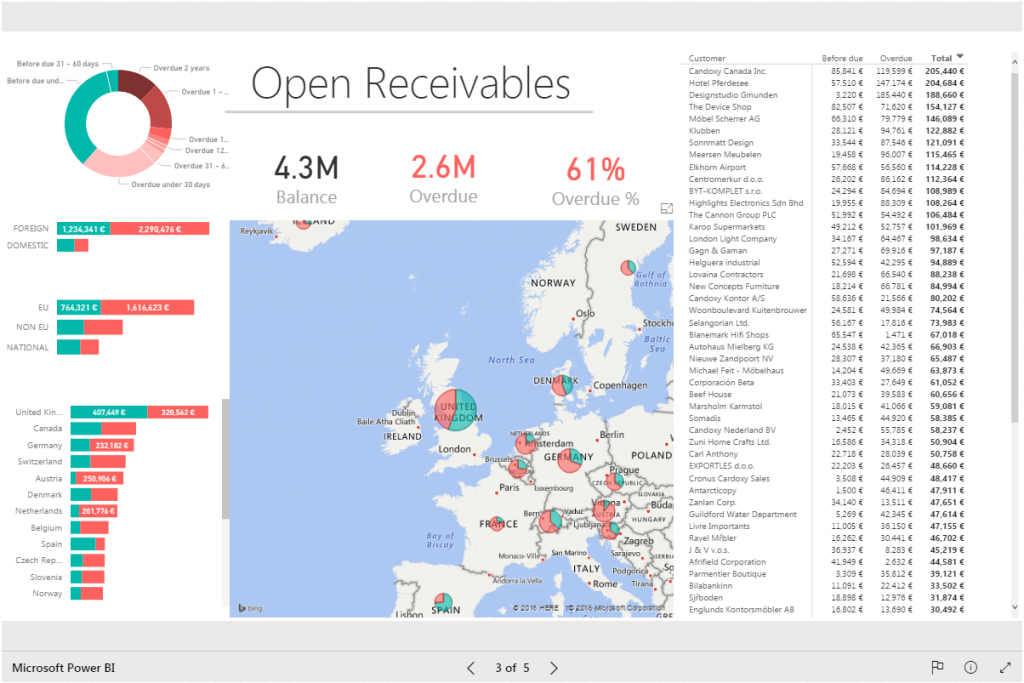
Receivables Analysis
Table with top 2 charts on the left shows Receivables Due / Overdue structure. The table on the right shows customer details for a specific overdue bucket.
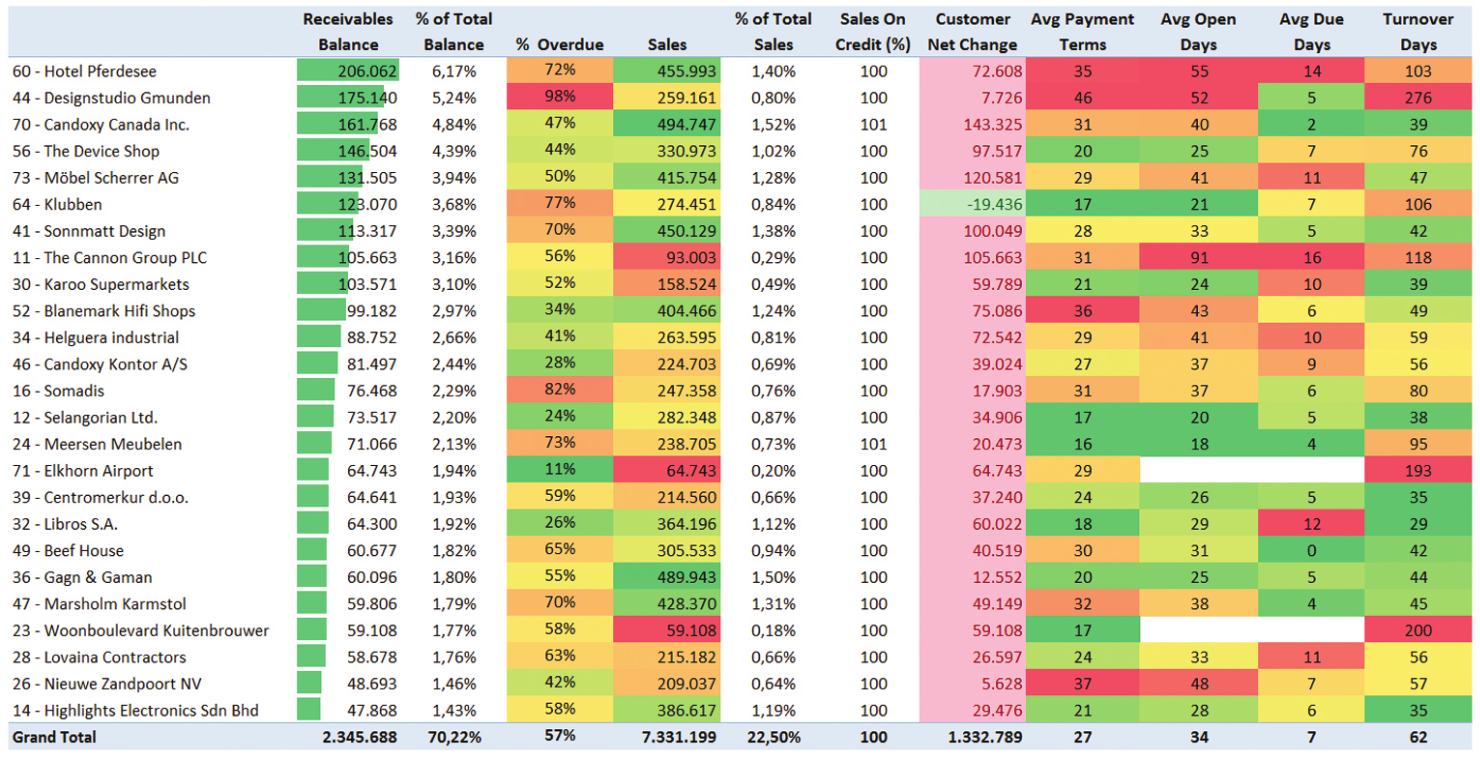
Receivables Table
Complete receivables view of top 20 Customers by Balance with special KPIs like % of Total Receivables, % of Total Sales, Sales on Credit and customers’ payment habits.
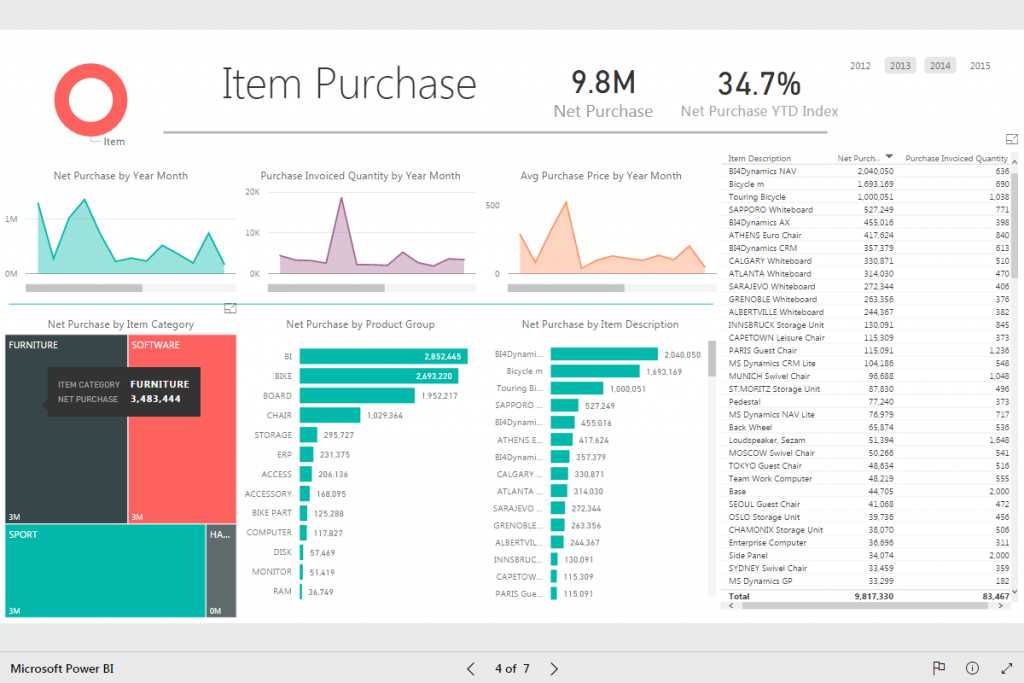
05-Item-Report-Power-BI-BI4Dynamics-Item-Purchase-1024×683
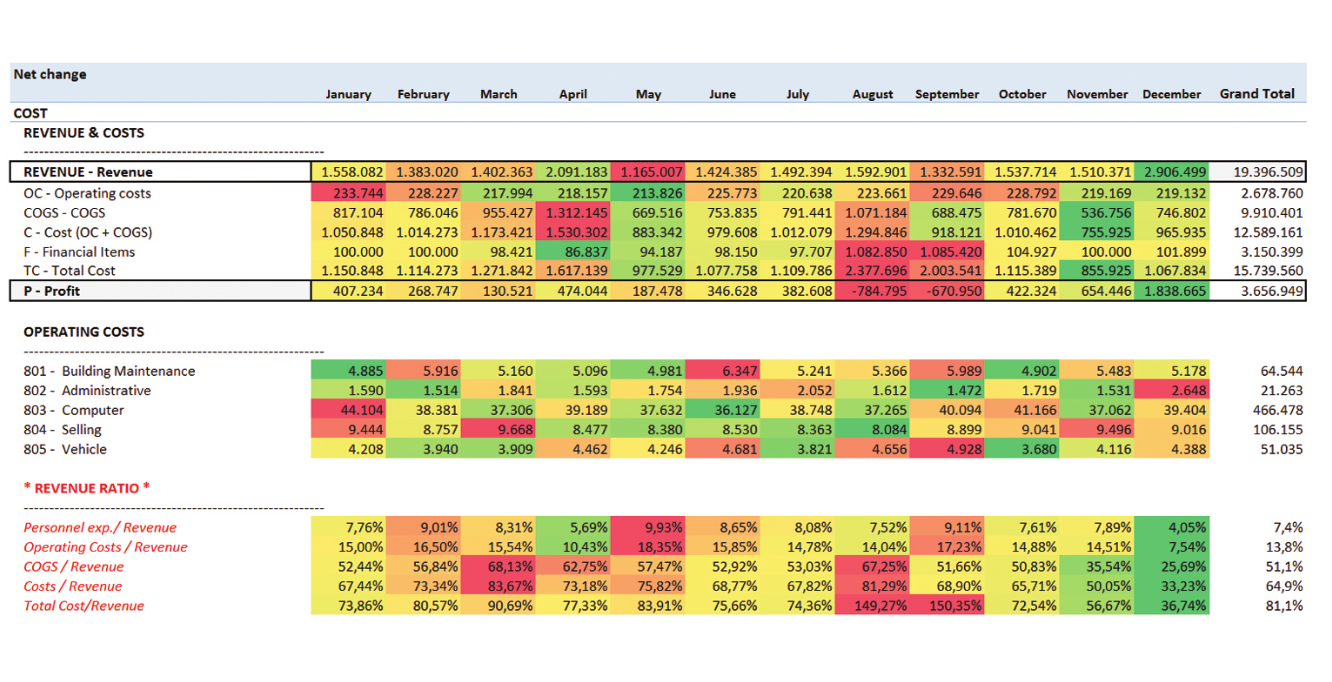
Account Schedules
In Microsoft Dynamics NAV users can define their own Account Schedule, after processing it with BI4Dynamics, Account Schedules will be shown in Excel. 100% flexibility. No IT staff. No IT vendor.
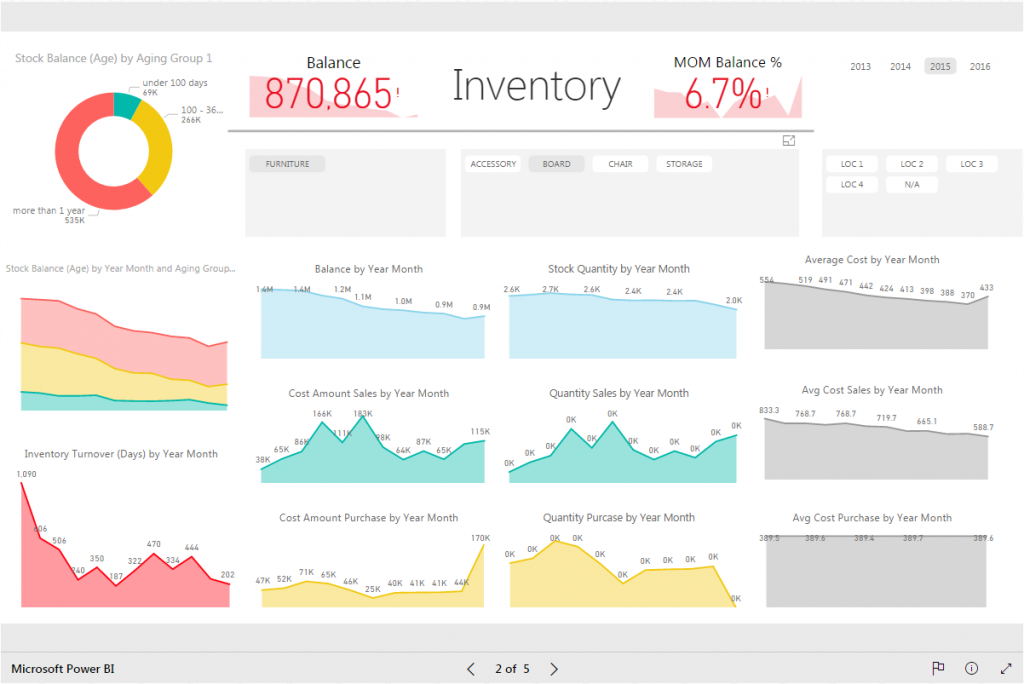
03-Inventory-Report-Power-BI-BI4Dynamics-By-Month-1024×684
ls-retail-1024×684
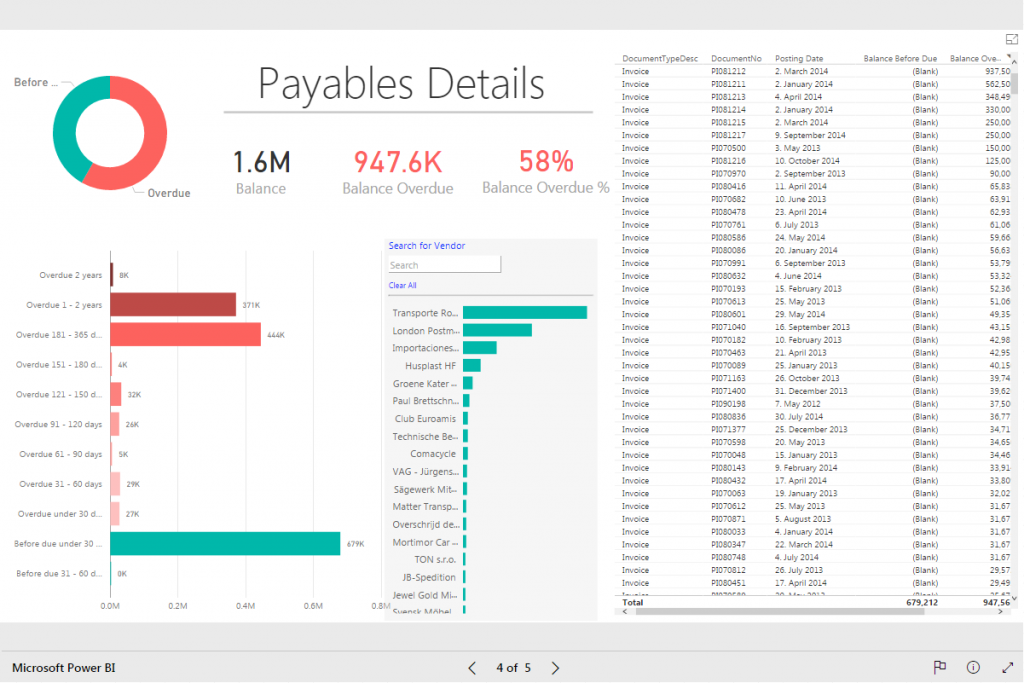
04-Payables-Report-Power-BI-BI4Dynamics-Details-1024×683