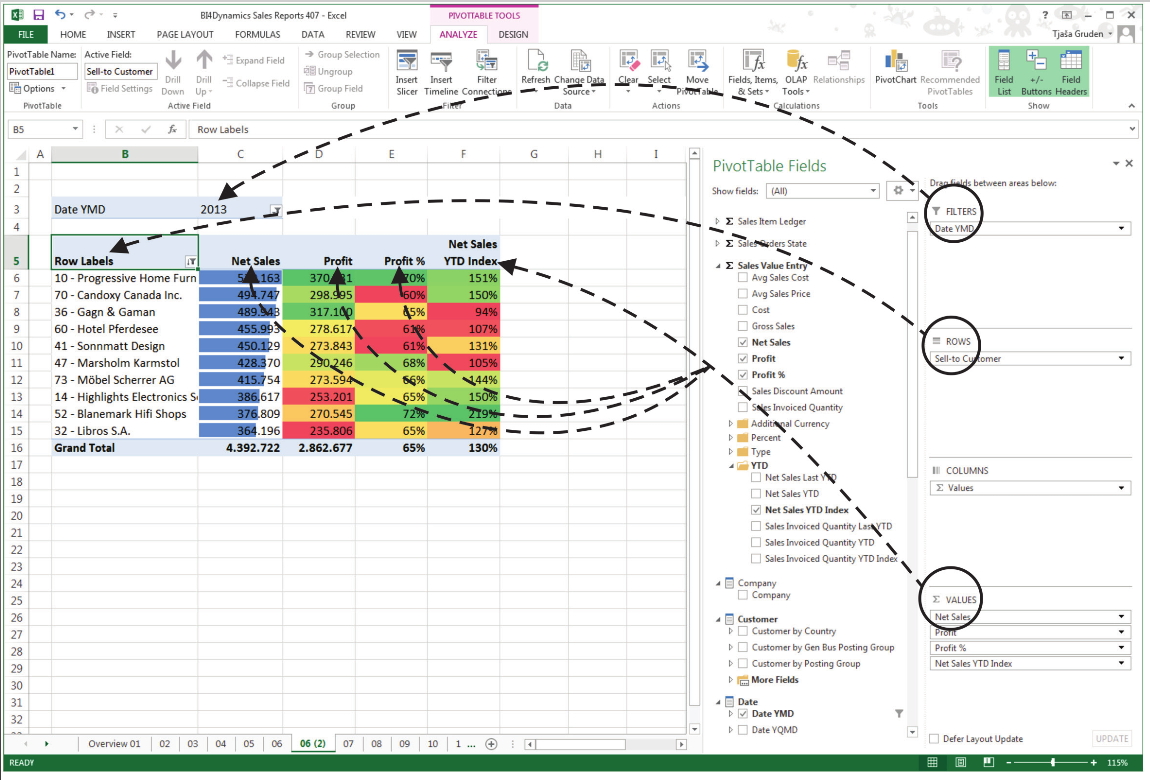
Working With Pivot Tables
Pivot table field list that contains BI4Dynamics dimensions and measures. Attributes are automatically positioned in pivot table rows and columns by dragging and dropping.
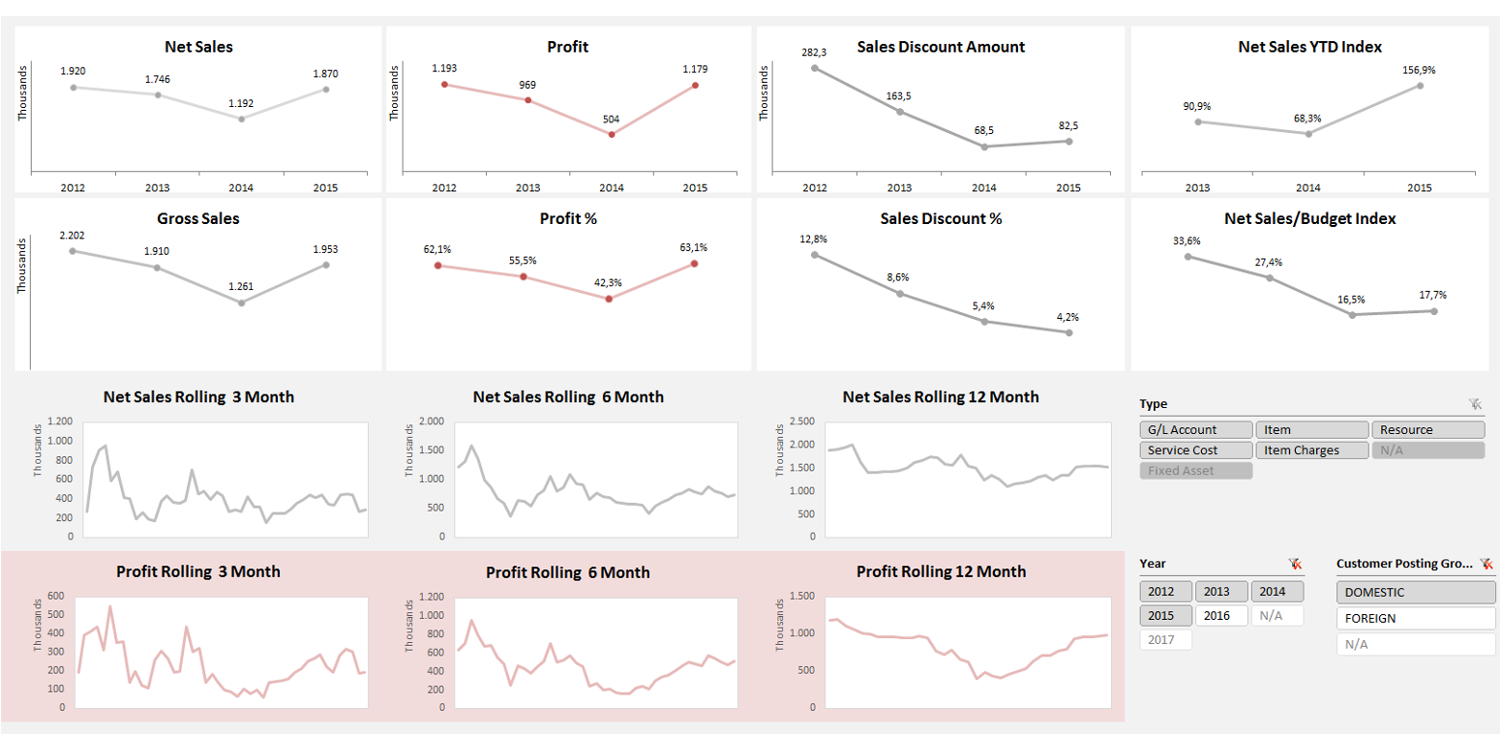
Sales over years
This dashboard includes KPIs in sales area, like Net Sales, Profit, Profit in %, Gross Sales, Sales Discount in % and Net Sales YTD Index. Sales over Years dashboard includes also Net Sales Rolling and Profit Rolling measure for 3, 6 and 12 months.
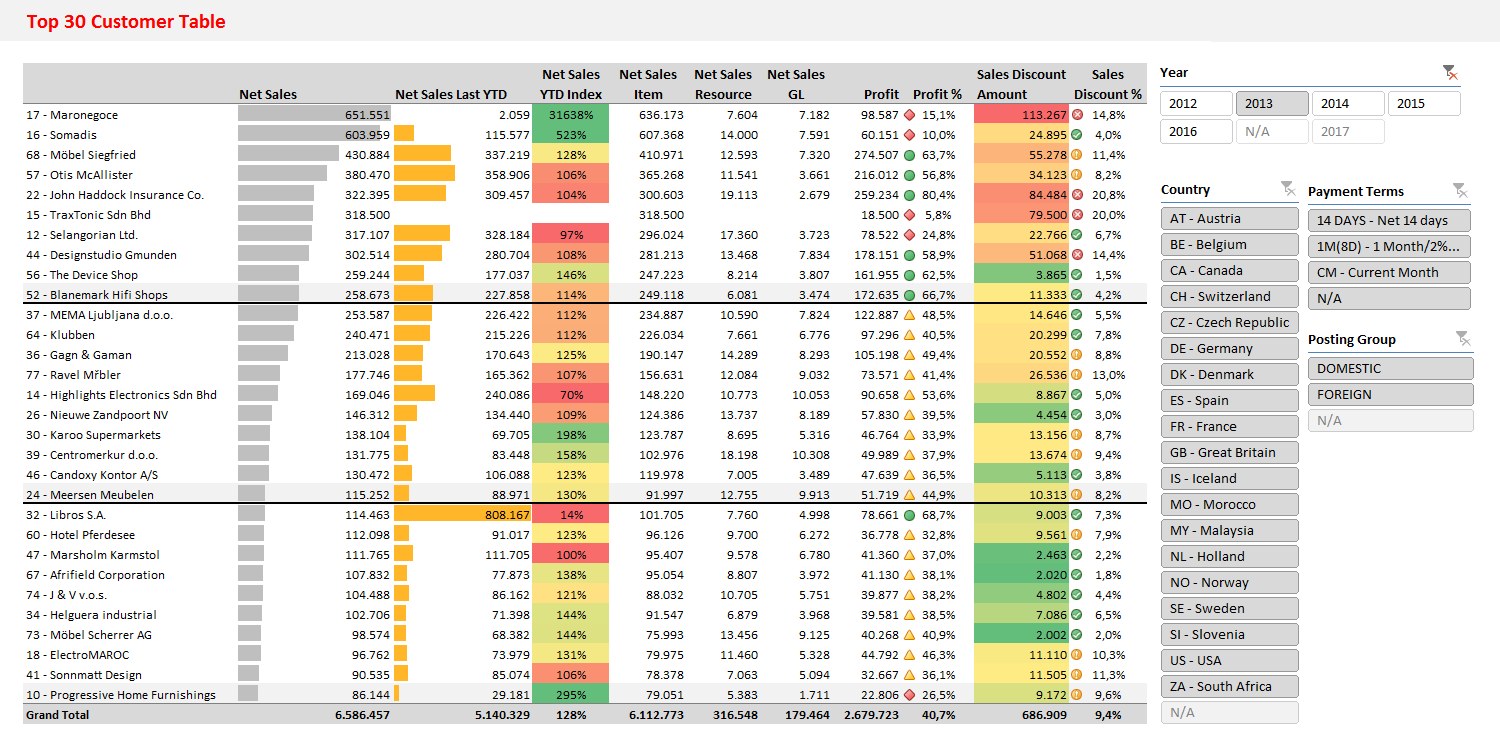
Sales – Top 30 customer table Report
That’s how everyone in your organisation should analyse sales data. Top 20 customers table includes Net Sales, YTD Indexes, Profit and Sales Discount in absolute value and in percentage.
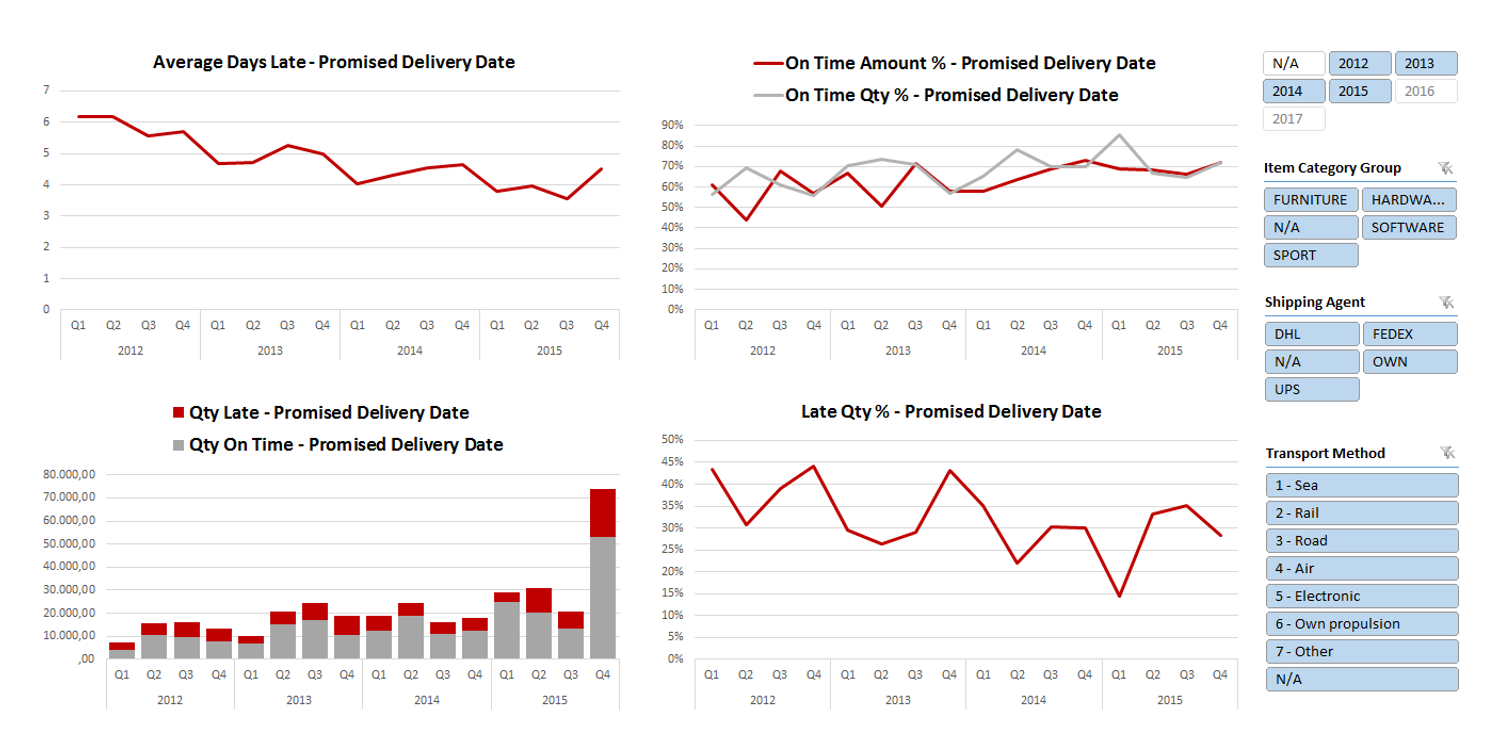
Sales Delivery Performance Dashboard
Track Sales Delivery Performance based on difference between Shipment date and one of following dates: Planned Delivery / Planned Shipment / Promised Delivery / Requested Delivery.
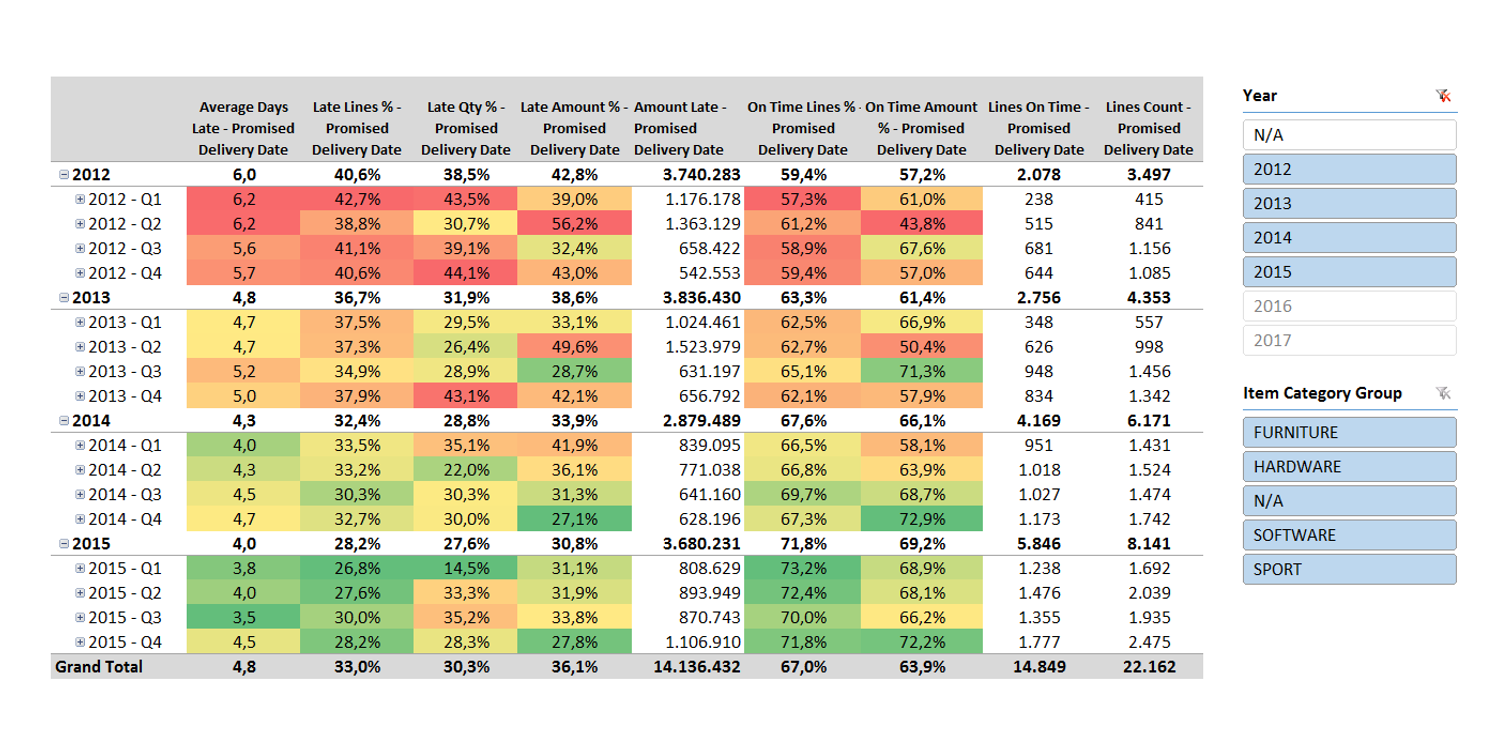
Sales Delivery Performance Table
Users can adopt the view by changing Item Category Group and Year slicer to see delivery performance measured by Promised Delivery Date with rich selection of measures.
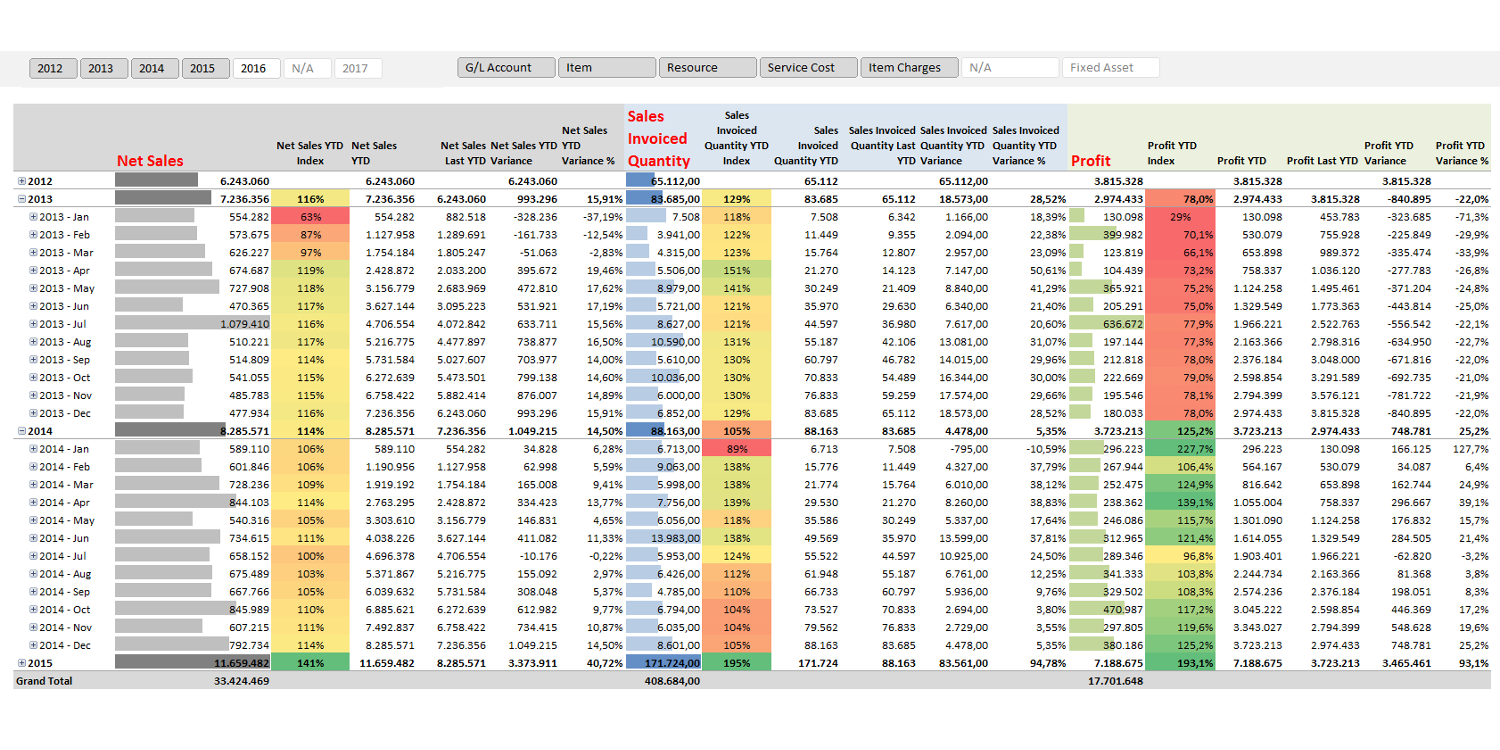
Sales YTD (Year-to-Date) Overview
Sales analysis isn’t complete without Year-to-Date selection of measures. This table enables the
view of Net Sales, Sales Invoiced Quantity and Profit.
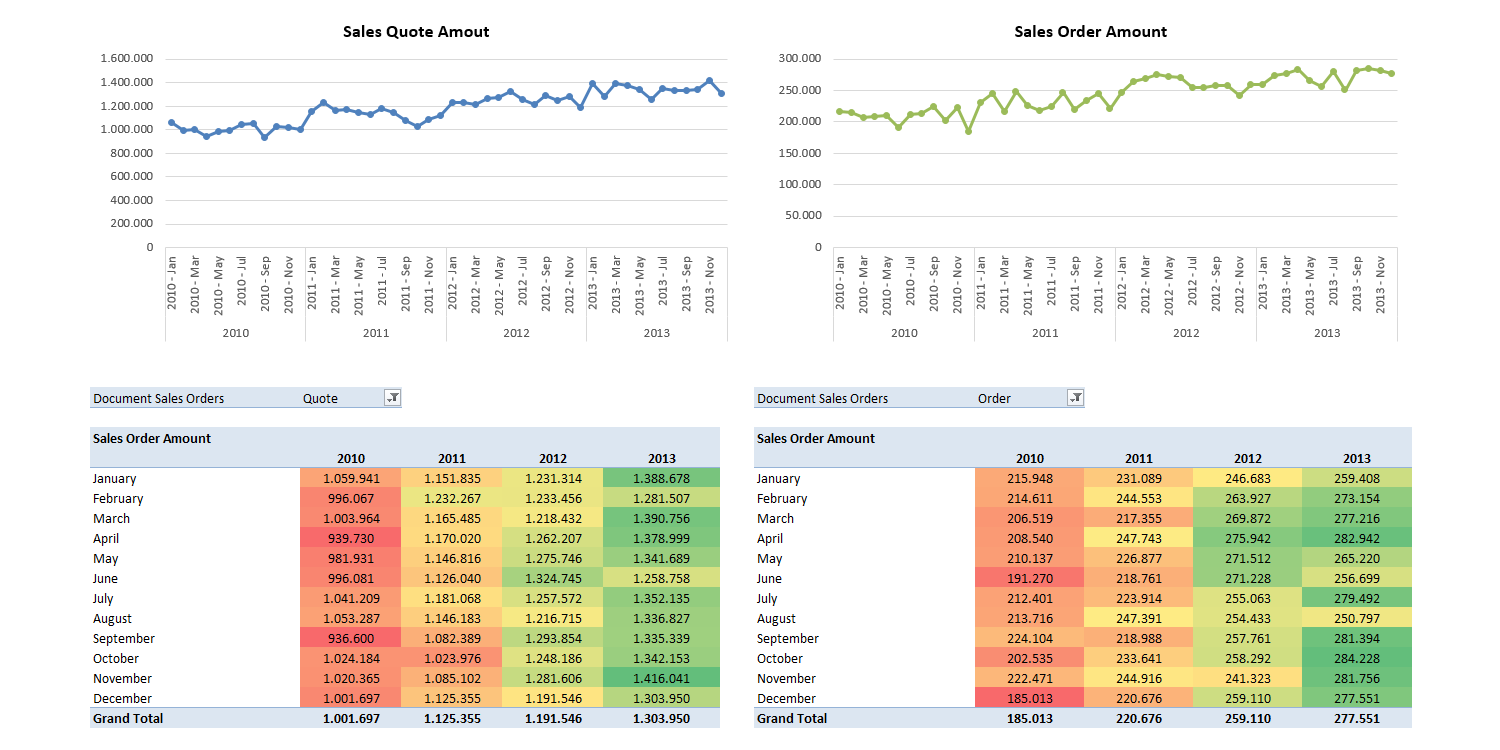
Sales Orders and Sales Quotes
This dashboard presents trend and actual numbers by years of Sales Quote Amount and Sales Order Amount. Snapshots are stored daily to BI4Dynamics Data Warehouse.
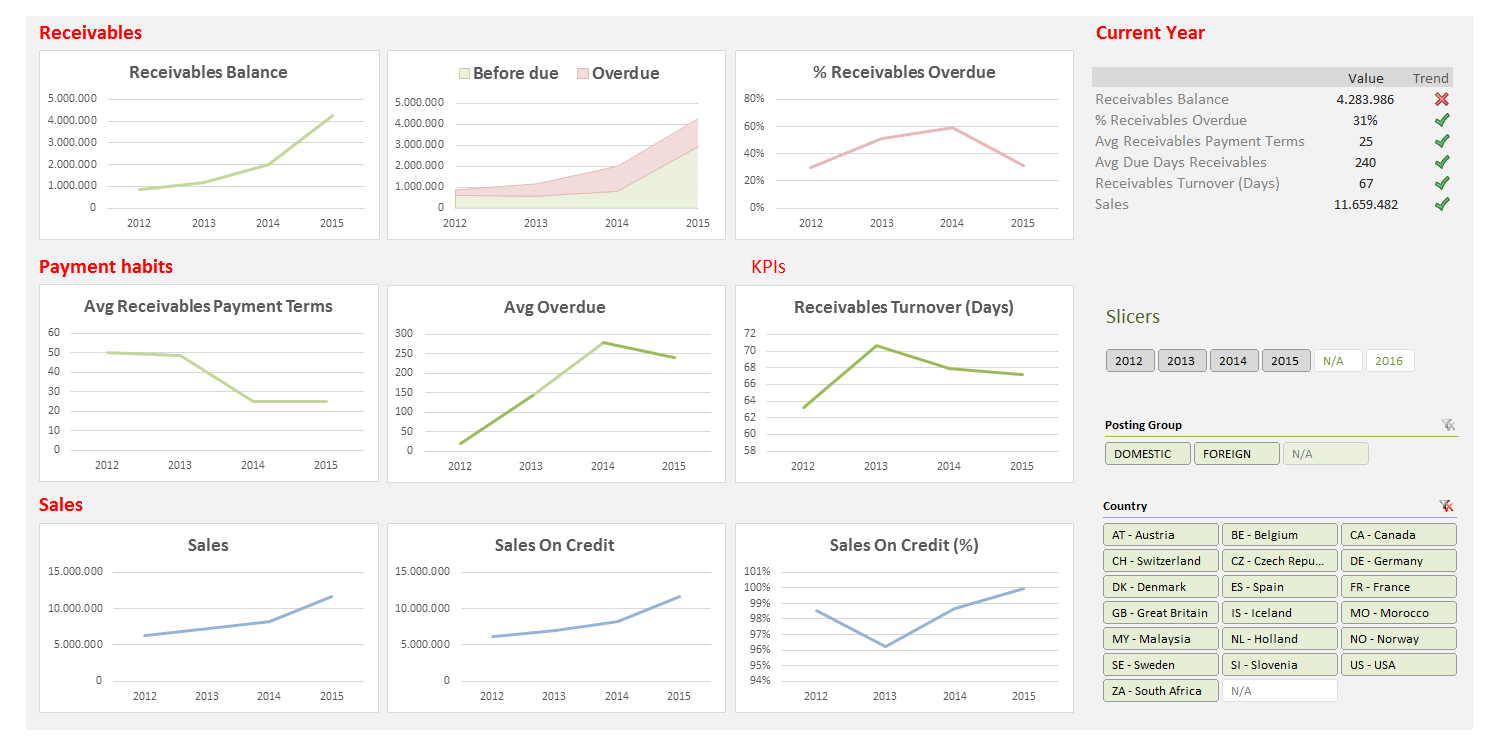
Receivables over Years
This overview shows most commonly used KPIs in receivables area, like Receivables Balance, Before Due and Overdue structure, Average Payment Terms, Late payments (Avg. Overdue), Receivables Turnover in Days and important sales measures.
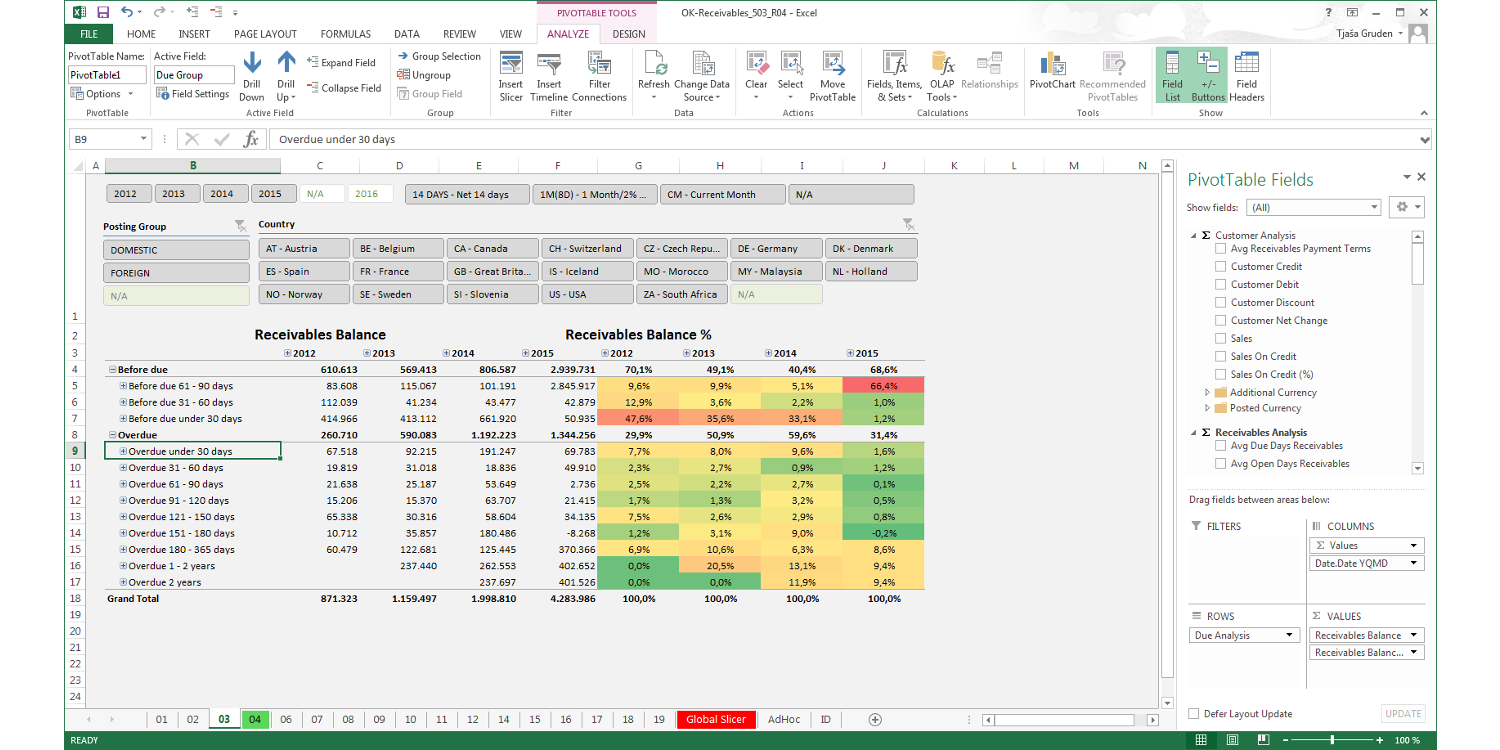
Receivables Due Analysis over Years
Receivables structure over years provides information for Before Due and Overdue receivables in absolute numbers and percentages with conditional formatting.
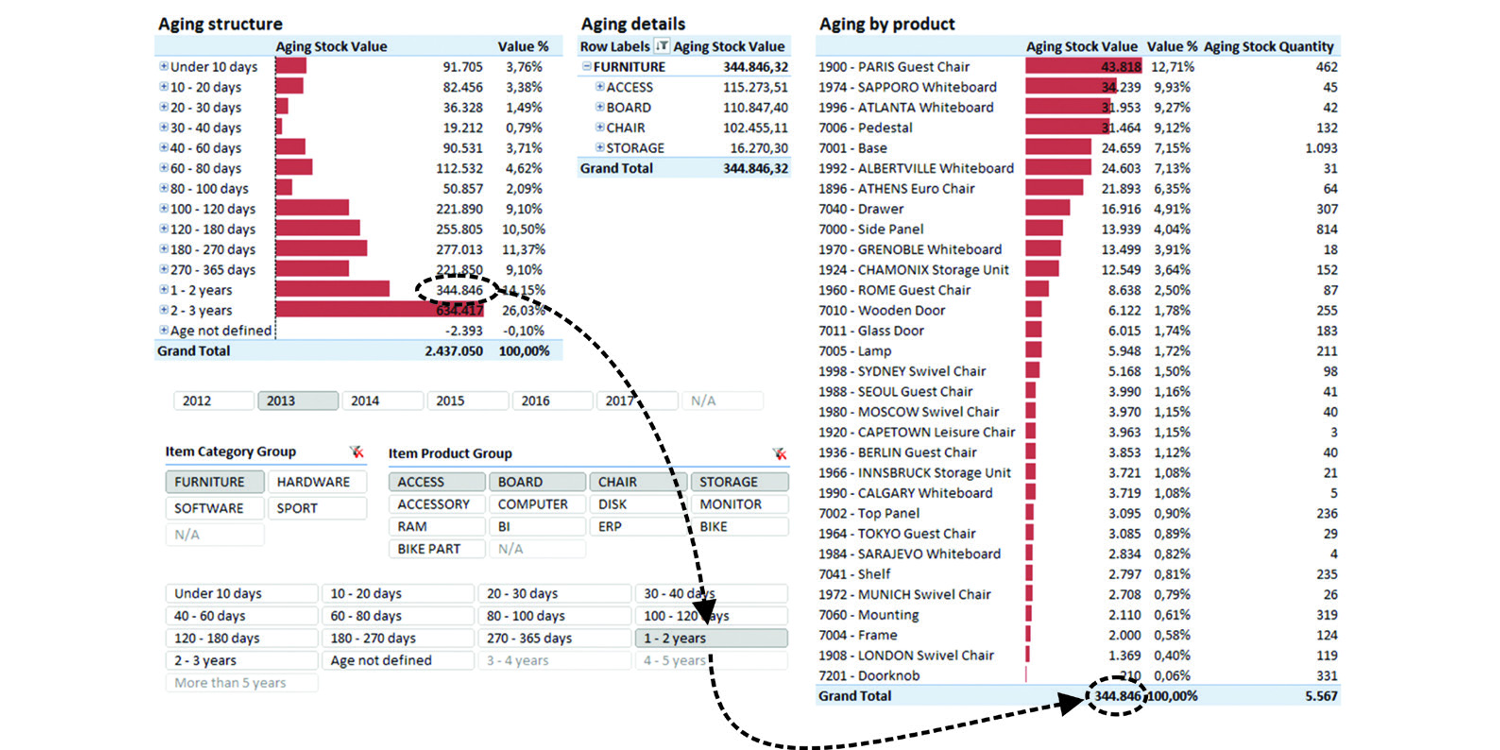
Inventory Value by Aging Group
Table on the left shows Aging structure buckets. Table on the right shows Inventory Aging by product for specific Aging bucket 1-2 years.
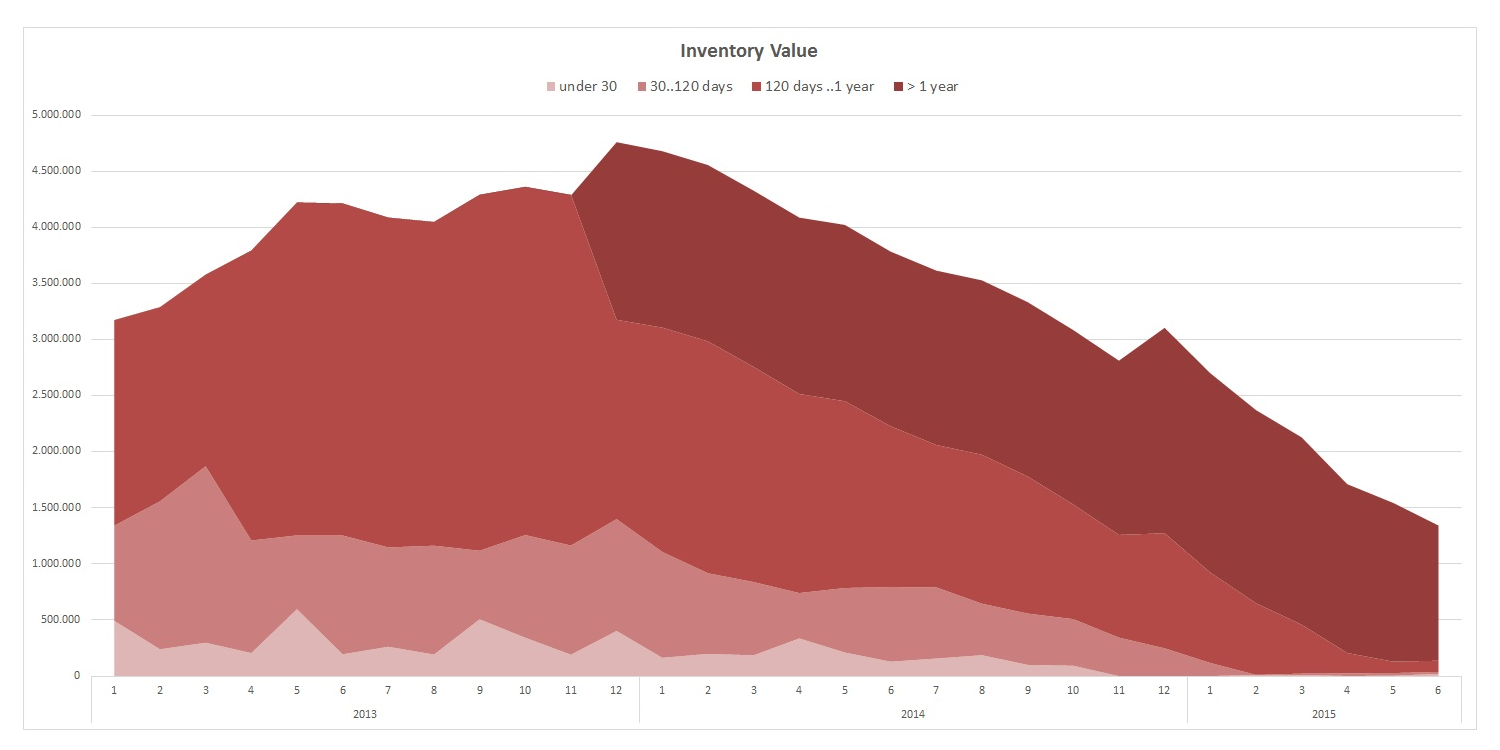
Inventory Aging
Graphical presentation of inventory aging buckets by Inventory value over months. Aging buckets can be easily adopted to client’s needs.
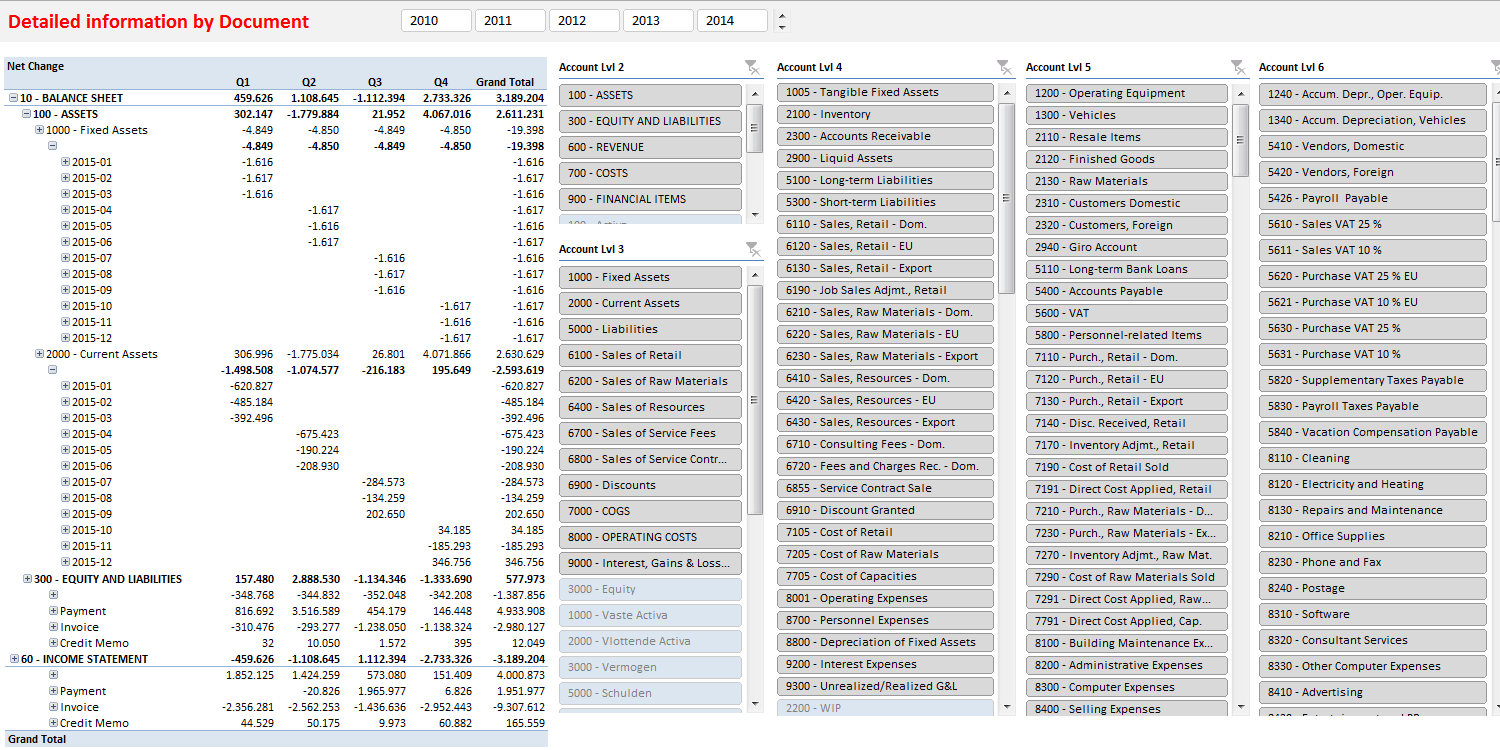
Finance Detailed Information by Document Level
The most detailed level in all BI4Dynamics is document level. Docments are grouped by Year-Month group for more efficient work.
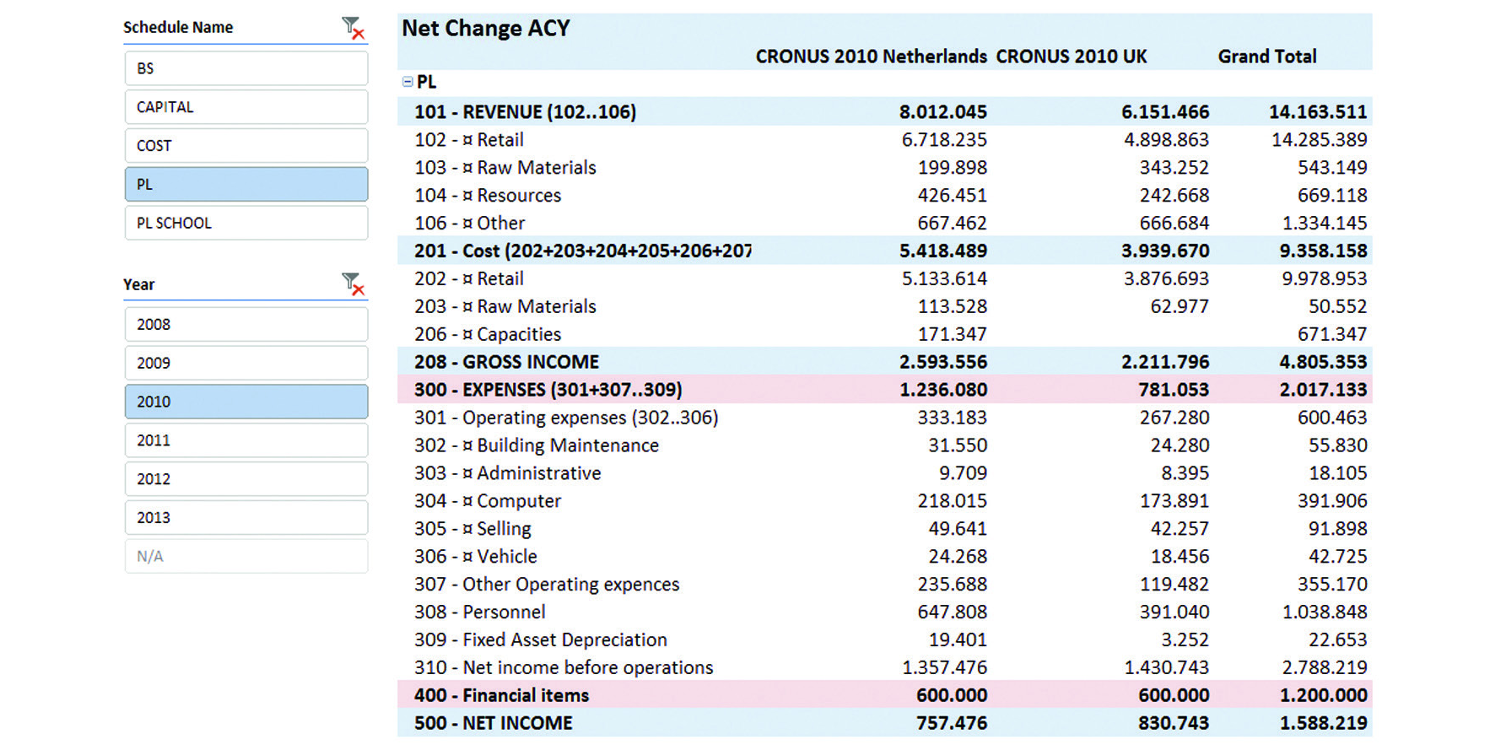
Finance Multi Company Profit and Loss Statement
BI4Dynamics enables financial analysing over multiple companies, companies and currencies.
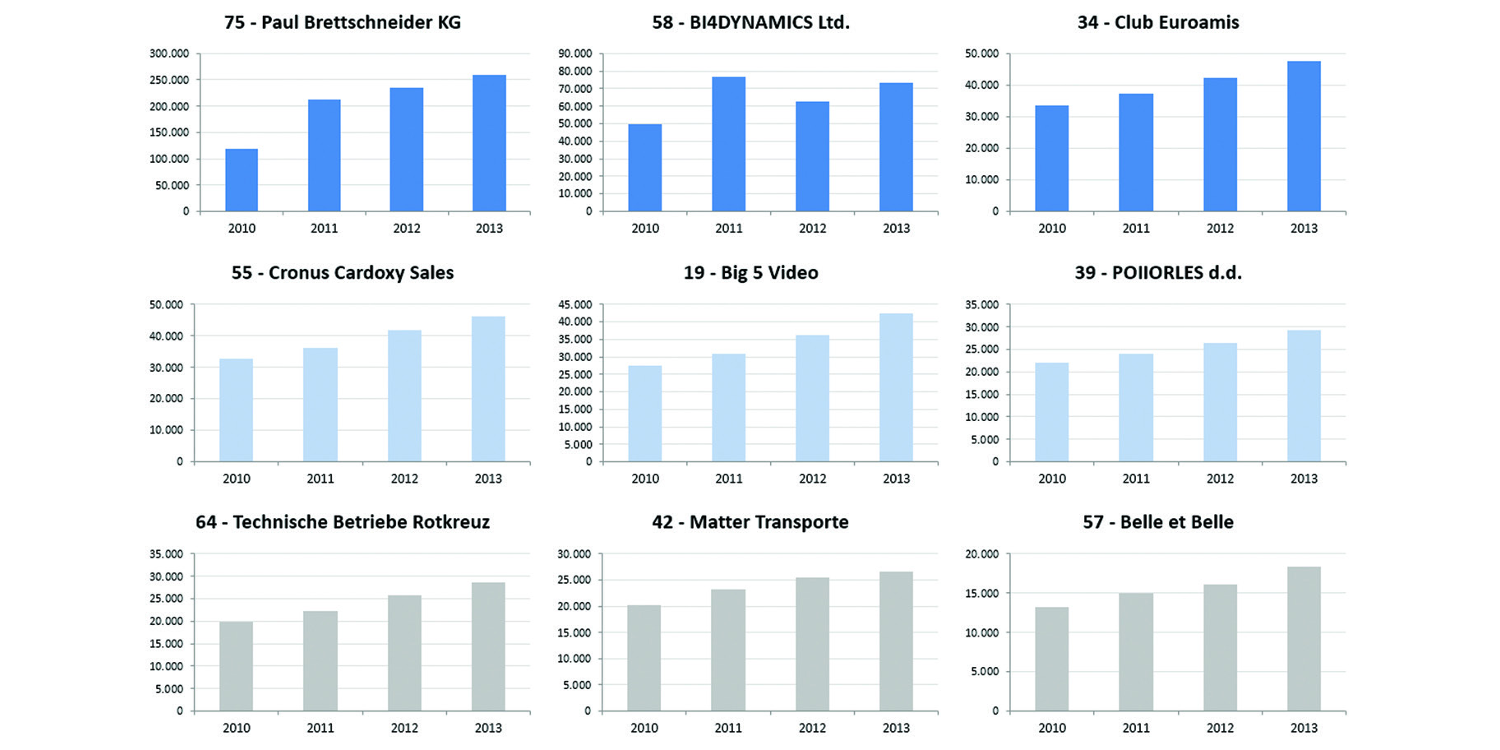
Purchase Top Vendors Dashboard over Years
For a strategic overview we use the Top Vendors Dashboard which displays top 9 vendors by Purchase Amount.
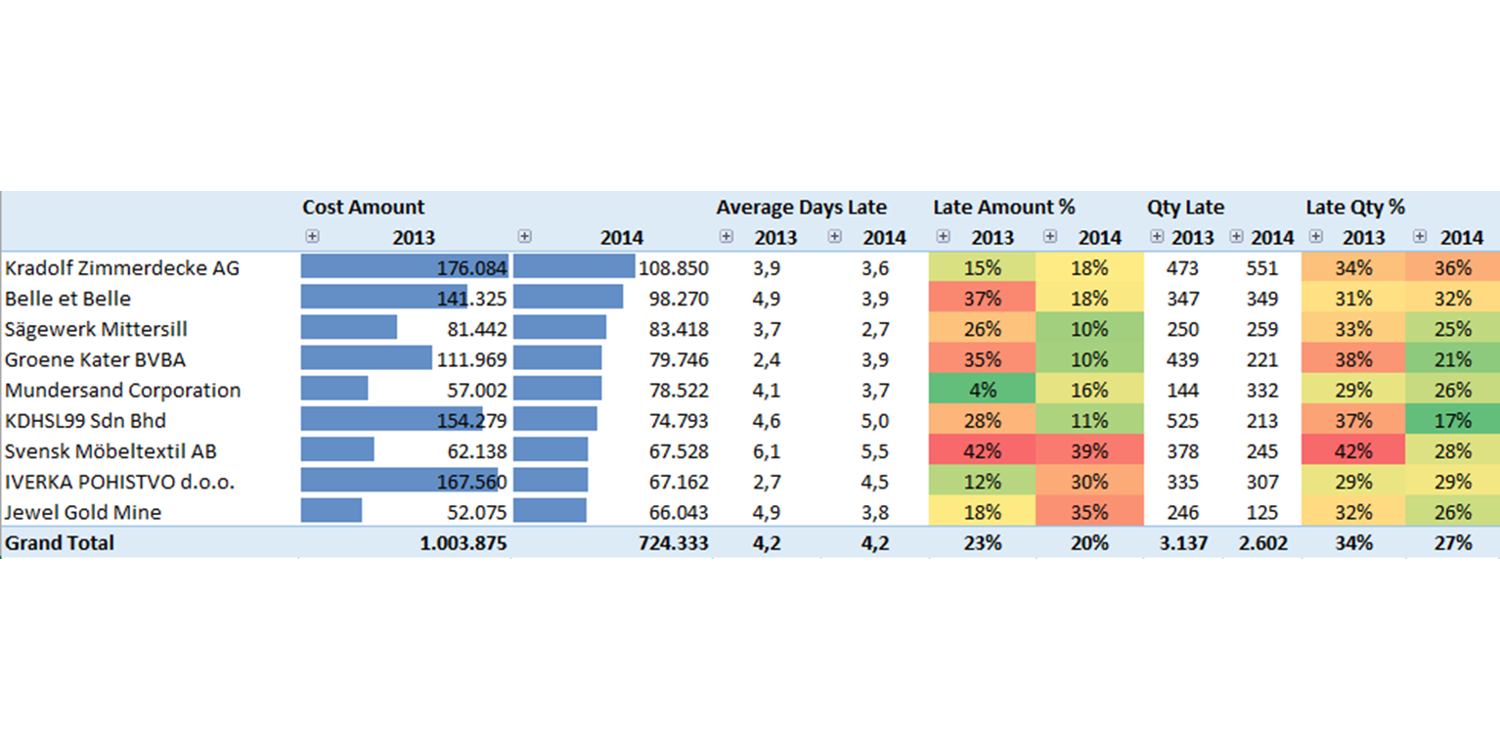
Purchase Delivery Performance
With Purchase Delivery Performance we can track how our vendors are performing.
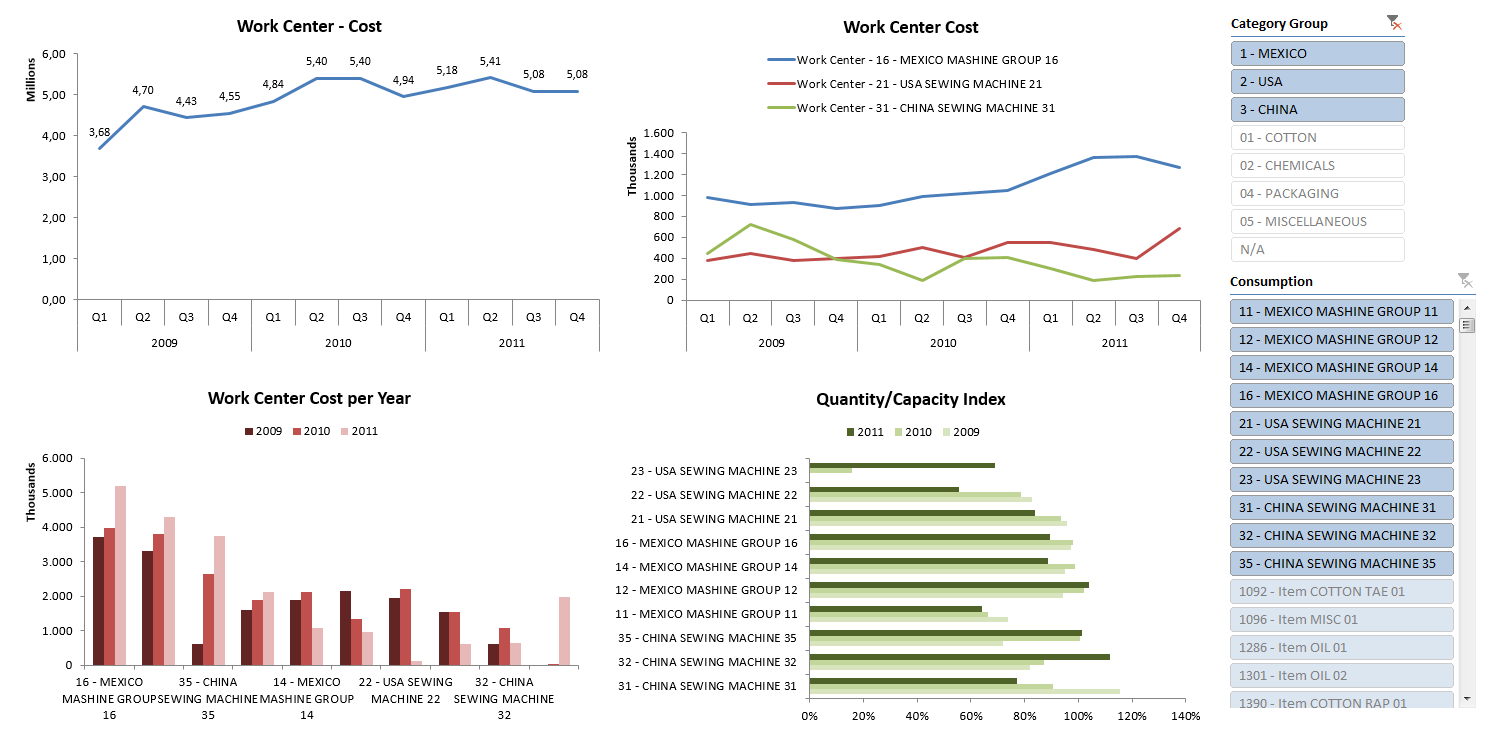
Manufacturing Work Center Anaysis
ork centre is defined (in NAV) as Machine or Resource. It can be grouped as a Work Center Group. This is an overview of Work Center quantity, cost and Capacity Index over quarters.
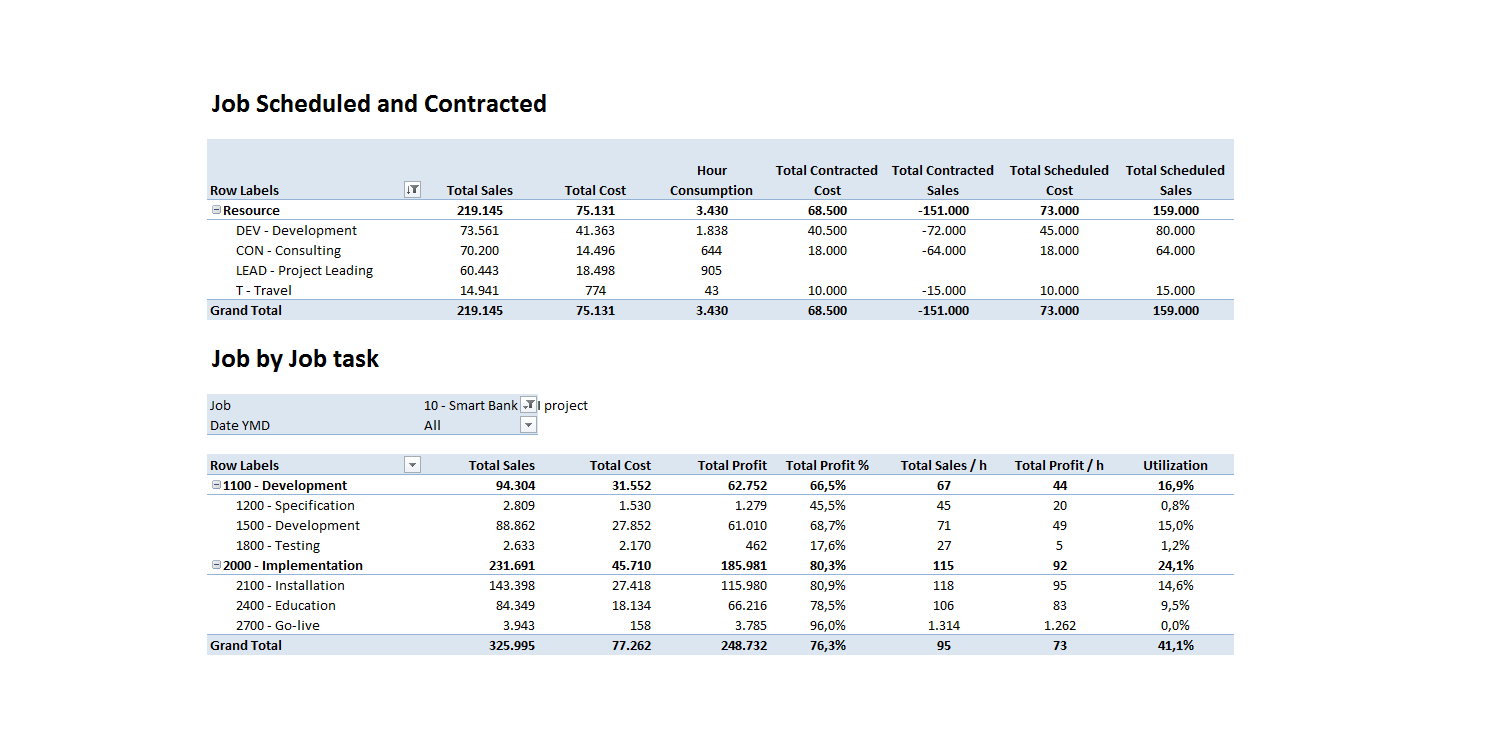
Job by Job Task
Jobs and Resources cube covers all important measures; Actual, Scheduled and Contracted Type of measures.
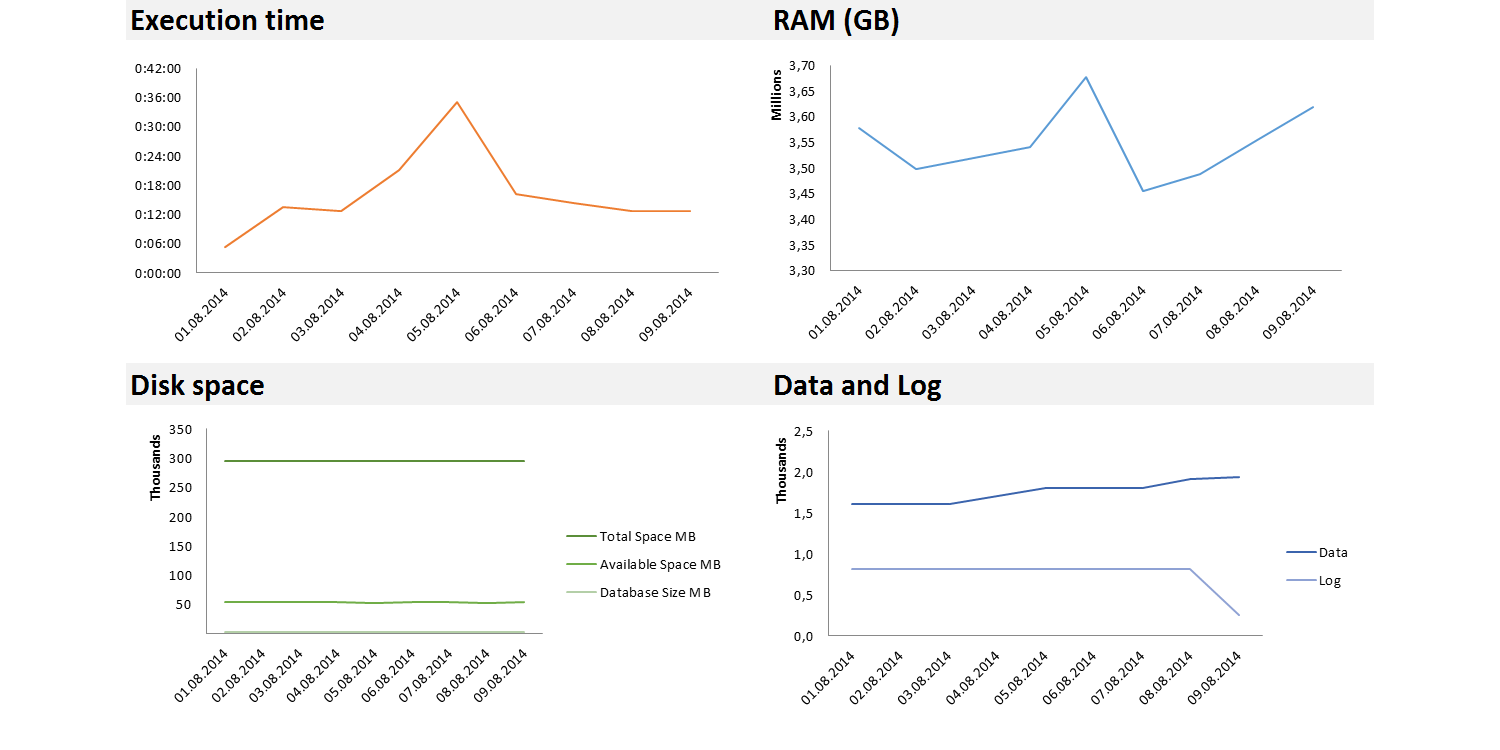
BI4Dynamics Profiler Dashboard
Profiler enables analyses of procedures. In this table you can see how many rows were created, changed and how many KB of disk space was needed by procedure.
BI4Dynamics Pofiler Snapshot Badge Table
On this table we see the data over badges that were processed.